

Introduction
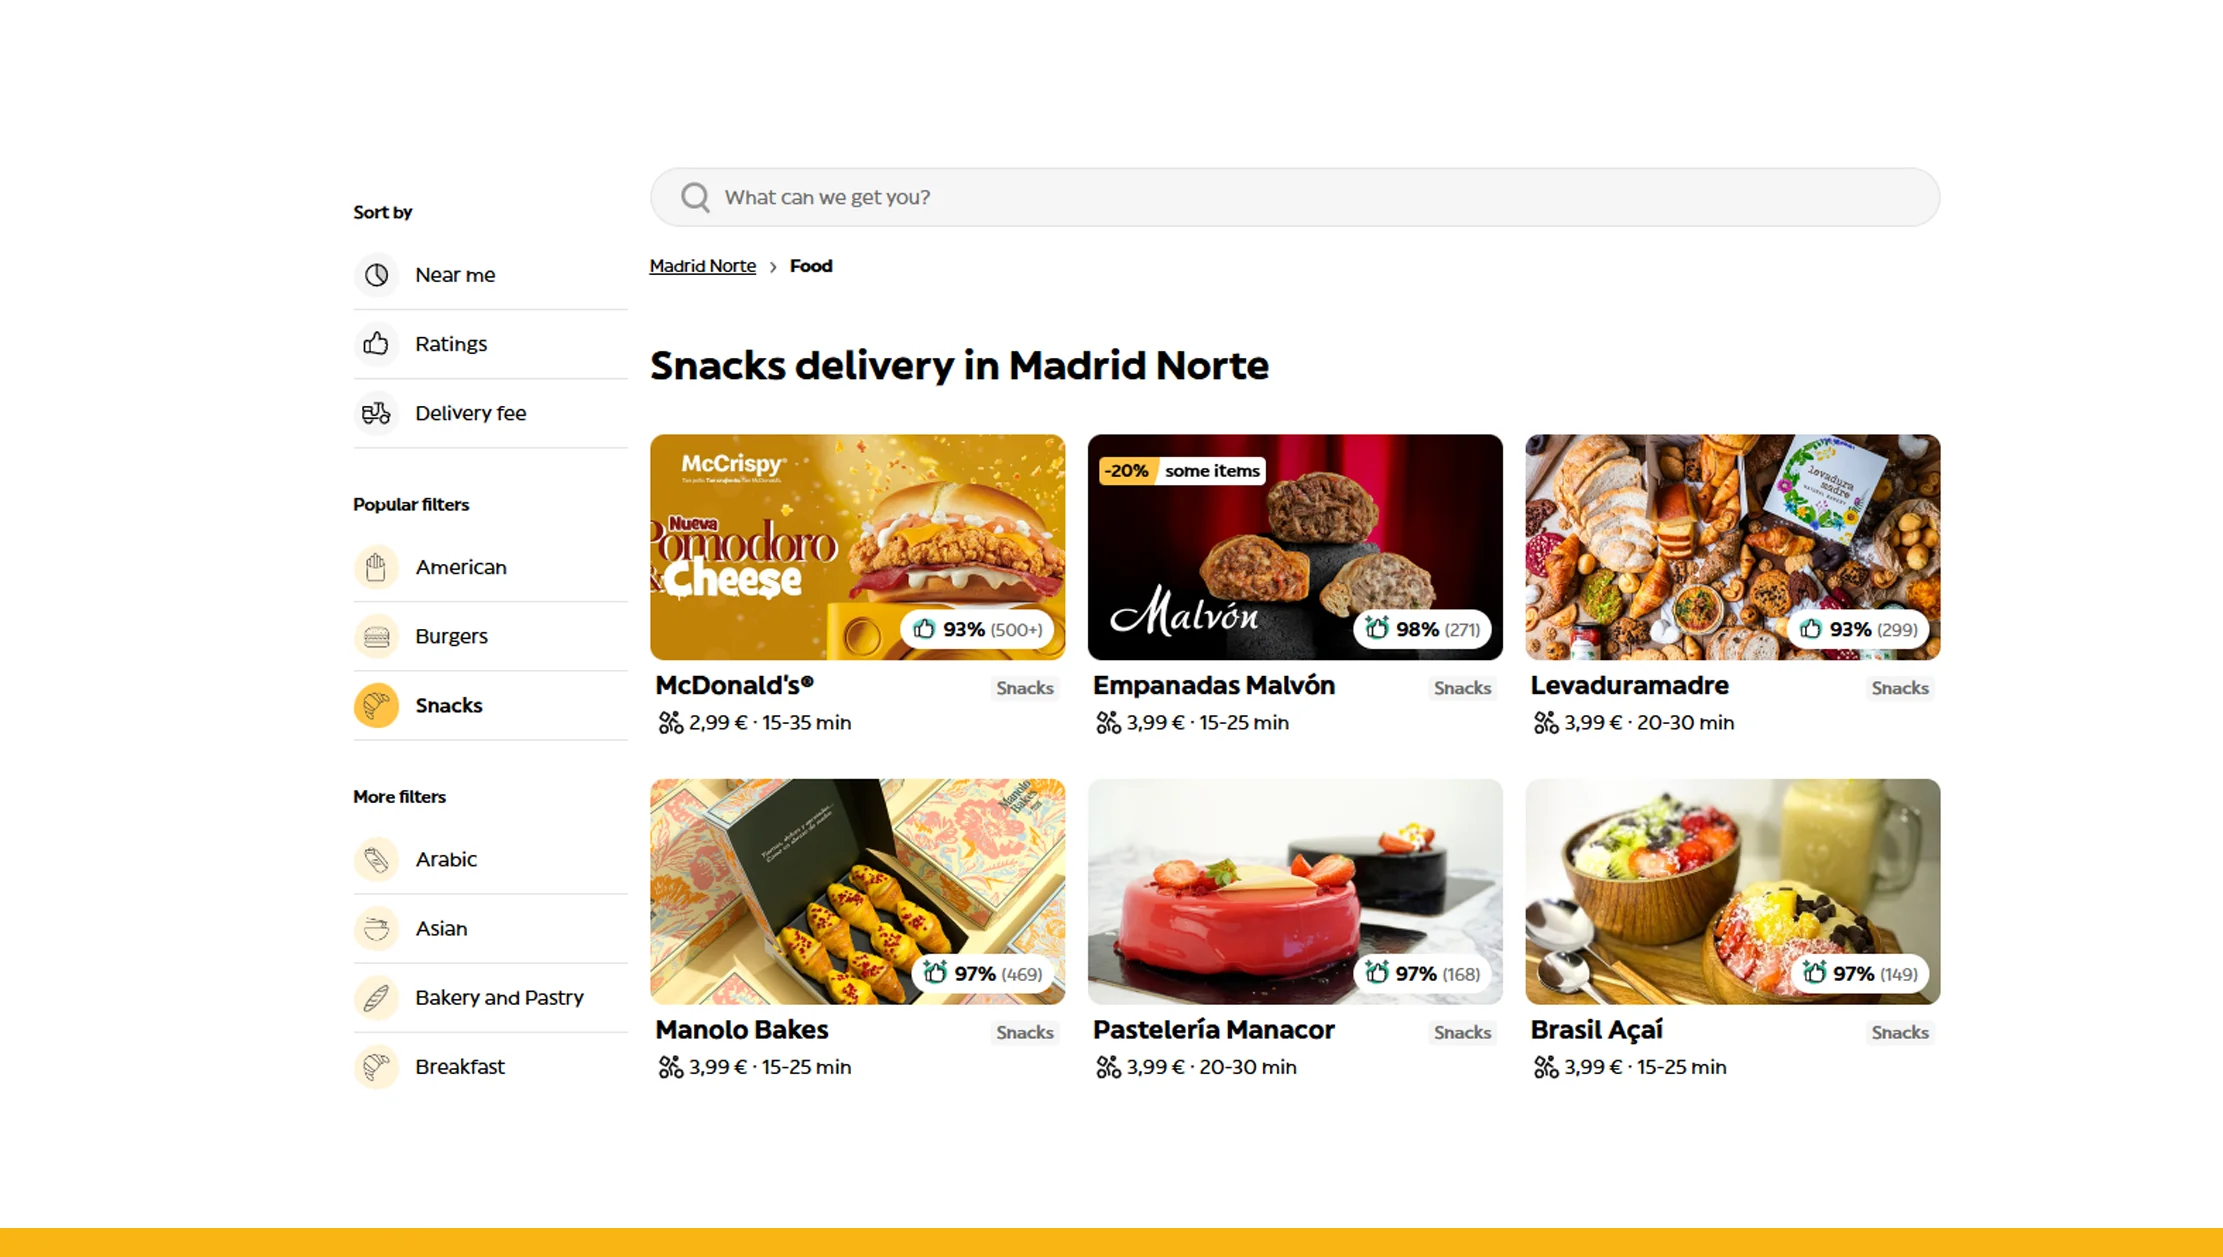
In 2025, the food delivery ecosystem continues to evolve rapidly, driven by consumer expectations, competitive pricing, and digital convenience. Glovo, one of the leading delivery platforms in Europe and beyond, remains at the forefront of this transformation. Businesses looking to stay ahead of customer expectations and market trends must tap into real-time data from platforms like Glovo. The ability to Scrape Glovo Food Delivery App Data is becoming a critical asset for companies seeking to understand user behavior and gain a competitive edge in the delivery economy.
By leveraging technologies that enable Data Scraping Glovo App, businesses can go beyond surface-level metrics. They can track customer preferences, delivery frequency, favorite cuisines, peak ordering times, and regional variations. These insights are essential for brands looking to refine their product offerings, adjust pricing, or improve logistics. In this data-driven era, customer decisions are shaped by a multitude of dynamic factors, and only businesses with access to live insights can react in time.
Understanding User Behavior in the Delivery Economy
The modern food delivery customer is more unpredictable and dynamic than ever before. User behavior shifts rapidly—driven by seasonal trends, regional preferences, promotional campaigns, and app feature updates. As consumer expectations evolve, platforms must anticipate their needs in real-time. This is where scraping data from food delivery apps like Glovo becomes vital. It allows businesses to dive into granular data like user engagement patterns, favorite cuisines, order frequency, and delivery timing preferences.
When you Scrape Glovo Food Delivery App Data, the data reveals not just what users buy, but how and why they do it. By examining metrics such as most-clicked restaurants, cart abandonment rates, average order value, and promo code usage, businesses can design highly targeted strategies. The combination of this behavioral intelligence and real-time data leads to smarter marketing decisions, optimized pricing models, and greater operational efficiency.
Below are key user behavior trends from 2020 to 2025 that highlight the growing importance of behavior-focused data scraping:
Glovo - Average Order Frequency Per User (Global)
| Year | Avg. Orders/User/Month |
|---|---|
| 2020 | 2.1 |
| 2021 | 2.8 |
| 2022 | 3.3 |
| 2023 | 3.9 |
| 2024 | 4.1 |
| 2025 | 4.5 (Projected) |
Source: Statista, Glovo Internal Reports
Top 5 Categories by Order Volume (%) – Glovo App
| Year | Fast Food | Groceries | Health & Beauty | Alcohol | Electronics |
|---|---|---|---|---|---|
| 2020 | 62% | 18% | 8% | 9% | 3% |
| 2023 | 51% | 27% | 10% | 8% | 4% |
| 2025 | 45% | 32% | 11% | 7% | 5% |
Source: Glovo Market Share Reports, 2020–2025
Cart Abandonment Rate – Glovo Users (%)
| Year | Abandonment Rate |
|---|---|
| 2020 | 35% |
| 2021 | 32% |
| 2022 | 28% |
| 2023 | 24% |
| 2024 | 22% |
| 2025 | 20% (Projected) |
Source: Global E-Commerce UX Report
Time of Day with Peak Orders – Global Glovo Users
| Year | Lunch Hours (12–2 PM) | Evening (6–9 PM) |
|---|---|---|
| 2020 | 38% | 52% |
| 2023 | 33% | 58% |
| 2025 | 30% | 61% |
Source: Glovo App Analytics Dashboard
Impact of Discounts on Order Volume
| Year | Avg. Order Uplift During Promos (%) |
|---|---|
| 2020 | 18% |
| 2022 | 22% |
| 2024 | 25% |
Source: Glovo Campaign Performance Reports
These numbers confirm the increasing reliance on Scrape Glovo Food Delivery App Data for strategic decisions. As we move further into 2025, data extraction will continue to be the foundation for predicting and responding to user needs in the delivery economy.
Power of Real-Time Glovo App Data Extraction
Real-Time Behavioral Insights
Brands that act on fresh insights outperform those relying on outdated trends. When you Scrape Glovo Food Delivery App Data continuously, you can spot changes in order volume, menu preferences, and coupon usage instantly. This agility supports better inventory planning and targeted messaging.
Change in Popular Dishes by Region (2020–2025) – Madrid
| Year | Top Trending Dish | % of Total Orders |
|---|---|---|
| 2020 | Chicken Burger | 21% |
| 2022 | Sushi Platter | 27% |
| 2025 | Vegan Burrito | 33% (Projected) |
Source: Glovo Regional Ordering Trends Report
Holiday and Seasonal Trends
Using Data extract from Glovo App, businesses track how order values, timing, and categories shift across festivals and holidays. This empowers brands to launch timely offers, scale staff, or manage delivery logistics accordingly.
Average Cart Size on Holidays vs. Regular Days (Spain)
| Year | Regular Day | Holiday Season |
|---|---|---|
| 2020 | €17.80 | €23.50 |
| 2023 | €20.60 | €28.90 |
| 2025 | €22.40 | €31.70 |
Source: Glovo Spain Sales Report
Location-Based Menu Optimization
Through data scraping of the Glovo app, platforms identify which dishes perform well in specific zip codes. This supports smarter onboarding of local vendors and personalized marketing for users in those zones.
Weekend Order Spike (Madrid Zones 1–3)
| Year | Zone 1 | Zone 2 | Zone 3 |
|---|---|---|---|
| 2020 | 18% | 12% | 9% |
| 2023 | 22% | 15% | 12% |
| 2025 | 26% | 18% | 16% |
Source: Glovo Urban Delivery Heatmap
Competitive Pricing Analysis
Brands that Scrape Glovo Food Delivery App Data with price tracking features can benchmark against competitors in real time. This ensures deals are compelling yet profitable.
Price Sensitivity by User Type (Spain, 2025)
| User Segment | Avg. Price Tolerance (%) |
|---|---|
| Students | ±5% |
| Working Adults | ±10% |
| Families | ±8% |
Source: Glovo User Behavior Analytics, 2025
Why Choose Real Data API?
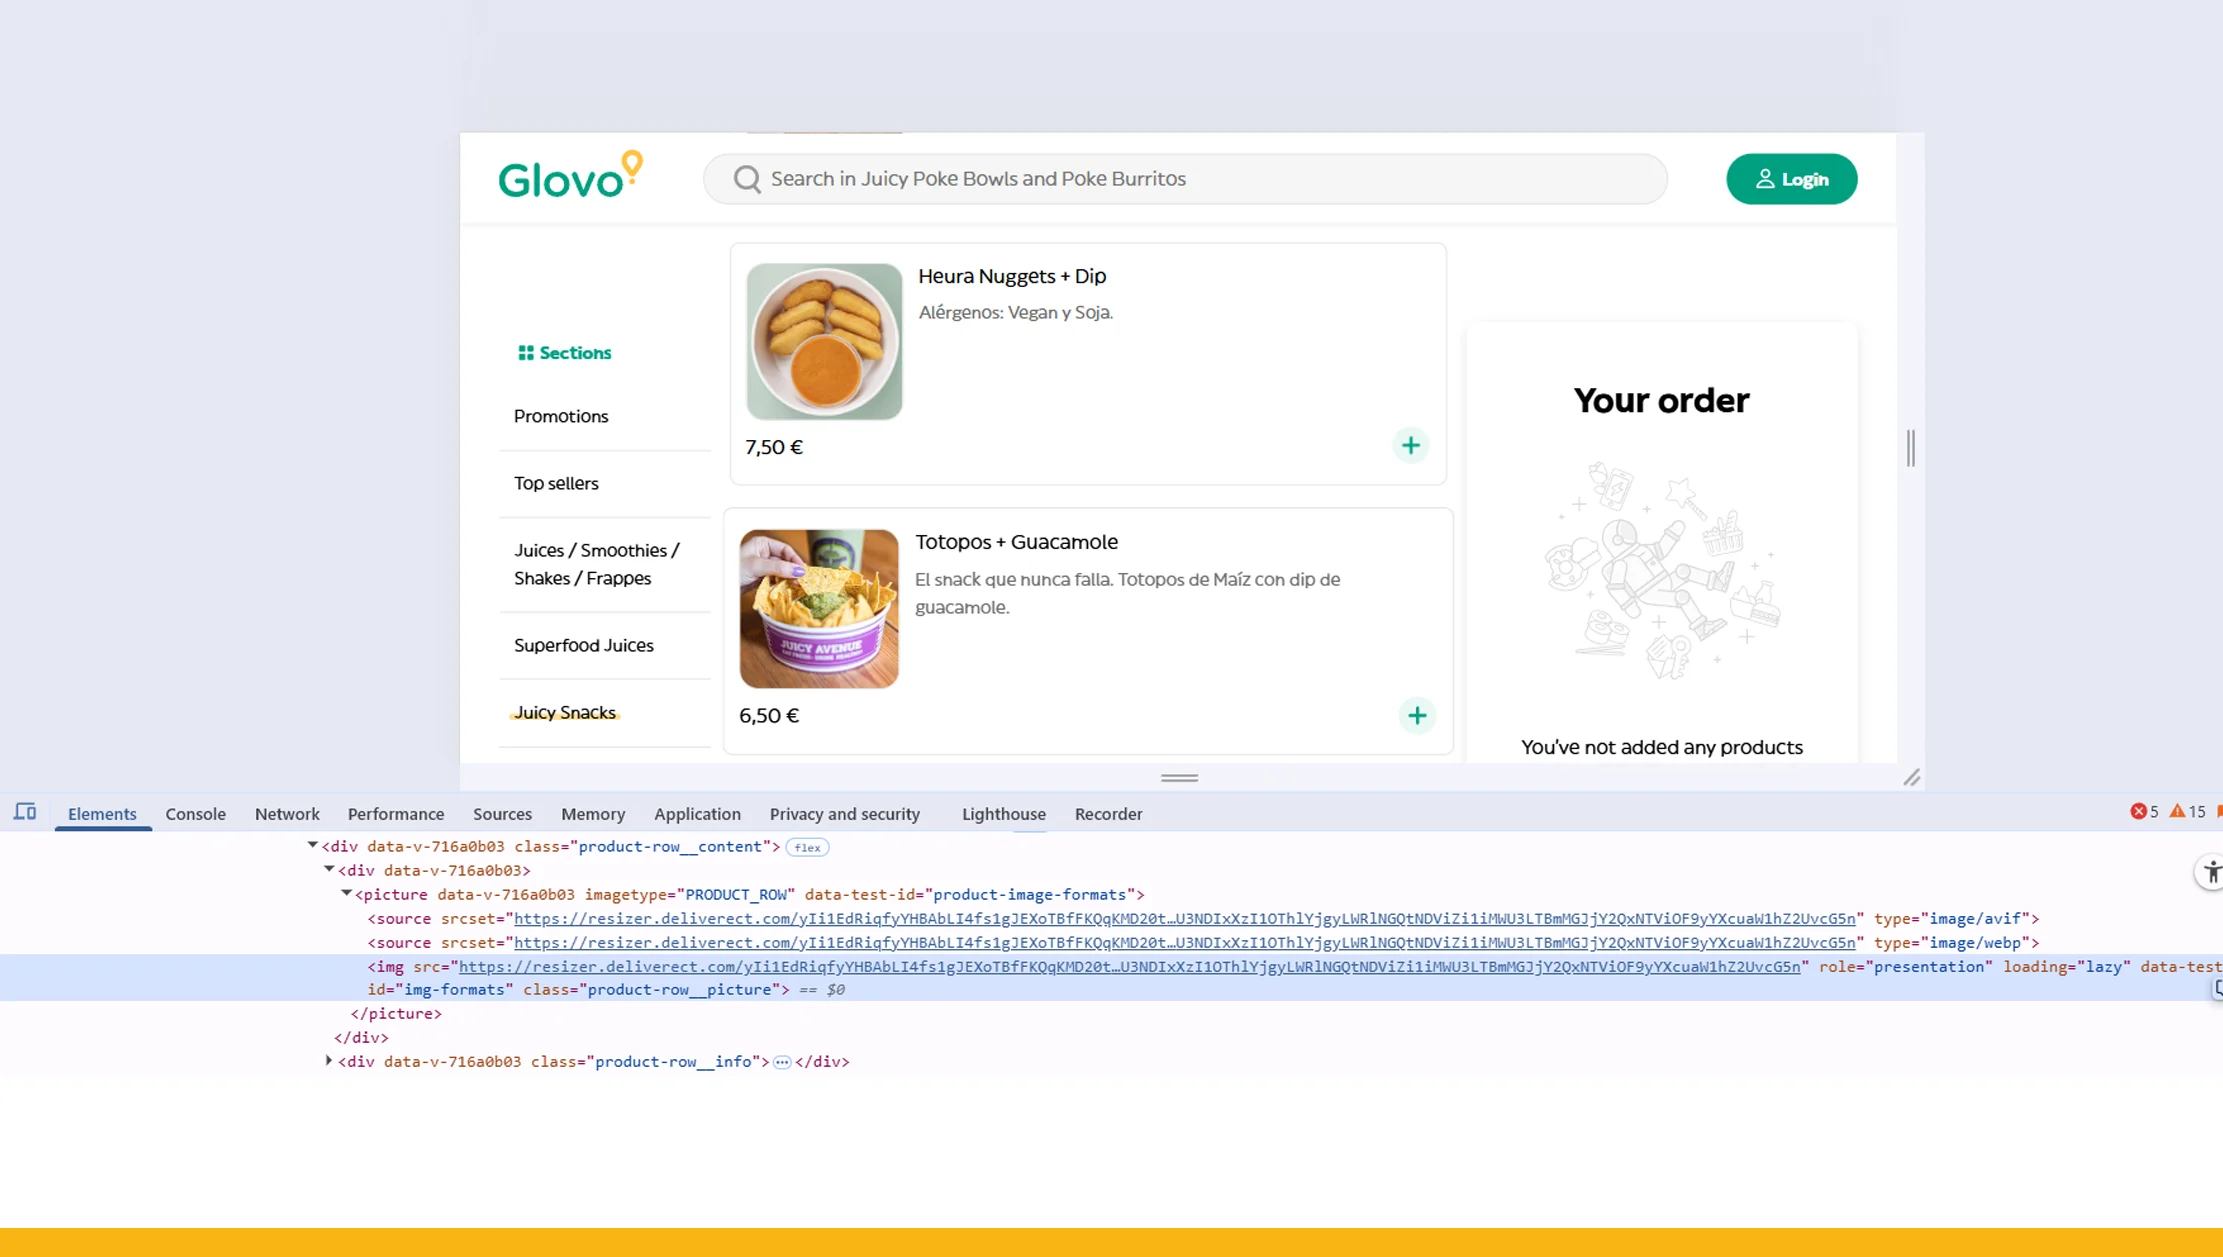
At Real Data API, we offer tailor-made, scalable scraping solutions that help you unlock the full potential of Glovo and other delivery platforms. Our tools are designed to scrape Glovo Food Delivery App Data securely, efficiently, and in compliance with best practices. Whether you need detailed delivery pricing, user interaction data, or behavioral analytics, our APIs and scraping tools are engineered for performance and accuracy.
We specialize in scraping data from food delivery apps with a focus on scalability, real-time updates, and structured output formats. From extracting menu variations to monitoring in-app promotions and customer reviews, we ensure that every layer of user behavior data is accessible and actionable. We also assist clients with long-term data storage and integration with analytics dashboards for deeper insights.
Conclusion
To succeed in the fast-paced world of on-demand services, it’s no longer enough to guess what users want—you must know. With the ability to Scrape Glovo Food Delivery App Data, businesses can adapt to user trends, enhance the customer experience, and fine-tune pricing strategies based on live behavioral insights.
Start turning data into decisions. Contact Real Data API today for robust, reliable Glovo app data extraction solutions that empower your business.
Latest posts

Why Brands Use Competitive Data Intelligence to Increase Market Share in Highly Competitive Markets?

How To Scrape Competitor Data To Support Market Entry Strategy And Expansion Planning For Data-Driven Business Growth?

How Hotel Occupancy Intelligence Through Public Data Sources Is Reshaping Revenue Management

The ZIP Code Advantage: How Hyper-Local Amazon Product Data Collection Is Redefining Retail Intelligence
Real Data API stands out as one of the premier global companies specializing in web data Scraping and web extraction.


Rating 4.7
Rating 4.7
Rating 4.5
Rating 4.7
Rating 4.7


Disclaimer : RealData API functions solely as an independent data infrastructure and technology solutions provider. We build customized automation workflows designed to collect publicly accessible web data based exclusively on client instructions. RealData API neither owns proprietary datasets nor engages in the sale or redistribution of extracted information. Our operations are limited strictly to lawful public web data processing and never involve unauthorized access to restricted systems or private networks. Any company names, trademarks, logos, or brand references displayed on this website are used purely for demonstrative and illustrative purposes to showcase our technical capabilities and do not imply endorsement, partnership, or affiliation. Use of our platform and services remains subject to our Terms of Service.