
Introduction
Understanding what people want to eat—and where—is no longer guesswork. In today’s data-driven food landscape, knowing regional preferences can make or break restaurant strategies, menu launches, and marketing efforts. That’s where the Cuisine Popularity Mapping API comes into play.
This powerful tool allows restaurants, food delivery platforms, and market researchers to unlock hyperlocal food preferences and adapt offerings in real time. Instead of relying on broad demographic assumptions, businesses can now pinpoint trending cuisines in specific cities, neighborhoods, or even delivery zones.
As the food delivery market continues to grow (with users projected to surpass 2.8 billion globally by 2025), having location-based menu intelligence is essential. Customers expect personalized recommendations, while businesses need actionable insights to meet demand and stay ahead of competitors.
In this blog, we’ll explore how the Cuisine Popularity Mapping API helps you understand regional taste patterns, optimize menus, and run localized campaigns that deliver higher engagement and ROI.
Challenge: Guesswork in Regional Menu Planning

Historically, menu planning was based on assumptions, slow surveys, or outdated POS reports. In a competitive food delivery market, that’s a recipe for lost sales. With evolving regional palates, businesses must track localized preferences in real time.
From 2020 to 2025, consumer preference for hyperlocal and ethnic cuisines has grown by 87%. In the same period, over 62% of new restaurant listings on major delivery apps like Uber Eats and DoorDash included region-specific items.
| Year | % Regional Items in Top Menus | Growth in Cuisine Diversity |
|---|---|---|
| 2020 | 28% | — |
| 2021 | 34% | +21% |
| 2022 | 41% | +32% |
| 2023 | 49% | +46% |
| 2024 | 55% | +60% |
| 2025 | 61% (est.) | +87% |
Using the Cuisine Popularity Mapping API, restaurant chains and aggregators can replace outdated guessing with real-time data. By analyzing consumer ordering behavior across ZIP codes and metro zones, the API identifies trending dishes and fast-growing cuisines—helping teams adapt menus with precision.
Solution: Geo-Based Food Trend Scraping for Real-Time Intelligence
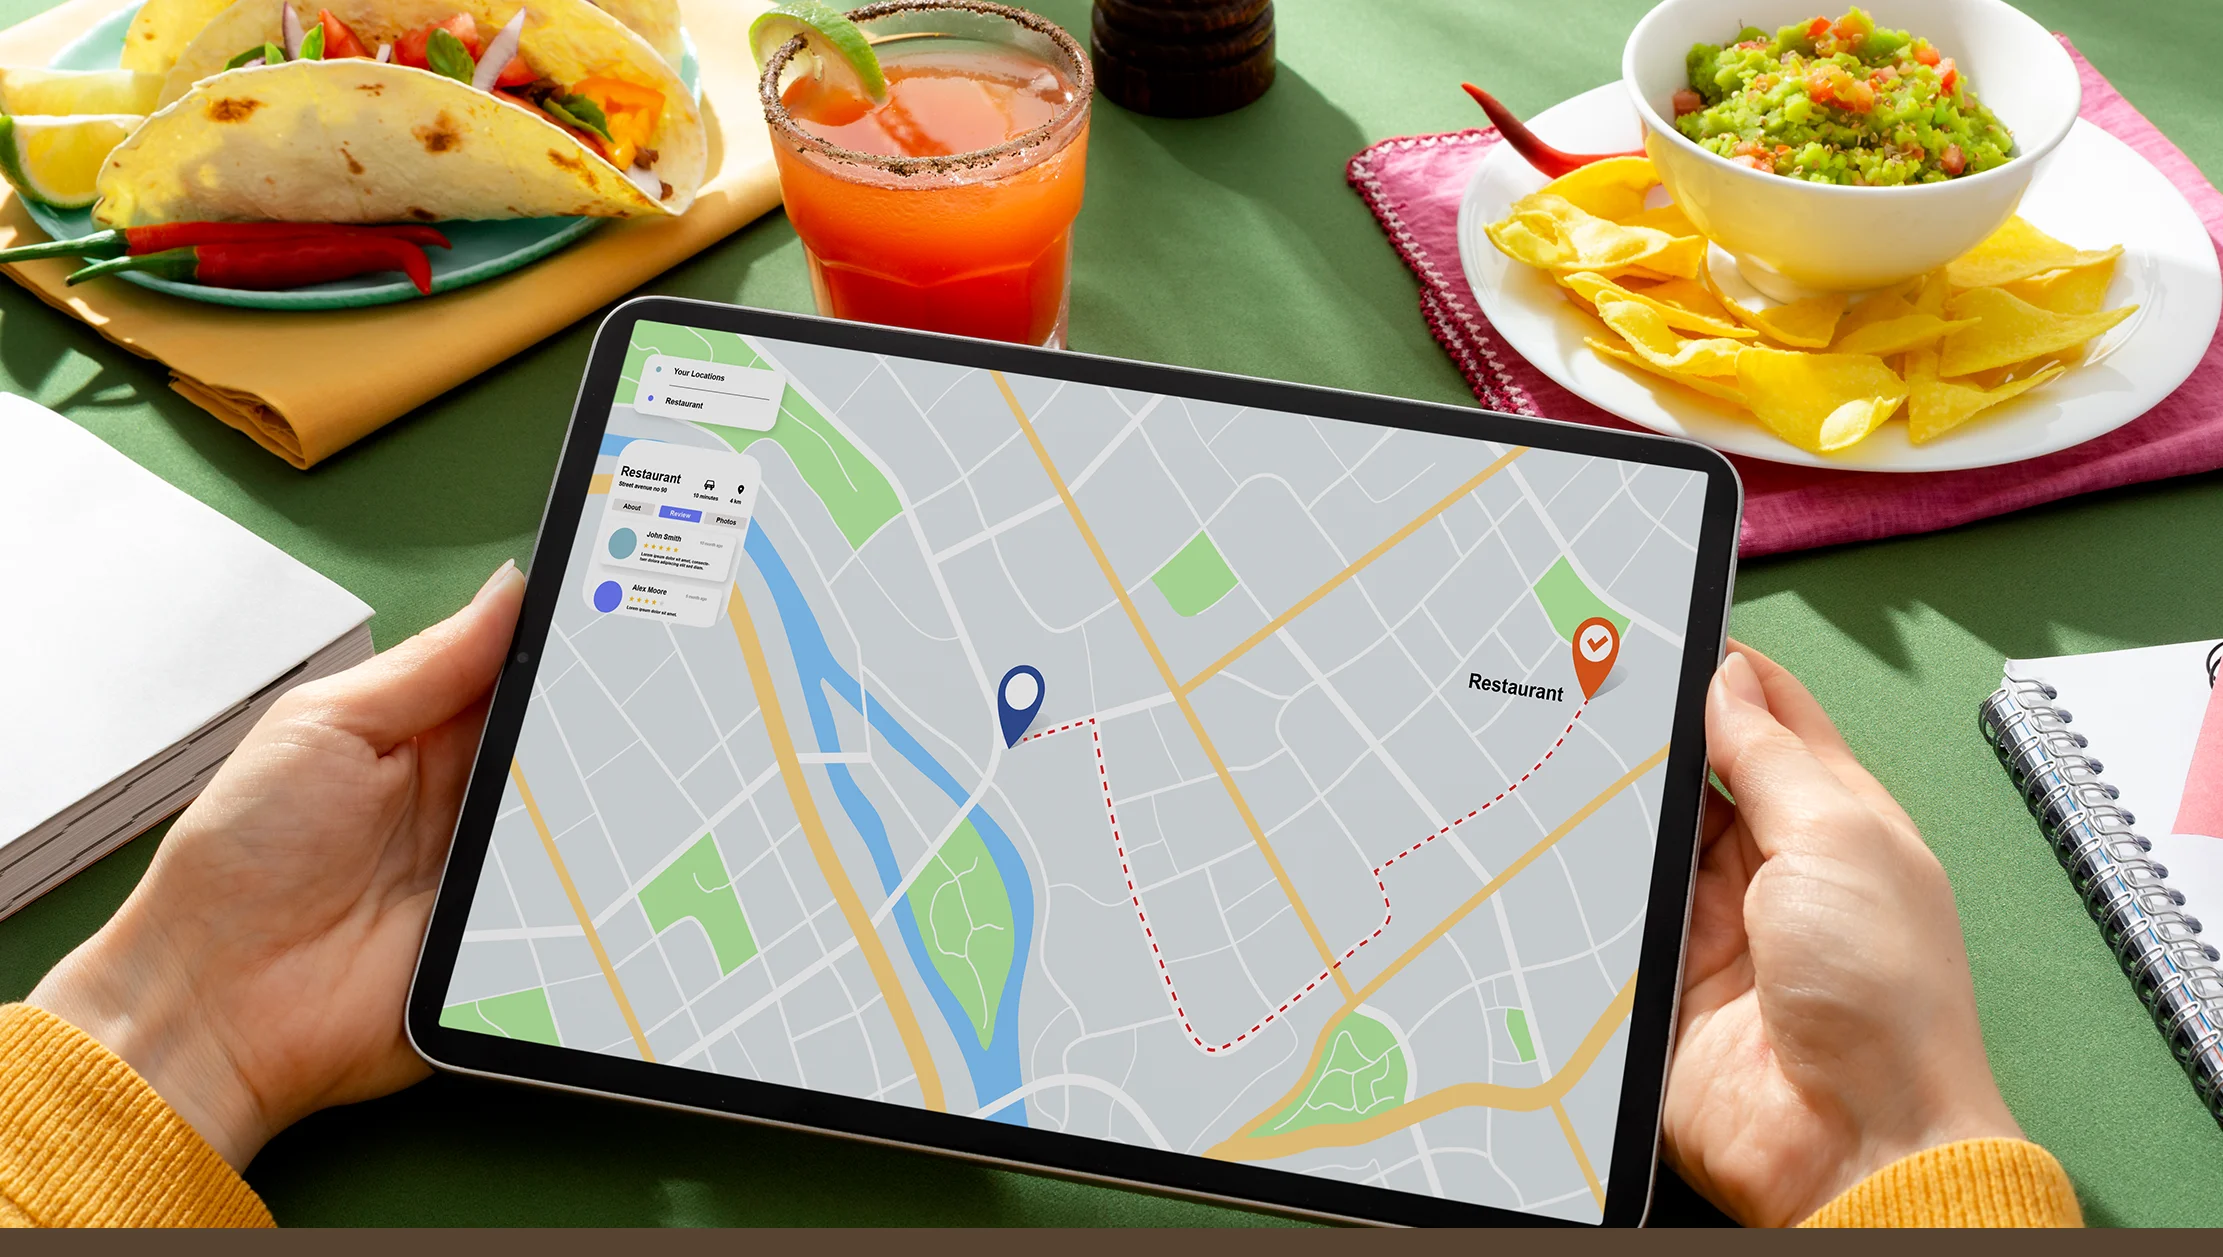
Geo-Based Food Trend Scraping enables businesses to track what’s trending in different locations instantly. From biryani in Bengaluru to ramen in Berlin, user preferences change fast—and manual research can’t keep up.
Real Data API’s infrastructure collects and aggregates data from major food delivery apps, scanning menus, order volumes, ratings, and reviews. This gives clients access to actionable intelligence sorted by geography.
Example insights you can uncover:
- What cuisines are growing fastest in Tier-2 cities?
- Which dishes are gaining popularity in university zones?
- How seasonal changes affect ordering patterns?
A quick case study:
A national QSR chain used this scraping technology and discovered that Thai cuisine grew by 51% in midwestern US states between 2021 and 2023. As a result, they localized menu items across 47 locations and saw a 23% increase in order value within three months.
Geo-trend scraping transforms static food data into dynamic business intelligence, helping brands stay relevant in every zip code they serve.
Stay ahead of evolving tastes—use Geo-Based Food Trend Scraping to deliver real-time menu insights that drive smarter, localized decisions.
Get Insights Now!Scrape Cuisine Data by Location to Uncover Demand Patterns
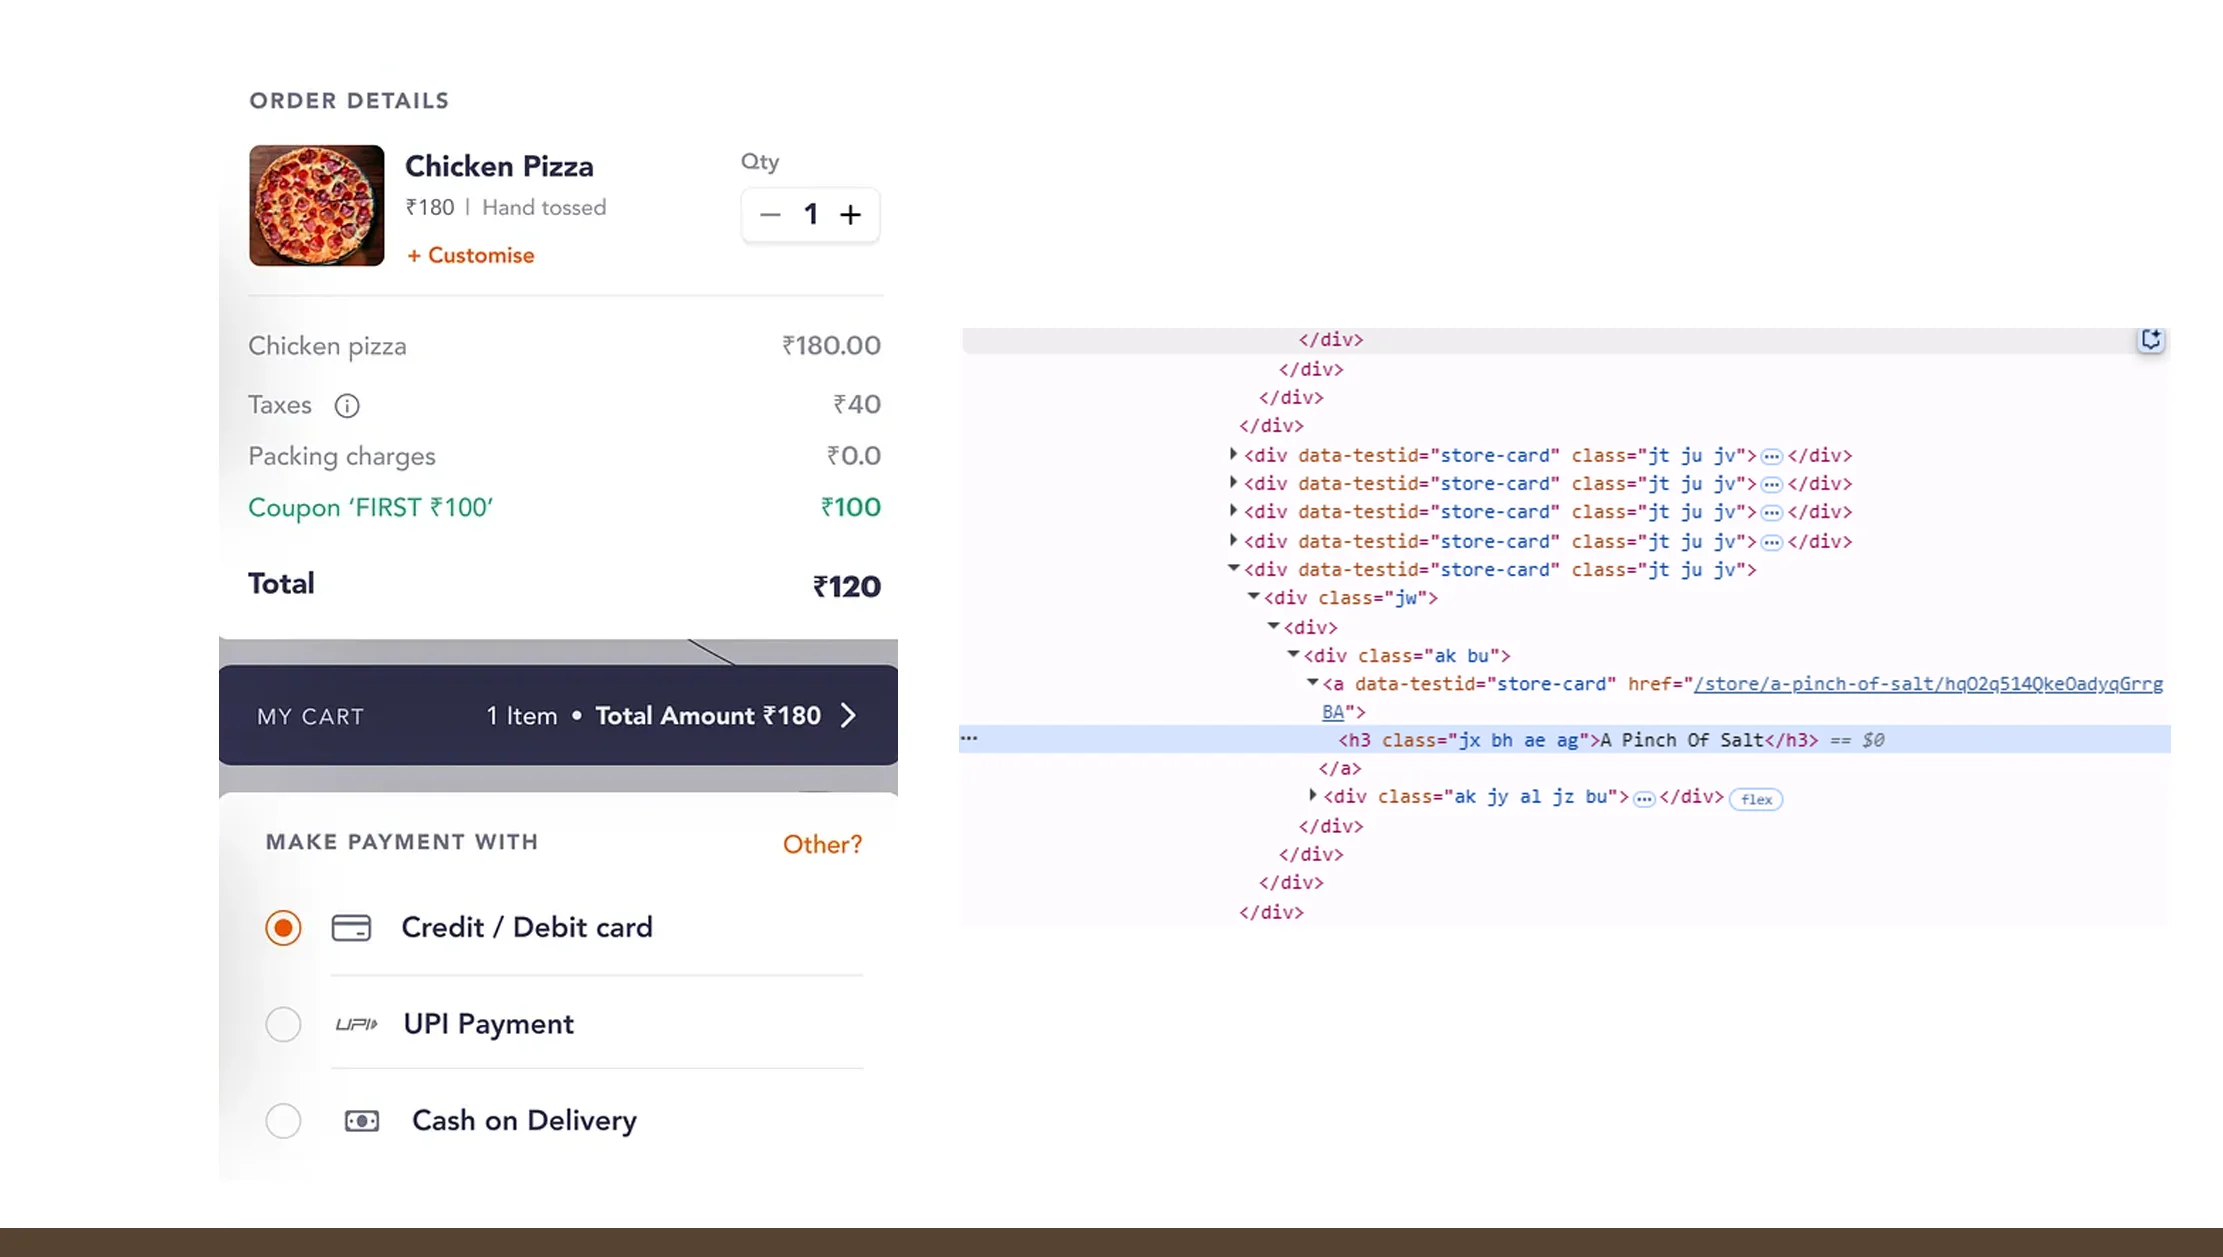
With the ability to Scrape Cuisine Data by Location, businesses can unlock deep local insights at city, district, or neighborhood levels. Understanding what sells in Brooklyn vs. Bronx or Mumbai vs. Pune helps businesses refine offerings where it matters most.
Here’s what you can analyze:
- Most ordered cuisines per location
- Cuisine-based price sensitivity
- Combo trends tied to regional flavors
| Location | Top Cuisine 2020 | Top Cuisine 2025 (Est.) | YoY Growth |
|---|---|---|---|
| Austin, TX | Mexican | Korean | +78% |
| London, UK | Indian | Mediterranean | +52% |
| Delhi, India | North Indian | Asian Fusion | +60% |
| Sydney, AU | Chinese | Japanese | +41% |
This location-based scraping also benefits new restaurant launches and ghost kitchens looking to enter the market with pre-validated cuisine ideas. By tailoring your offerings to actual demand patterns, you reduce launch risks and improve customer satisfaction from day one.
Real Data API’s geolocation tagging makes it easy to build hyper-personalized experiences and recommendation engines for food apps, increasing relevance and click-through rates.
Strategic Advantage: Food App API for Regional Cuisine Insights
Food delivery platforms thrive on personalization—and nothing drives engagement better than showing customers exactly what they crave. A Food App API for Regional Cuisine Insights integrates directly with apps to power smarter recommendations and search results.
Let’s say a user in Chicago logs into your app. Based on current location and recent order trends, the API automatically suggests trending cuisines like Ethiopian or Vegan Asian Fusion—both up by over 38% in 2024.
Business Benefits:
- Boost conversion by up to 29% with regionally adapted UI
- Improve delivery success with trend-aligned promotions
- Lower churn by offering what customers want before they ask
The API can be layered into internal dashboards for category managers or connected to frontend UX for consumers—driving growth on both ends. Whether it’s smart filtering, automated tagging, or trend-based campaigns, regional data is key to food app success.
Competitive Benchmarking: Popular Cuisines by Region API Scraping
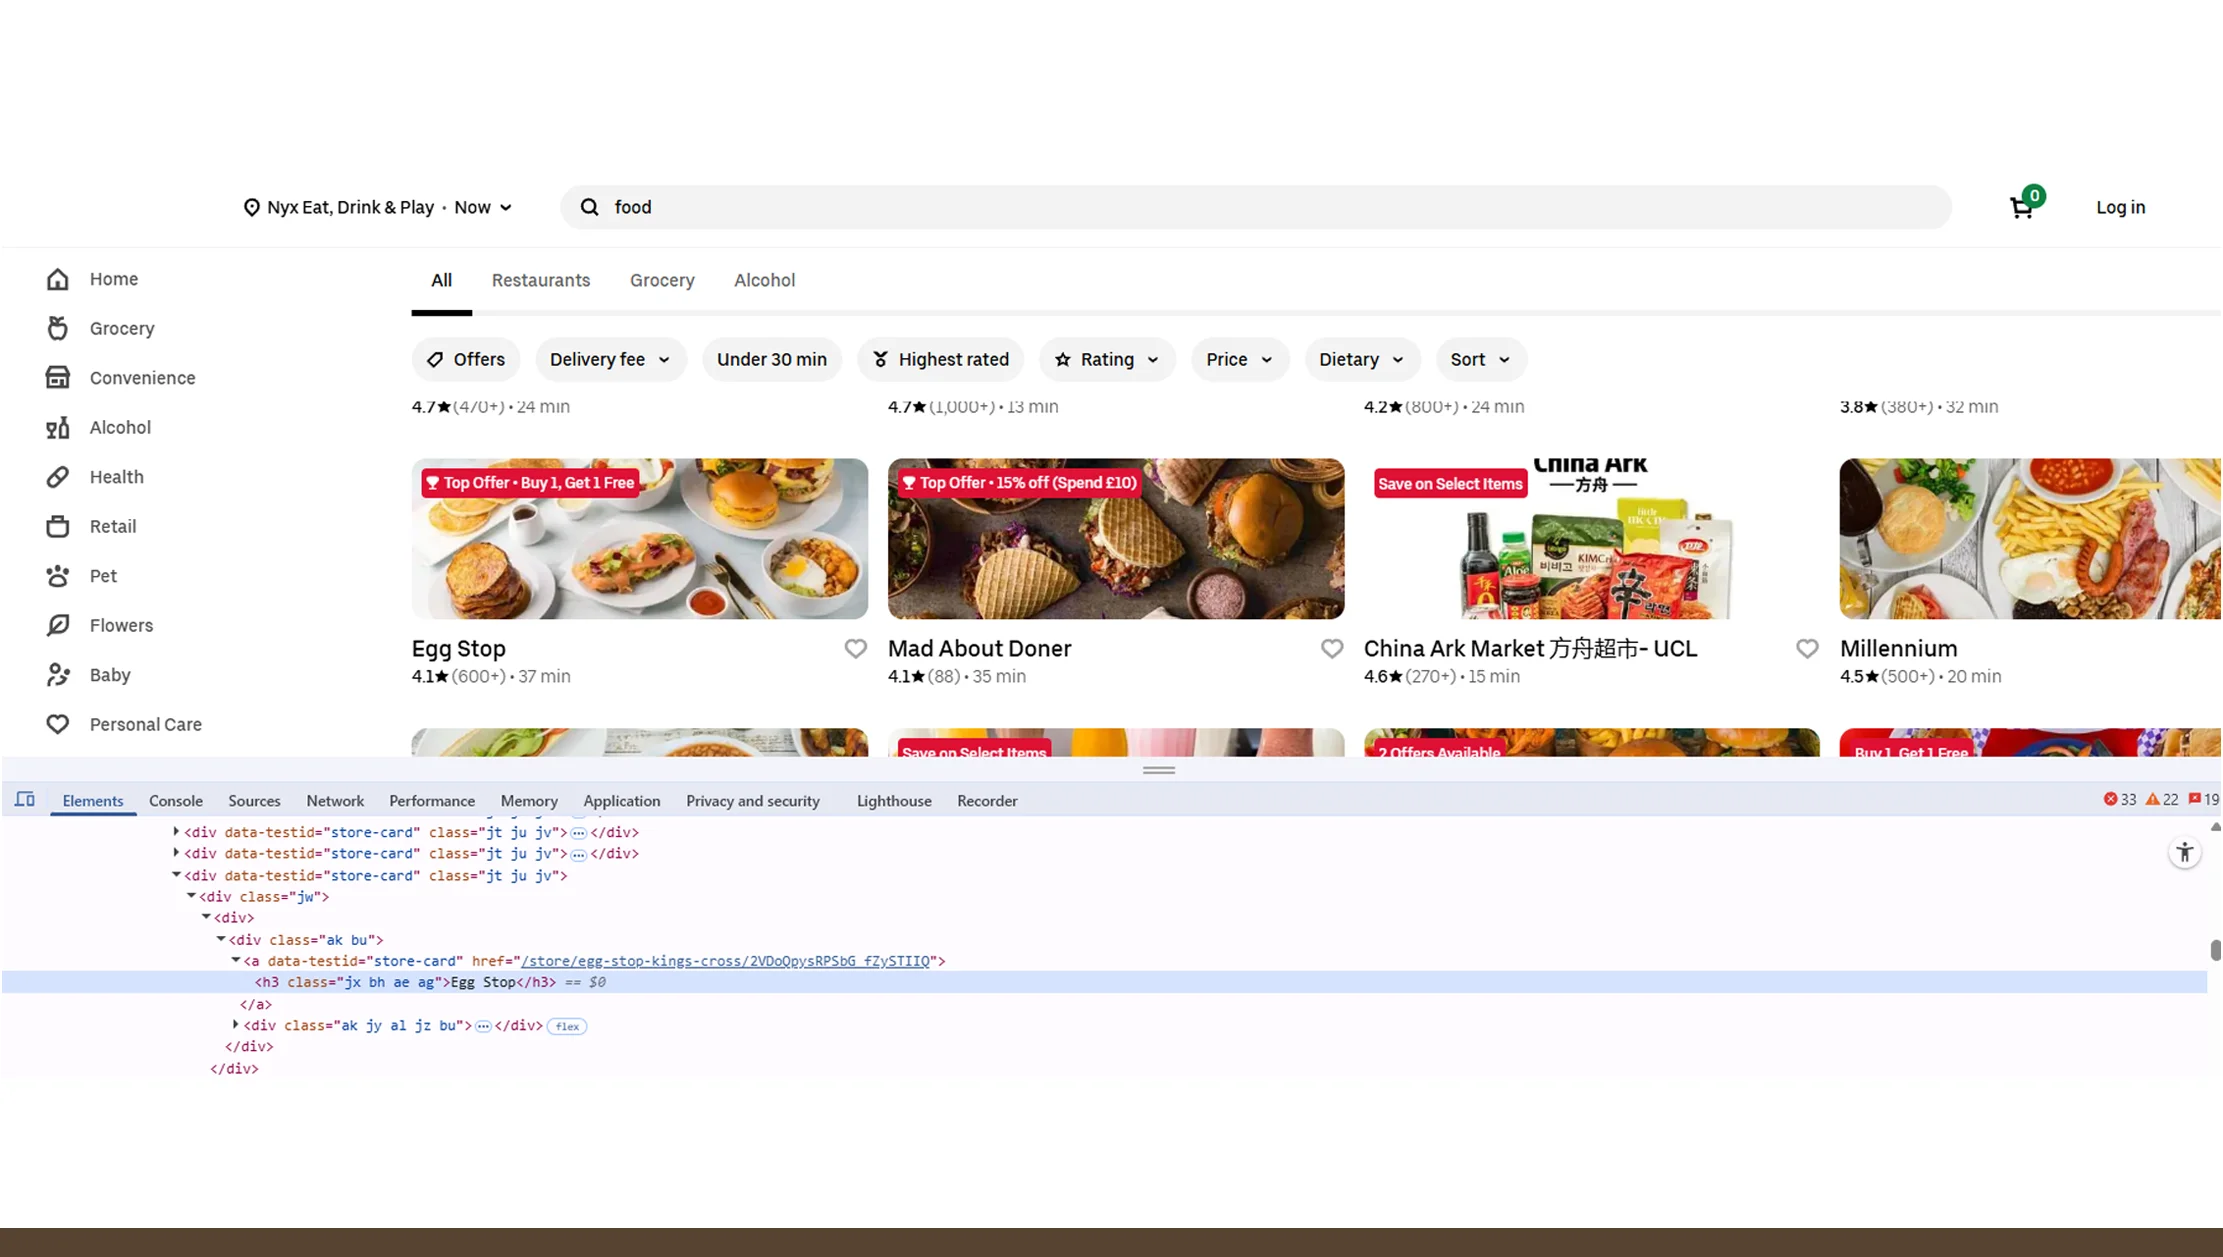
Understanding your own data is great—but knowing what’s working for competitors? That’s gold.
Popular Cuisines by Region API Scraping allows businesses to benchmark against top competitors across different regions. The API pulls publicly available data on menus, popularity rankings, and promotions across aggregator platforms—offering insight into what's trending elsewhere.
Key Use Cases:
- See which cuisines competitors are adding or removing
- Identify menu gaps in your category or zone
- Spot regional pricing trends and bundle strategies
Case in point:
In 2022, a US-based food chain used this tool to monitor competitor menus in the Pacific Northwest. After spotting a spike in Hawaiian Poke offerings, they introduced a similar item and saw a 19% increase in regional orders.
Using this API scraping technique can fuel new item launches, market entry strategies, and A/B test setups that align with real-time competitor actions.
Gain a competitive edge—use Popular Cuisines by Region API Scraping to benchmark trends and optimize your regional menu strategy.
Get Insights Now!Visualize Taste Patterns: Geo-Cuisine Analysis from Food Delivery APIs
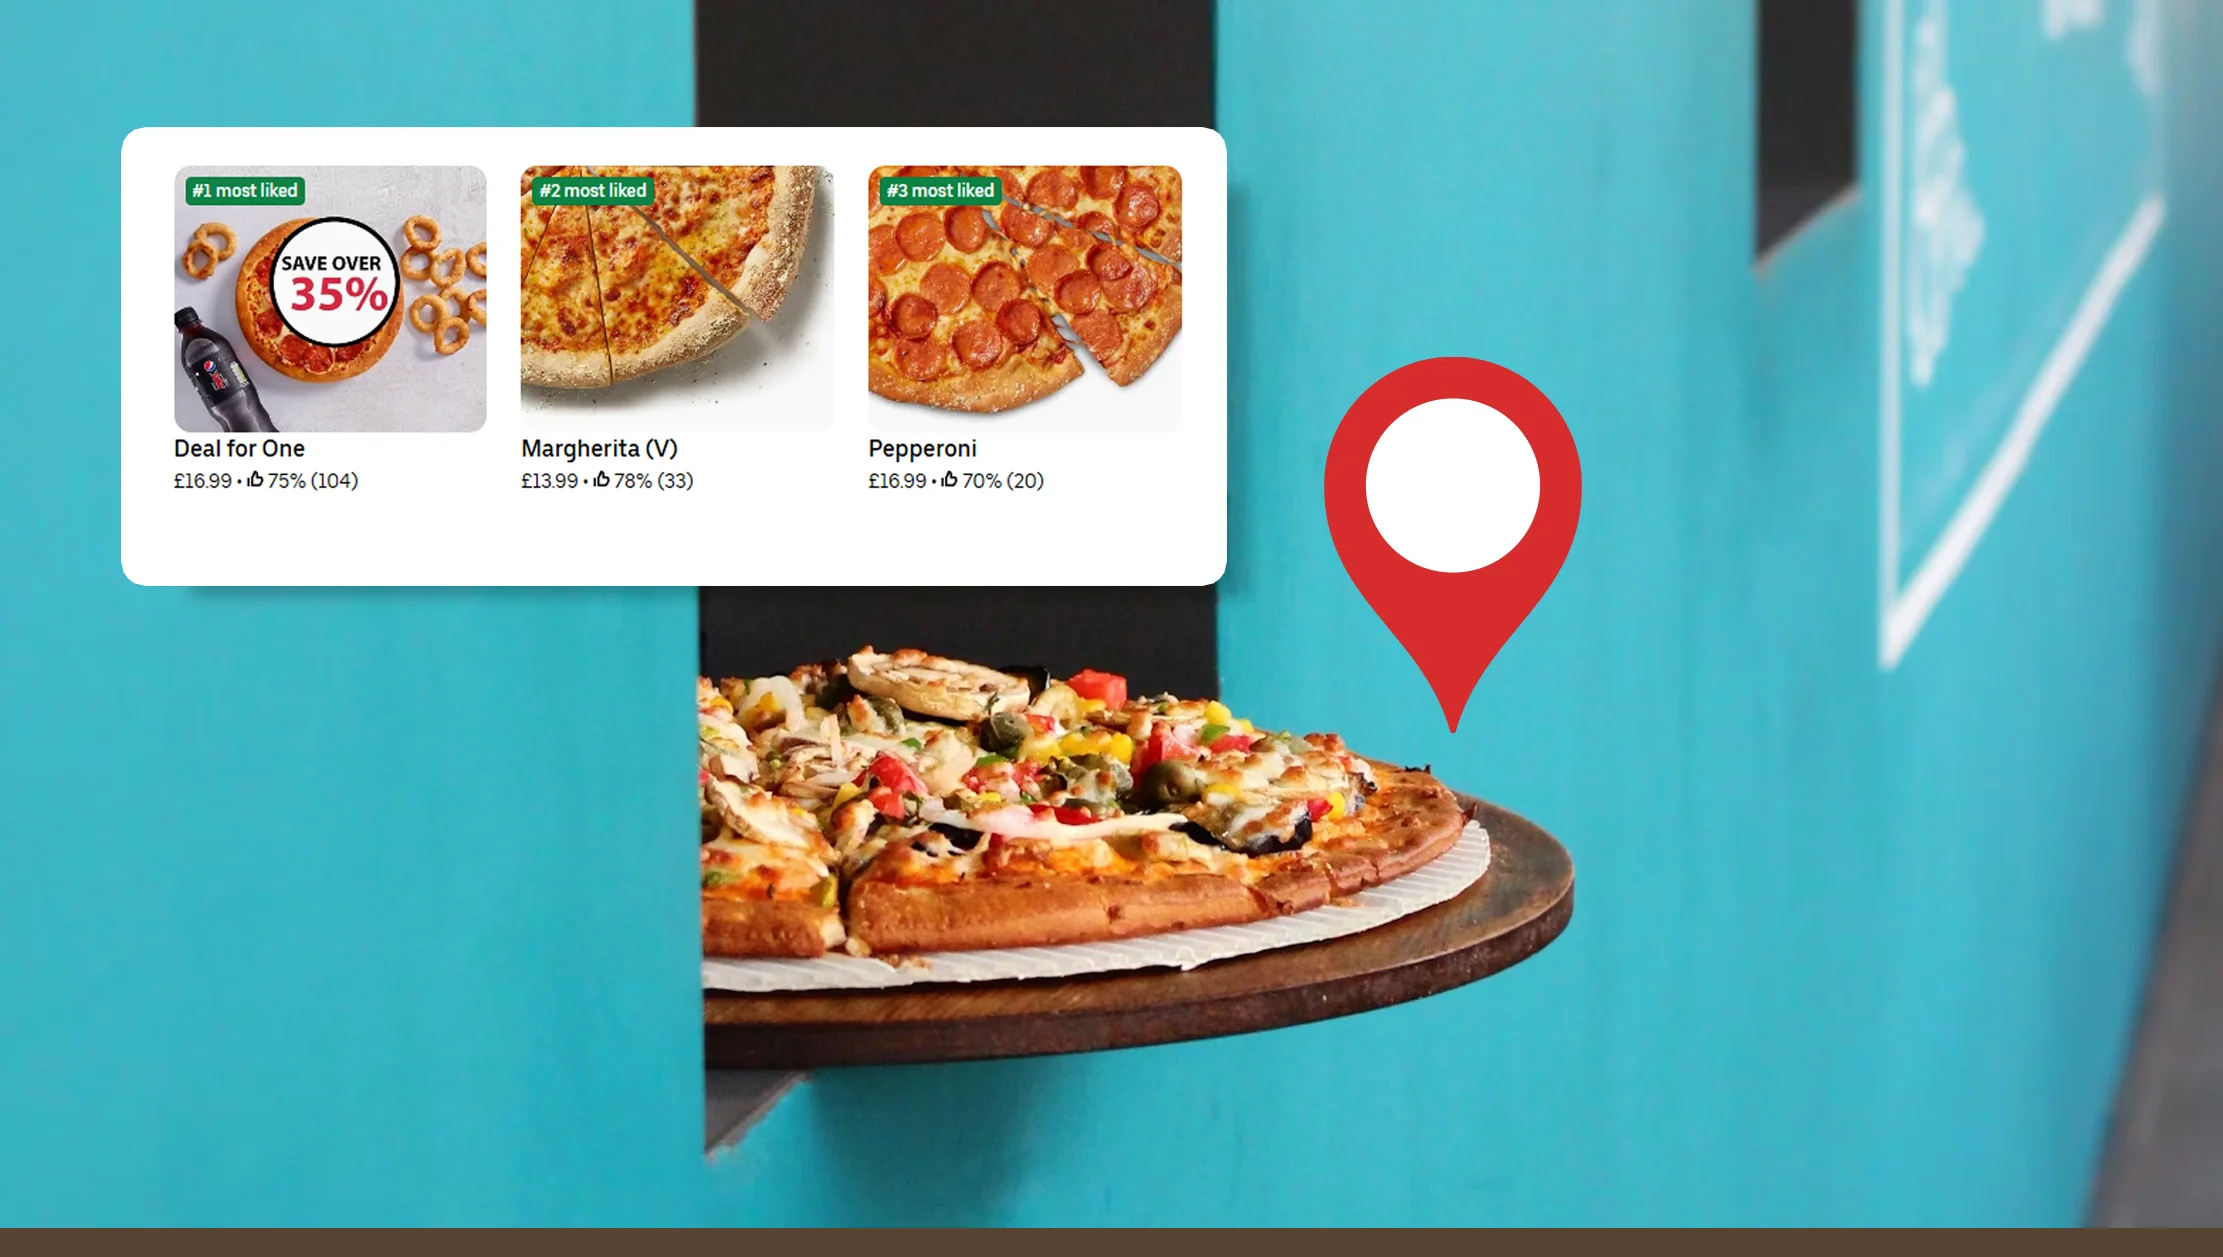
Data is only powerful when it’s visualized. With Geo-Cuisine Analysis from Food Delivery APIs, businesses can map cuisine trends spatially—using heatmaps, charts, and timelines.
These insights answer questions like:
- Which zones are saturated with similar offerings?
- Where are emerging cuisines gaining traction?
- How does seasonality impact local orders?
| Month | City | Fastest Growing Cuisine | Change in Volume |
|---|---|---|---|
| Jan 2023 | Mumbai | Korean BBQ | +22% |
| Mar 2023 | Chicago | Vegan Comfort Food | +17% |
| July 2024 | Berlin | Lebanese | +33% |
| Oct 2024 | Singapore | Thai Street Food | +26% |
Delivery platforms and restaurant brands can use this data to plan offers, optimize marketing schedules, and enter high-potential regions with confidence.
Real Data API supports customizable visualization dashboards, giving teams instant access to interactive trend maps for pitch decks, strategic planning, and localized ad targeting.
Why Choose Real Data API?
Real Data API is designed for the modern food economy—scalable, fast, and highly localized. Whether you’re a delivery platform, restaurant brand, or data science team, our tools offer unmatched insight into what consumers crave, when, and where.
The Cuisine Popularity Mapping API stands out for its precision, speed, and customizability. Unlike generic scraping tools, it’s built for geo-tagged food intelligence. From trend forecasting to hyperlocal targeting, it gives you the data backbone needed to grow in a dynamic market.
We also offer plug-and-play integration, detailed documentation, and dedicated onboarding for every client. Whether you need daily tracking or deep monthly analytics, Real Data API adapts to your needs and scales with your growth.
Choose Real Data API to power smarter menus, data-led expansions, and AI-driven food recommendations that work. Because in a competitive food tech world, data isn’t optional—it’s essential.
Conclusion
Consumer tastes are changing—and they’re changing fast. To succeed in today’s dynamic food delivery market, brands need more than intuition. They need real-time, region-specific insights to design smarter menus, launch relevant promotions, and deliver what customers truly want.
By leveraging the Cuisine Popularity Mapping API, your business can tap into hyperlocal food trends, spot emerging cuisines, and build deeper connections with your audience. From trend tracking to strategic expansion, our tools offer a roadmap to smarter, data-driven decisions.
No more guesswork. No more outdated reports. Just clear, actionable insights powered by cutting-edge geo-intelligence from Real Data API.
Ready to unlock your region’s taste trends? Request your free demo of the Real-Time Food Trend Mapping API today and start mapping what the world wants to eat!


