
Introduction
Olive Garden has remained a staple in the American casual dining landscape, known for its Italian-American cuisine and family-style service. As the post-pandemic restaurant sector stabilizes, Olive Garden has taken a strategic approach to expansion, balancing physical footprint with digital innovation. This Real Data API research report uses comprehensive Olive Garden Locations Data USA to analyze growth patterns, closures, and realignment of store locations across the U.S. from 2020 to 2025.
With access to real-time data scraping, location intelligence, and structured datasets, this report reveals where Olive Garden is thriving, where it’s consolidating, and how brands can benefit from insights derived through web data extraction techniques.
Understanding the Olive Garden Landscape

Before diving into the numbers, it’s important to understand the factors influencing Olive Garden’s strategic decisions:
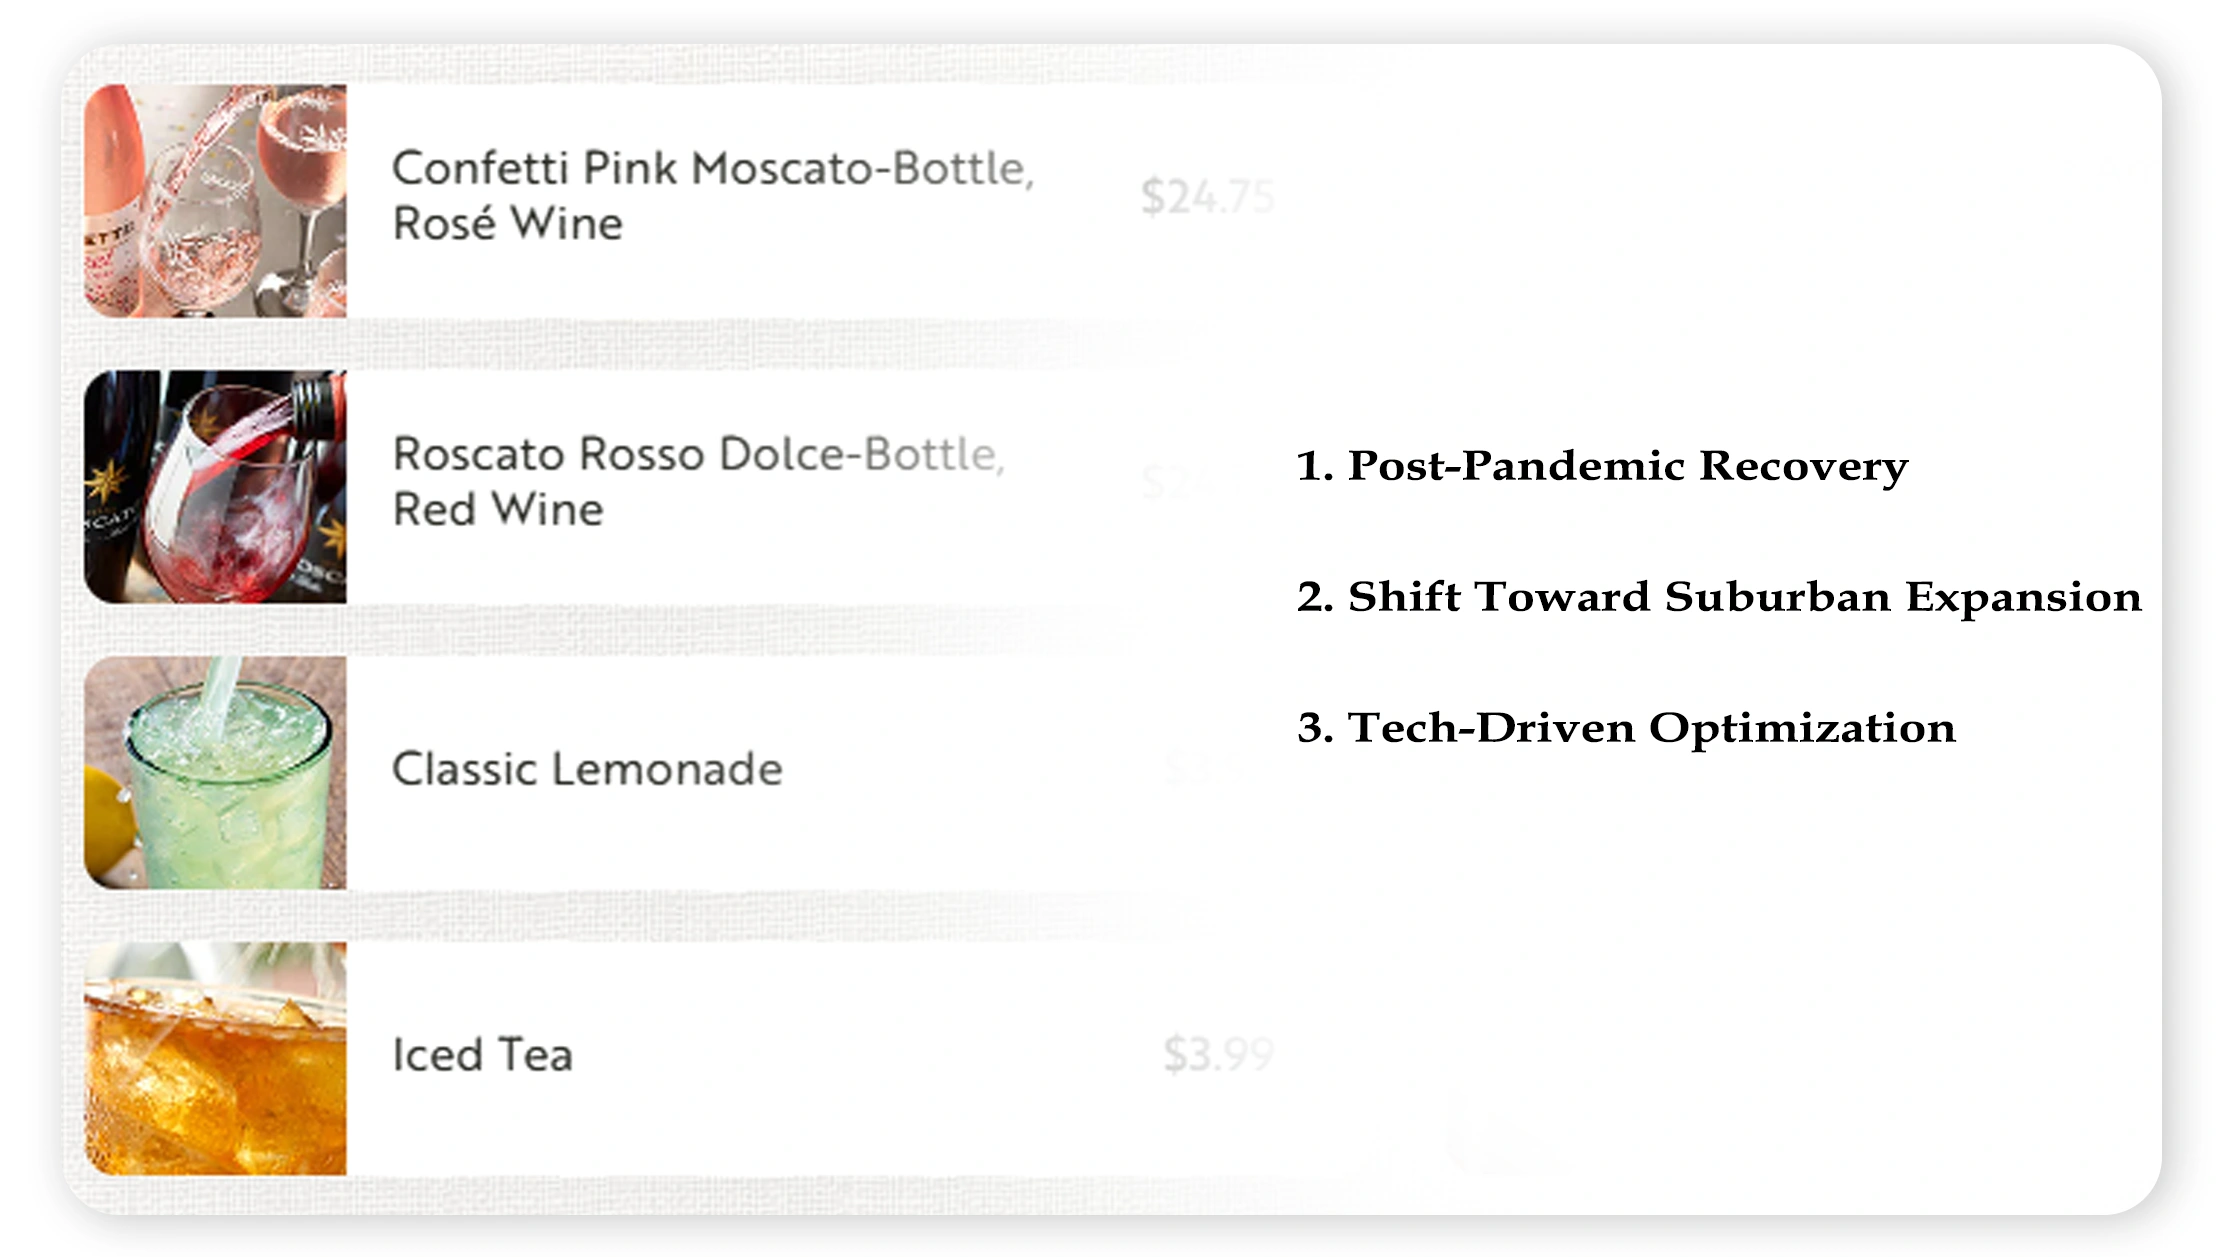
1. Post-Pandemic Recovery
While fast-casual chains pivoted quickly to delivery, full-service restaurants like Olive Garden faced challenges during COVID-19. However, with a loyal customer base and effective operational adjustments, Olive Garden rebounded better than many competitors.
2. Shift Toward Suburban Expansion
Instead of urban saturation, Olive Garden has focused on expanding in second-tier cities and suburban markets where real estate is more affordable and demand is stable. Our Olive Garden Locations Data USA reveals a clear geographic shift post-2022.
3. Tech-Driven Optimization
With investment in digital ordering and delivery partnerships, Olive Garden has minimized the need for additional dine-in capacity, making Location Data more critical for optimizing ROI per outlet rather than increasing volume.
Table 1: Olive Garden Store Count – 2020 to 2025
| Year | Total U.S. Locations | New Openings | Closures | Net Change |
|---|---|---|---|---|
| 2020 | 875 | 10 | 20 | -10 |
| 2021 | 865 | 12 | 8 | +4 |
| 2022 | 869 | 15 | 11 | +4 |
| 2023 | 879 | 18 | 8 | +10 |
| 2024 | 892 | 20 | 7 | +13 |
| 2025 | 910 (est.) | 22 | 4 | +18 |
Analysis
From 2020 to 2025, Olive Garden has maintained a modest but consistent growth rate, with a net increase of 35 stores over five years. This slow yet stable growth reflects a deliberate expansion strategy, using Olive Garden Locations Data USA to prioritize markets with strong dine-in demand and sustainable operating conditions.
Table 2: Regional Distribution of Olive Garden Locations (2025)
| Region | No. of Stores | % of Total Locations | Leading States |
|---|---|---|---|
| South | 330 | 36.3% | Florida, Texas, Georgia |
| Midwest | 215 | 23.6% | Ohio, Illinois, Michigan |
| West | 180 | 19.7% | California, Arizona |
| Northeast | 125 | 13.7% | New York, Pennsylvania |
| Southeast | 60 | 6.6% | North Carolina, Alabama |
Analysis
The South and Midwest dominate Olive Garden’s footprint. States like Florida and Texas host dense clusters of stores, which align with high population growth and affordability. Using tools to scrape Olive Garden Locations Data USA, brands can identify location gaps and regional over/under-penetration for competitive benchmarking.
Table 3: Store Format and Seating Capacity Trends
| Year | Avg. Sq Ft per Store | Avg. Seating Capacity | New Format Adoption (%) |
|---|---|---|---|
| 2020 | 7,500 | 260 | 5% |
| 2021 | 7,200 | 250 | 12% |
| 2022 | 7,100 | 240 | 18% |
| 2023 | 6,800 | 220 | 25% |
| 2024 | 6,600 | 210 | 30% |
| 2025 | 6,500 (est.) | 200 (est.) | 35% |
Analysis
Olive Garden is transitioning to smaller store formats with lower overhead and higher delivery readiness. This shift is powered by Olive Garden Store Data Extraction insights, allowing data-backed optimization of restaurant layout and format. Location selection now depends on delivery potential as much as dine-in appeal.
Table 4: Digital Ordering & Delivery Enablement
| Year | % Locations with Delivery | % Locations with Online Ordering | App Downloads (in Millions) |
|---|---|---|---|
| 2020 | 45% | 60% | 1.2 |
| 2021 | 58% | 72% | 2.0 |
| 2022 | 67% | 80% | 2.8 |
| 2023 | 75% | 85% | 3.5 |
| 2024 | 82% | 89% | 4.1 |
| 2025 | 88% (est.) | 92% (est.) | 4.7 (est.) |
Analysis
Digital integration is critical to Olive Garden’s success. More than 88% of locations will be delivery-enabled in 2025. By using tools to Scrape Olive Garden restaurant locations data in the USA, brands and analysts can compare performance across digitally enabled zones vs traditional dine-in clusters.
Table 5: Competitor Comparison – Average Location Count per Chain (2025)
| Chain Name | Location Count | Avg. Revenue/Store ($M) | Growth Strategy |
|---|---|---|---|
| Olive Garden | 910 | 6.04 | Suburban expansion |
| Applebee’s | 1,585 | 2.71 | Franchise consolidation |
| Red Lobster | 650 | 4.15 | Coastal optimization |
| Texas Roadhouse | 750 | 6.40 | New market penetration |
| Outback Steakhouse | 690 | 5.07 | Smaller format launches |
Analysis
While Olive Garden does not have the largest network, it boasts one of the highest revenue-per-location ratios. This validates the use of Olive Garden Locations Data USA in fine-tuning store placement for profitability rather than volume.
How Real Data API Supports Strategic Growth?

Real Data API provides businesses and researchers with access to the most reliable, real-time Olive Garden Locations Data USA, enabling:
- Identification of regional growth patterns
- Detailed competitor benchmarking
- Geolocation-based delivery market analysis
- Access to tools that scrape Olive Garden Locations Data USA with precision
- Customized dashboards for Olive Garden Store Data Extraction
With an emphasis on Location Data intelligence, Real Data API helps brands and investors assess expansion risks, location suitability, and consumer density in any ZIP code.
Conclusion
As the full-service dining landscape evolves, Olive Garden’s performance reflects a hybrid strategy—measured physical growth supported by tech-enabled customer experience. The use of Olive Garden Locations Data USA offers critical insight into how strategic location planning can balance scale and profitability.
From urban exits to suburban entries and the shrinking of store footprints, this report reveals how data-driven decisions shape long-term brand value. Businesses seeking to replicate Olive Garden’s success must leverage tools to scrape Olive Garden restaurant locations data in the USA and apply Location Data analytics to guide their physical network strategy.
Looking for Real-Time Olive Garden Data?
Real Data API provides comprehensive, regularly updated datasets for:
- Store-level analytics
- Competitor location intelligence
- Real-time scraping & geospatial overlays
Contact us today to access our Olive Garden dataset and fuel your market intelligence.


