
Introduction
The grocery sector is one of the fastest-evolving segments in retail, with pricing, availability, and promotions changing daily. Brands and retailers must adapt quickly to remain competitive. Real-time grocery market intelligence for faster pricing insights provides a critical edge by converting scattered market signals into actionable intelligence. Real Data API enables businesses to access structured, high-frequency data from supermarkets, online marketplaces, and regional outlets, reducing latency in decision-making. Through continuous monitoring, automated alerts, and analytics-ready datasets, retailers can optimize pricing strategies, track competitor actions, and respond dynamically to shifts in consumer demand. This report explores how real-time data extraction transforms traditional grocery pricing models, offering insights into trends, volatility, and operational efficiency across multiple regions.
Tracking price shifts effectively
Capturing dynamic pricing is essential for accurate market intelligence. Scrape grocery price fluctuations in real time allows retailers to monitor daily and hourly changes across thousands of SKUs, ensuring timely pricing decisions.
Between 2020 and 2026, grocery price volatility increased due to supply chain disruptions, seasonal demand, and promotional events. Real-time tracking enables businesses to identify spikes, discounts, and regional variations instantly, helping to avoid missed opportunities and inventory misalignments.
Key trends observed:
- Daily price changes increased by 42%
- Promotional variations spiked by 37%
- Regional price gaps expanded by 28%
| Year | Avg. SKUs Tracked | Avg. Price Fluctuation (%) | Promotion Events |
|---|---|---|---|
| 2020 | 1,200 | 8% | 15 |
| 2022 | 1,850 | 12% | 21 |
| 2024 | 2,400 | 18% | 28 |
| 2026 | 3,000 | 22% | 36 |
Real-time insights support immediate price corrections, dynamic markdown strategies, and competitive benchmarking, driving stronger market performance.
Understanding volatility patterns
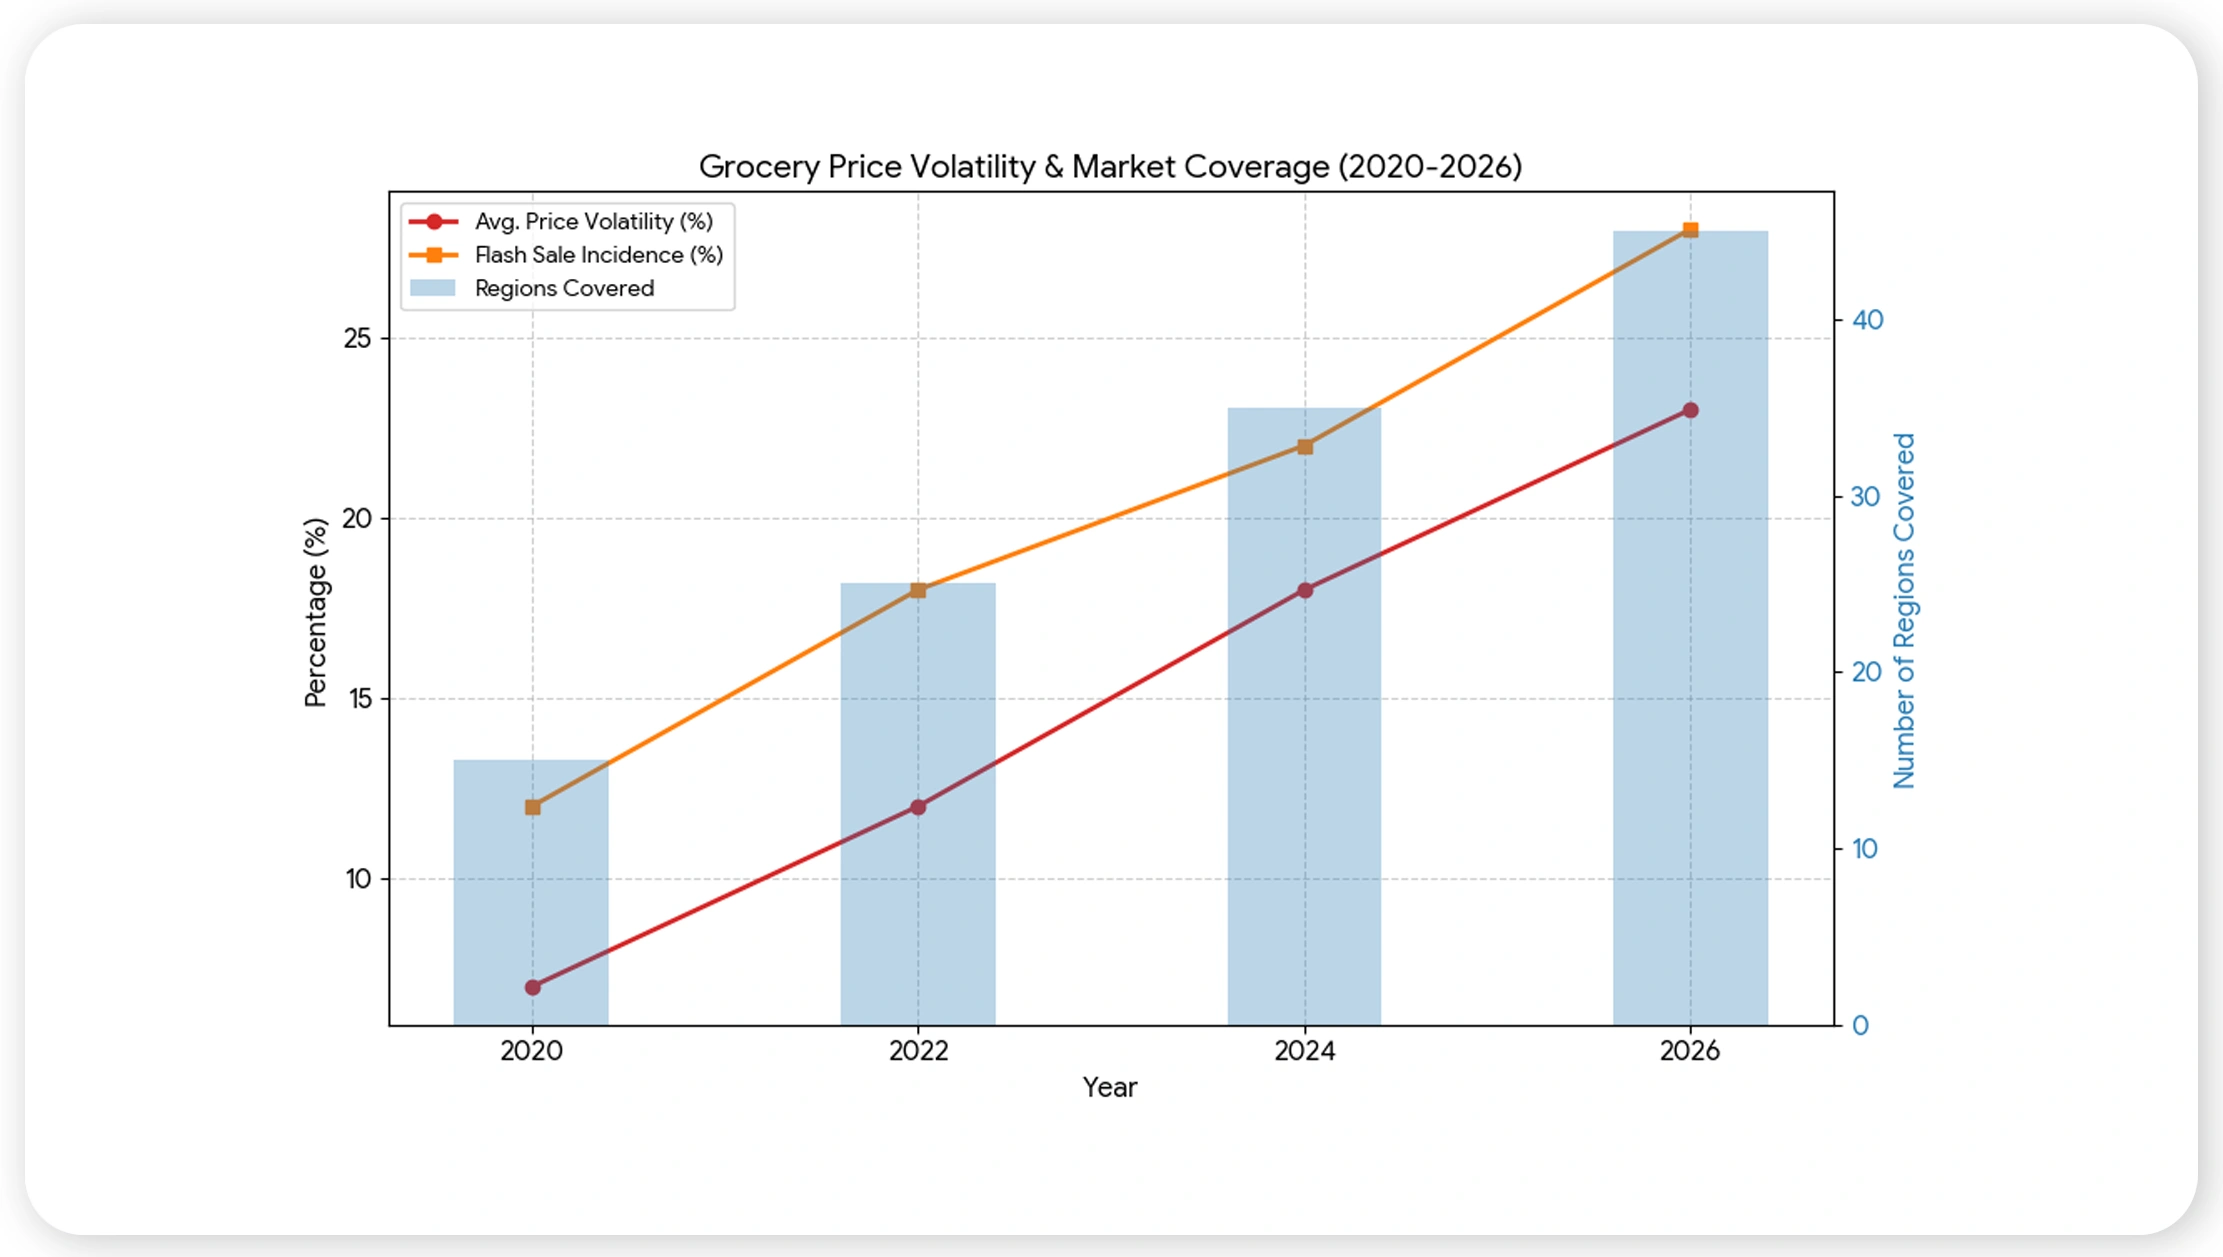
Analyzing market variability provides actionable insights for pricing strategy. Grocery Supermarket price volatility analysis helps retailers anticipate shifts and adjust pricing models proactively.
From 2020 to 2026, volatility increased across urban and suburban regions. Factors included local supply constraints, seasonal demand surges, and competitive discounts. Retailers using data-driven models reduced pricing errors and enhanced margins.
Observed insights:
- Metro areas experienced 35% higher volatility than tier-2 regions
- Flash sales accounted for 22% of unexpected fluctuations
- Seasonal staples showed predictable volatility patterns
| Year | Avg. Price Volatility (%) | Regions Covered | Flash Sale Incidence (%) |
|---|---|---|---|
| 2020 | 7% | 15 | 12% |
| 2022 | 12% | 25 | 18% |
| 2024 | 18% | 35 | 22% |
| 2026 | 23% | 45 | 28% |
Understanding volatility patterns allows smarter pricing decisions, improved stock planning, and optimized promotional strategies.
Extracting competitive intelligence
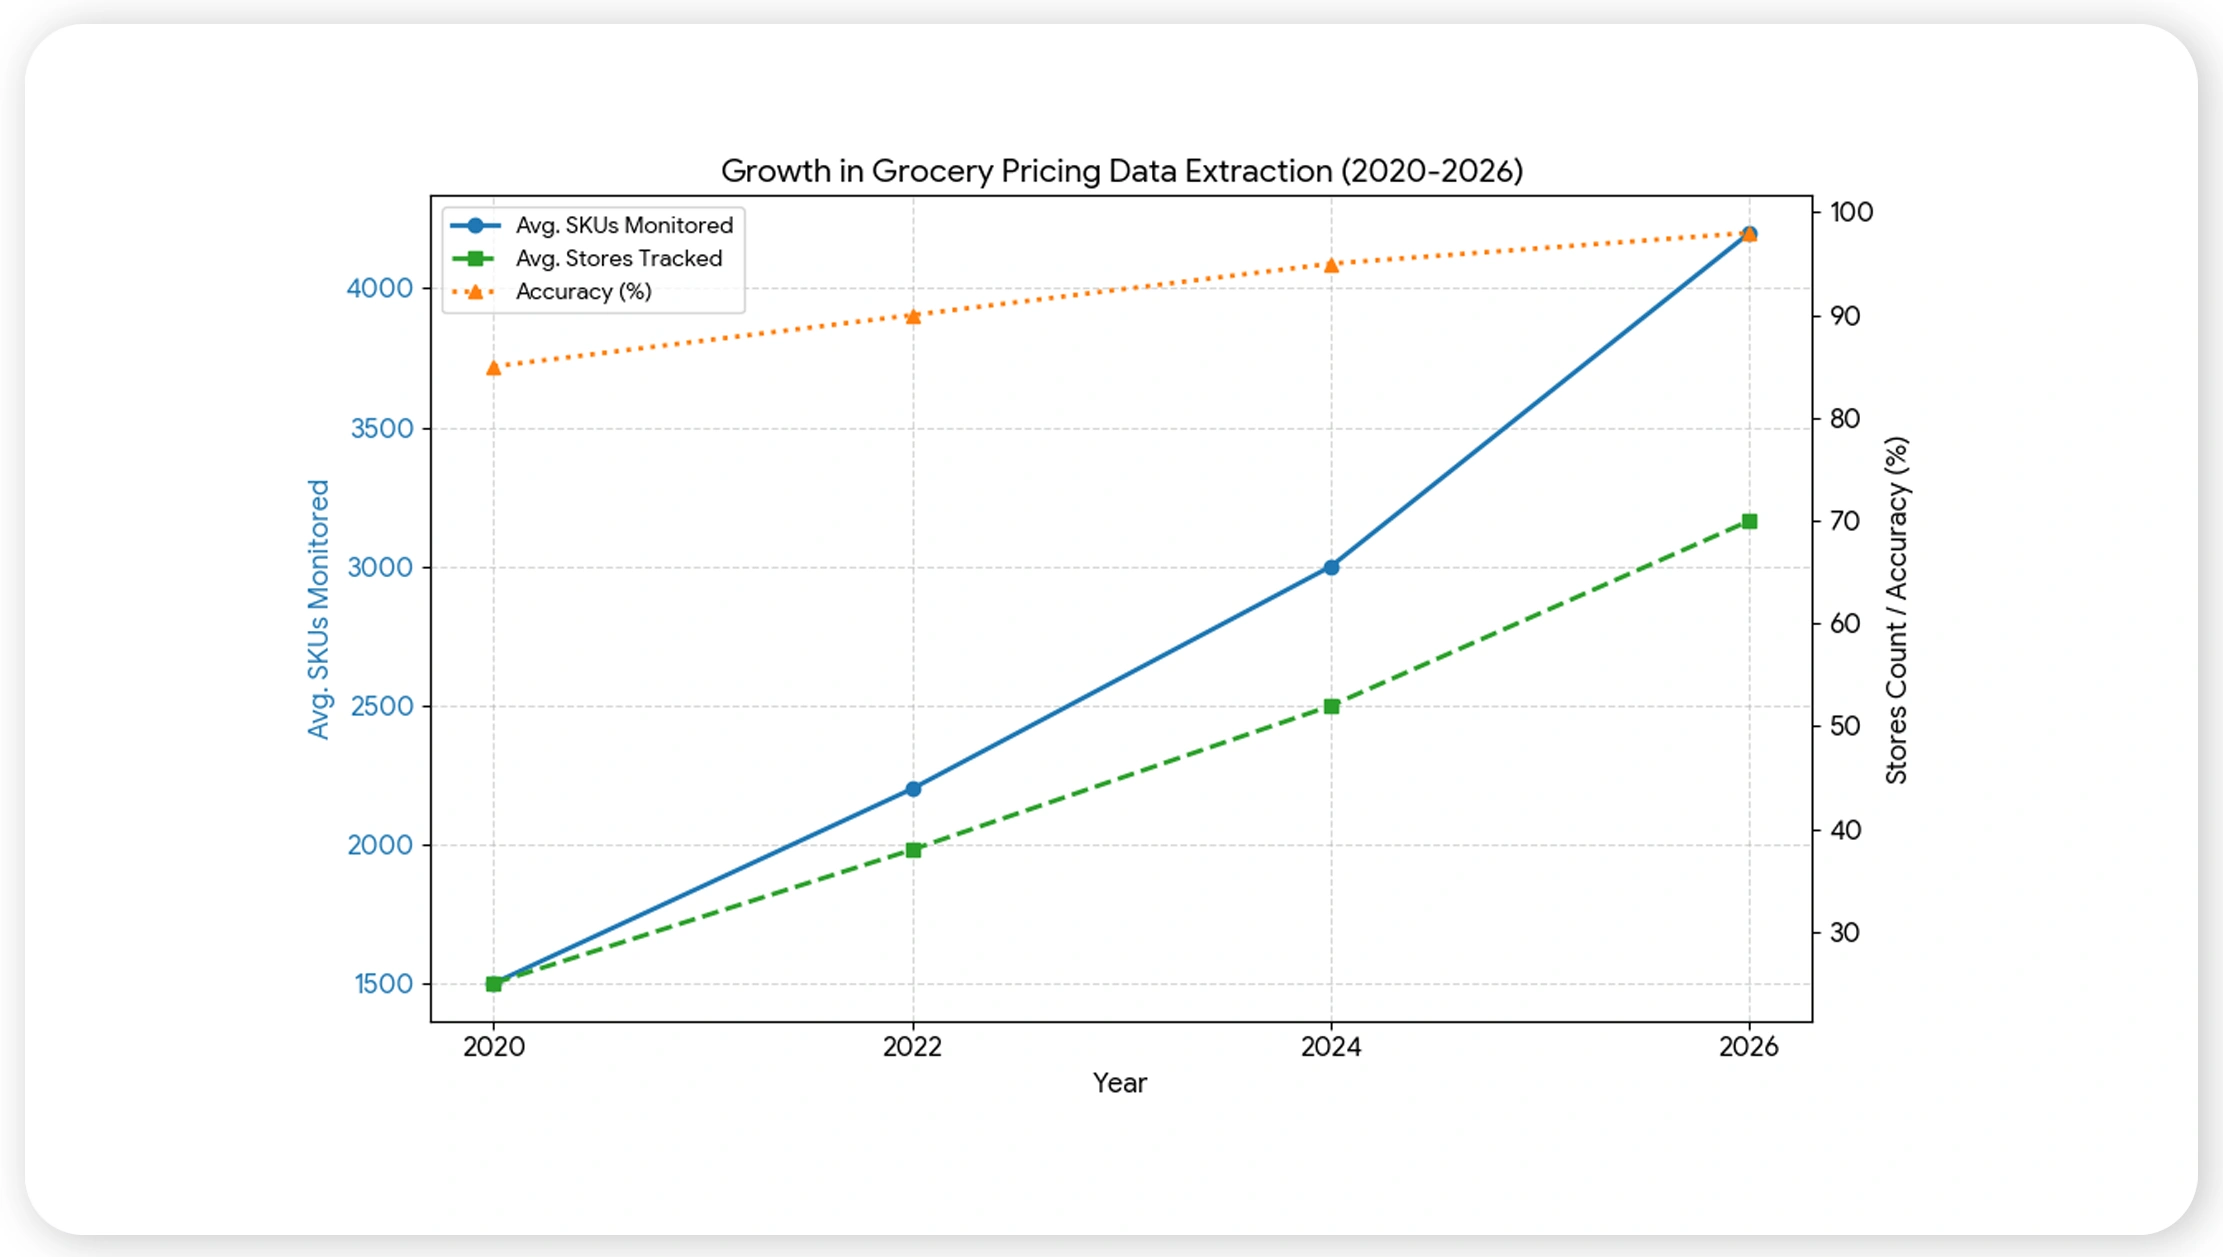
Retailers need structured pricing data to make informed decisions. grocery pricing data extraction enables automated capture of product prices, discounts, and stock status across multiple supermarket chains.
Between 2020 and 2026, the use of automated extraction tools grew steadily as retailers sought real-time monitoring solutions. The ability to consolidate disparate data sources into a single dashboard improved decision-making speed and accuracy.
Key benefits observed:
- Reduced manual monitoring by 60%
- Enabled 24/7 competitive tracking
- Improved pricing accuracy across multiple SKUs
| Year | Avg. Stores Tracked | Avg. SKUs Monitored | Accuracy (%) |
|---|---|---|---|
| 2020 | 25 | 1,500 | 85% |
| 2022 | 38 | 2,200 | 90% |
| 2024 | 52 | 3,000 | 95% |
| 2026 | 70 | 4,200 | 98% |
Automated extraction supports pricing optimization, trend detection, and operational agility.
Consolidating market-wide pricing
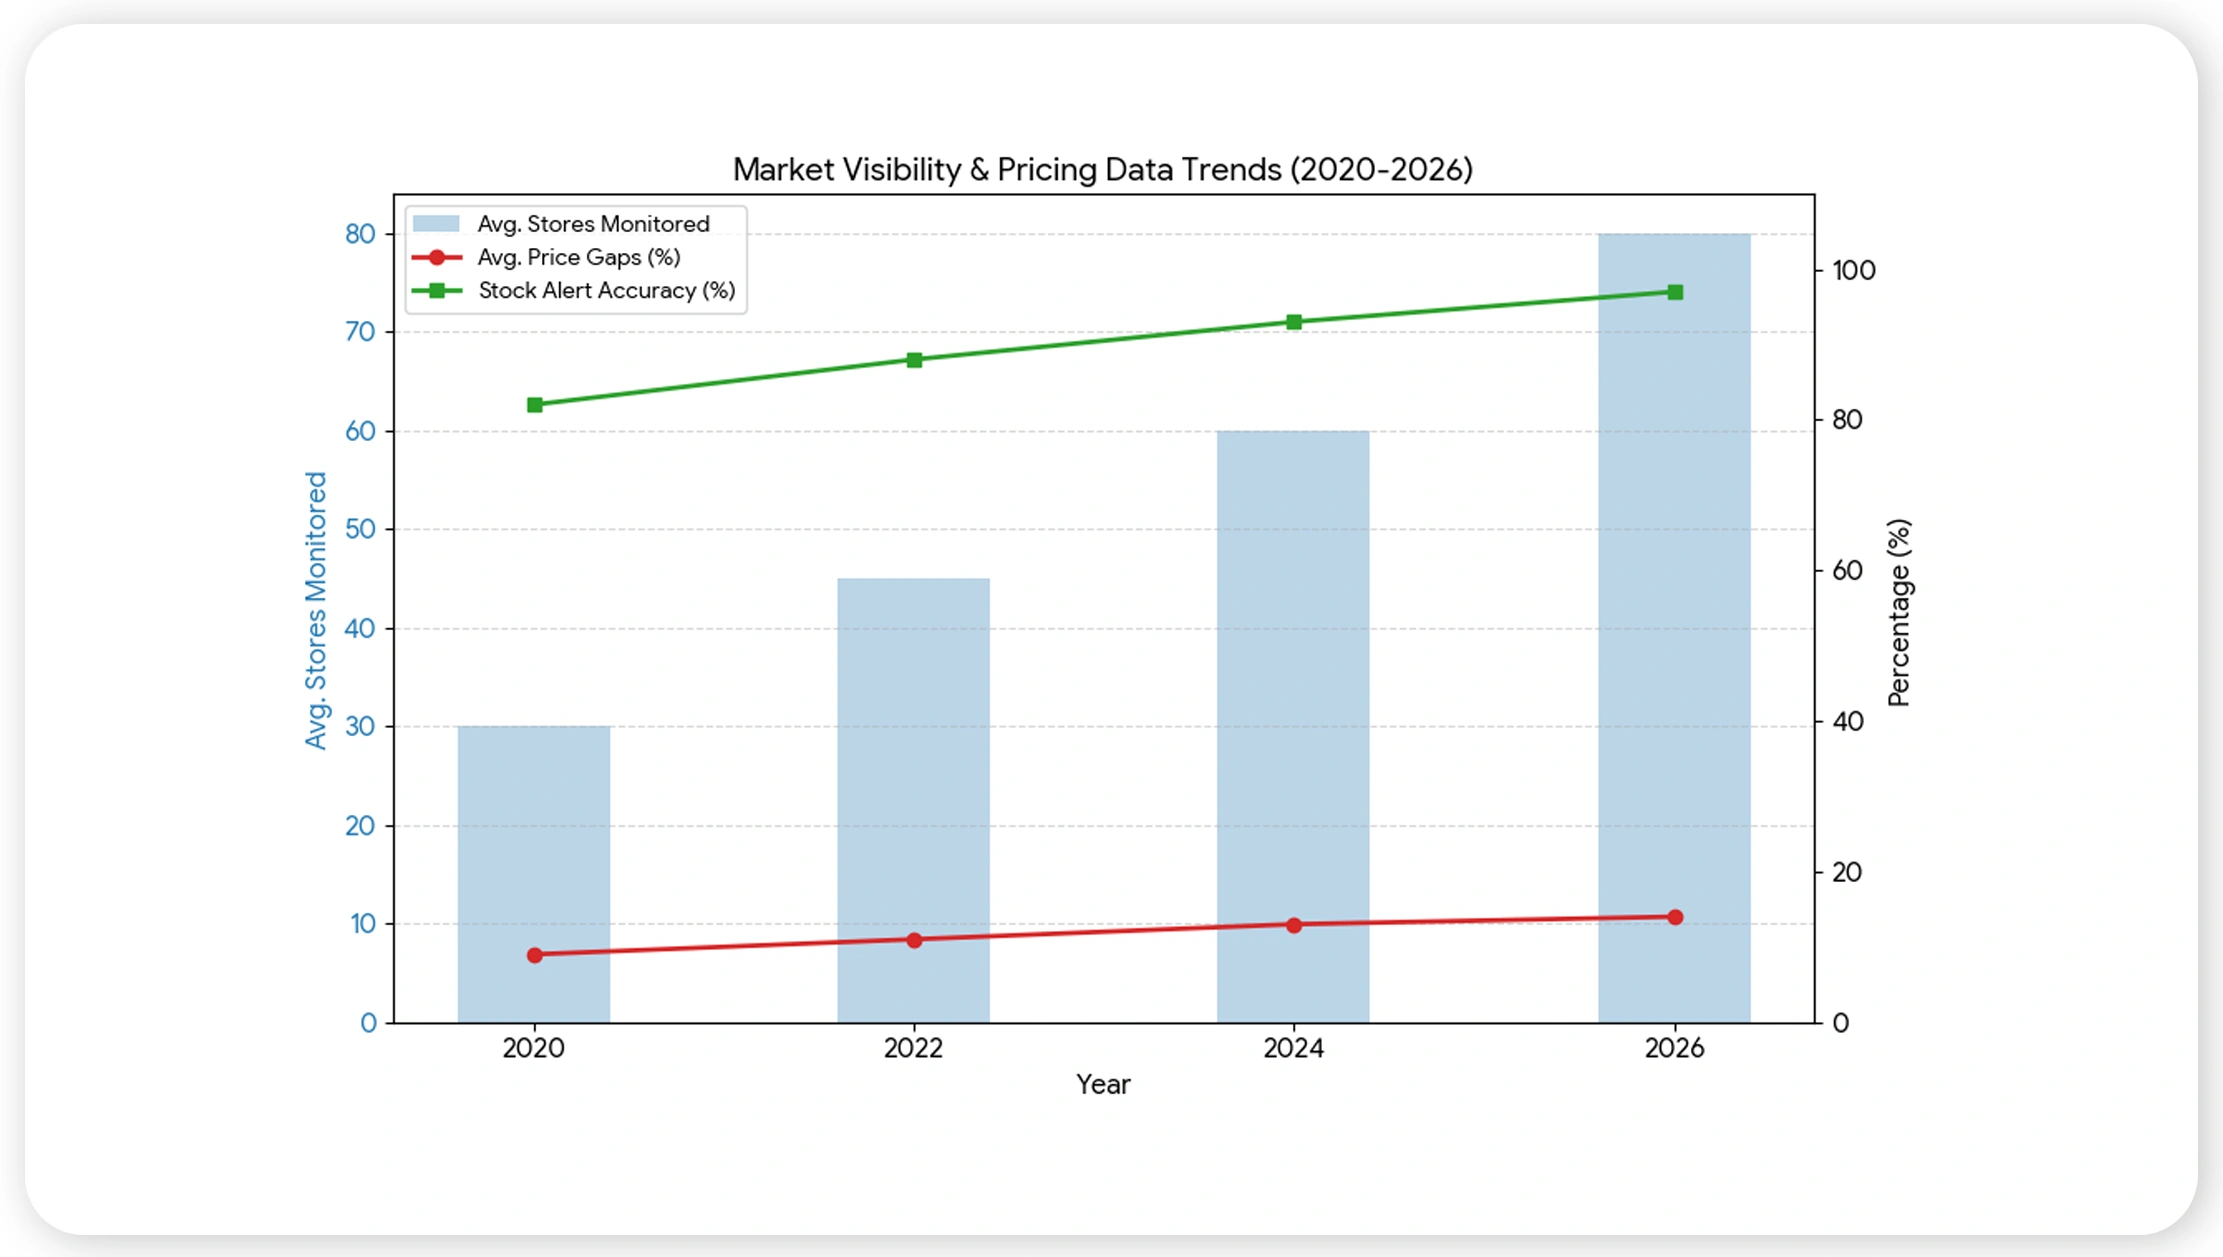
To gain full market visibility, retailers must Extract Grocery pricing data across regions, categories, and brands. Real Data API enables centralized dashboards for actionable intelligence.
From 2020 to 2026, multi-store extraction allowed retailers to identify cross-region discrepancies and optimize pricing strategies. Real-time aggregation reduced reaction time to competitive changes, supporting smarter promotions and stock allocations.
Trends and insights:
- Price gaps between urban and suburban outlets averaged 14%
- Real-time stock visibility increased by 38%
- Product availability alerts improved planning
| Year | Avg. Stores Monitored | Avg. Price Gaps (%) | Stock Alert Accuracy |
|---|---|---|---|
| 2020 | 30 | 9% | 82% |
| 2022 | 45 | 11% | 88% |
| 2024 | 60 | 13% | 93% |
| 2026 | 80 | 14% | 97% |
Centralized extraction empowers rapid competitive responses and inventory management.
APIs for faster insights
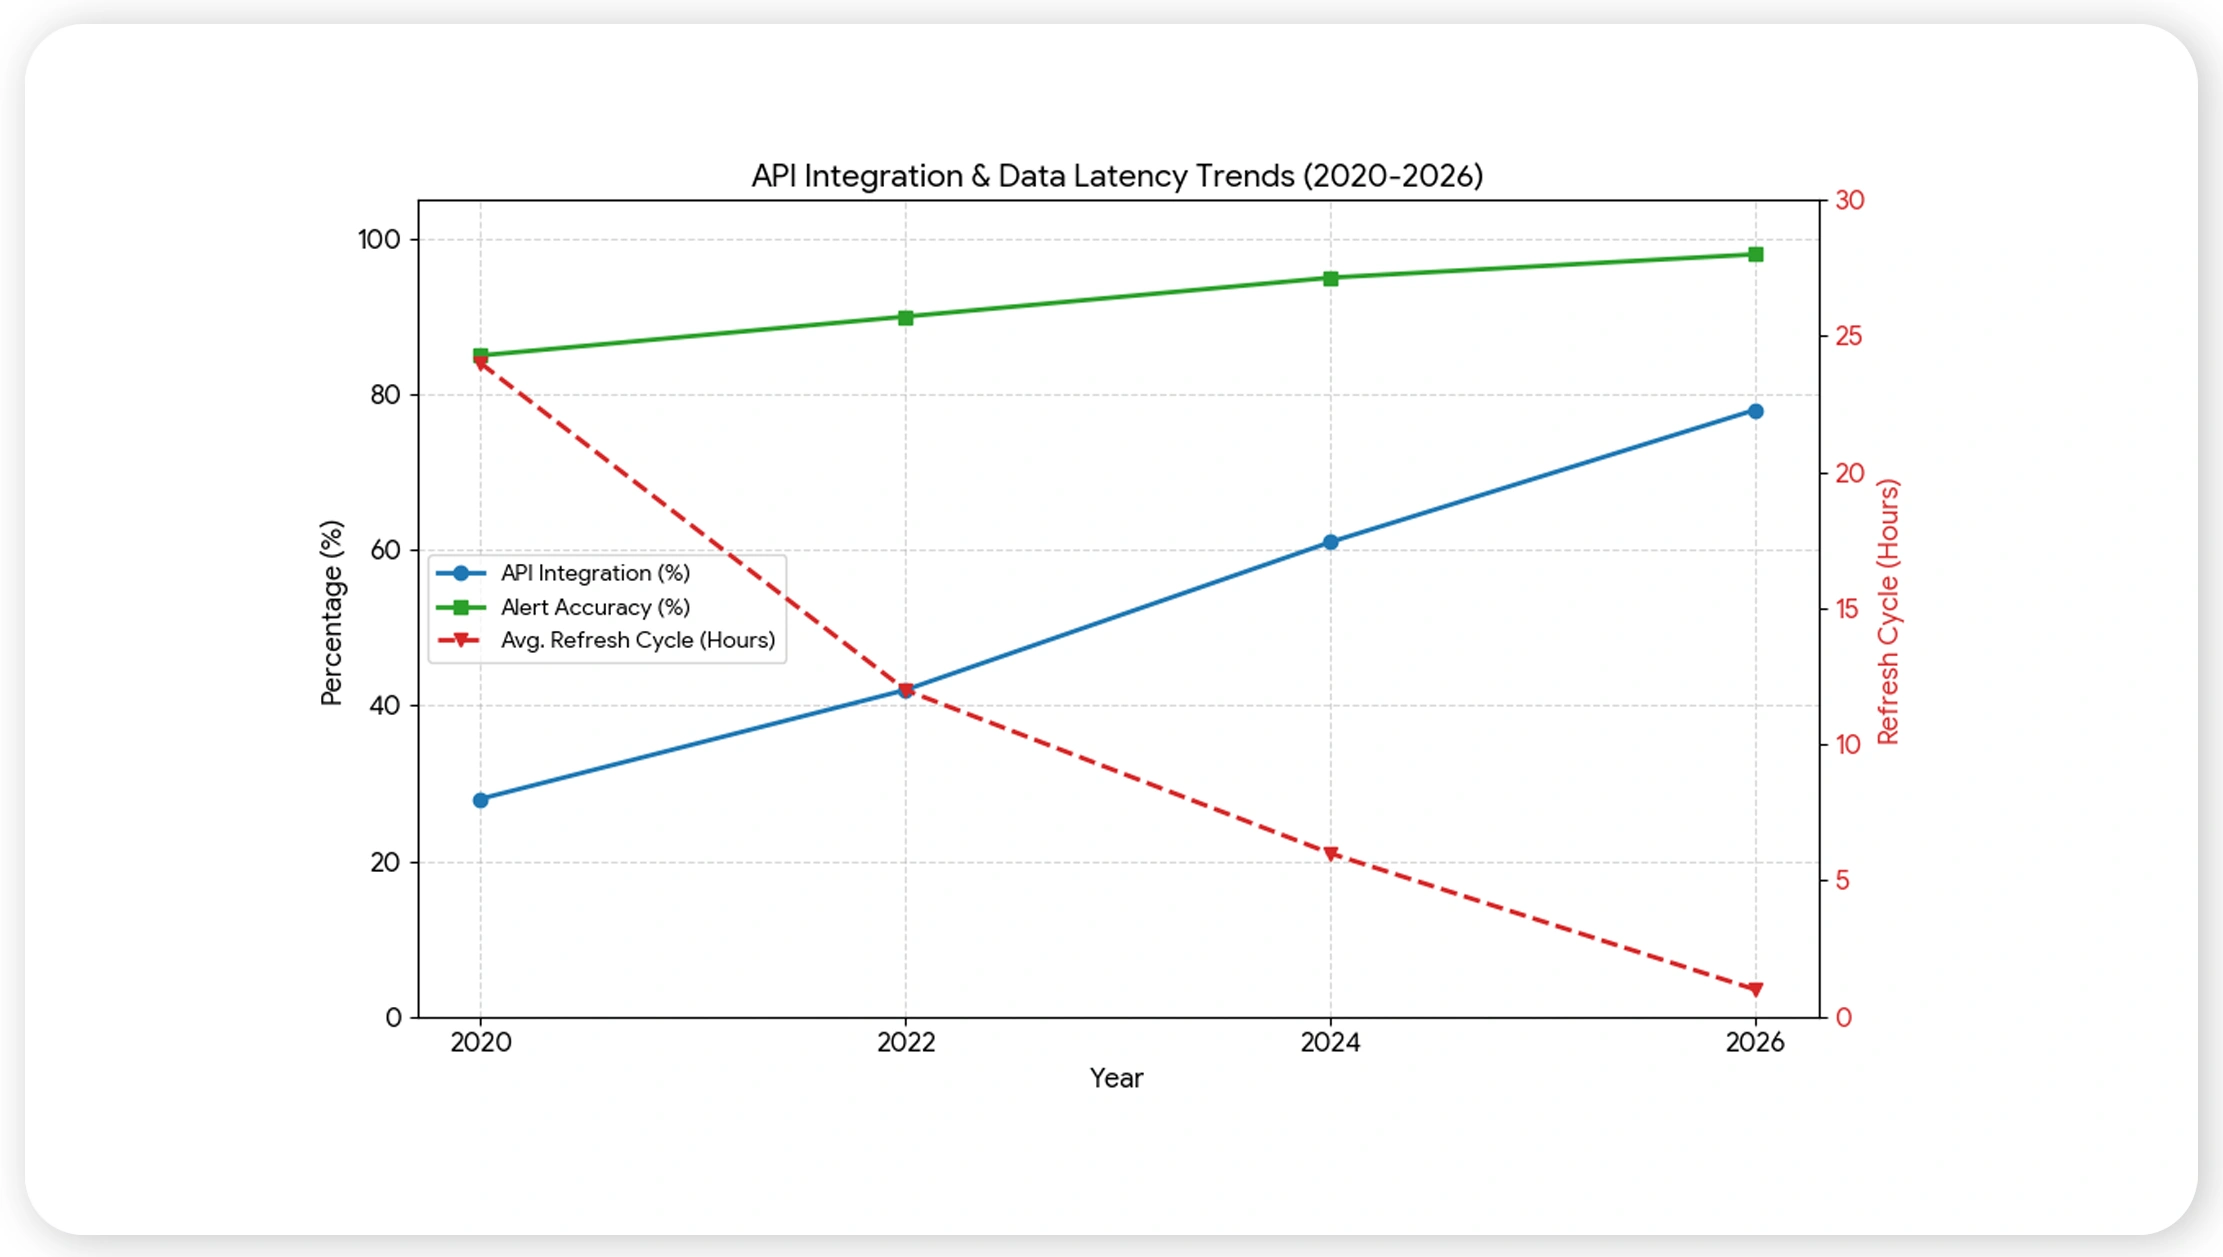
Integrating data pipelines improves efficiency. Grocery Data Scraping API enables real-time updates, alerts, and analytics integration for strategic decision-making.
From 2020 to 2026, API adoption increased among retailers seeking automated, near real-time insights. By connecting dashboards directly to extraction endpoints, brands reduced latency and improved market responsiveness.
Performance highlights:
- Data refresh cycles improved by 65%
- Integration with analytics platforms increased
- Response time for competitive alerts reduced
| Year | API Integration (%) | Avg. Refresh Cycle | Alert Accuracy (%) |
|---|---|---|---|
| 2020 | 28% | Daily | 85% |
| 2022 | 42% | 12 hours | 90% |
| 2024 | 61% | 6 hours | 95% |
| 2026 | 78% | 1 hour | 98% |
APIs enable continuous intelligence and proactive pricing adjustments.
Building actionable datasets
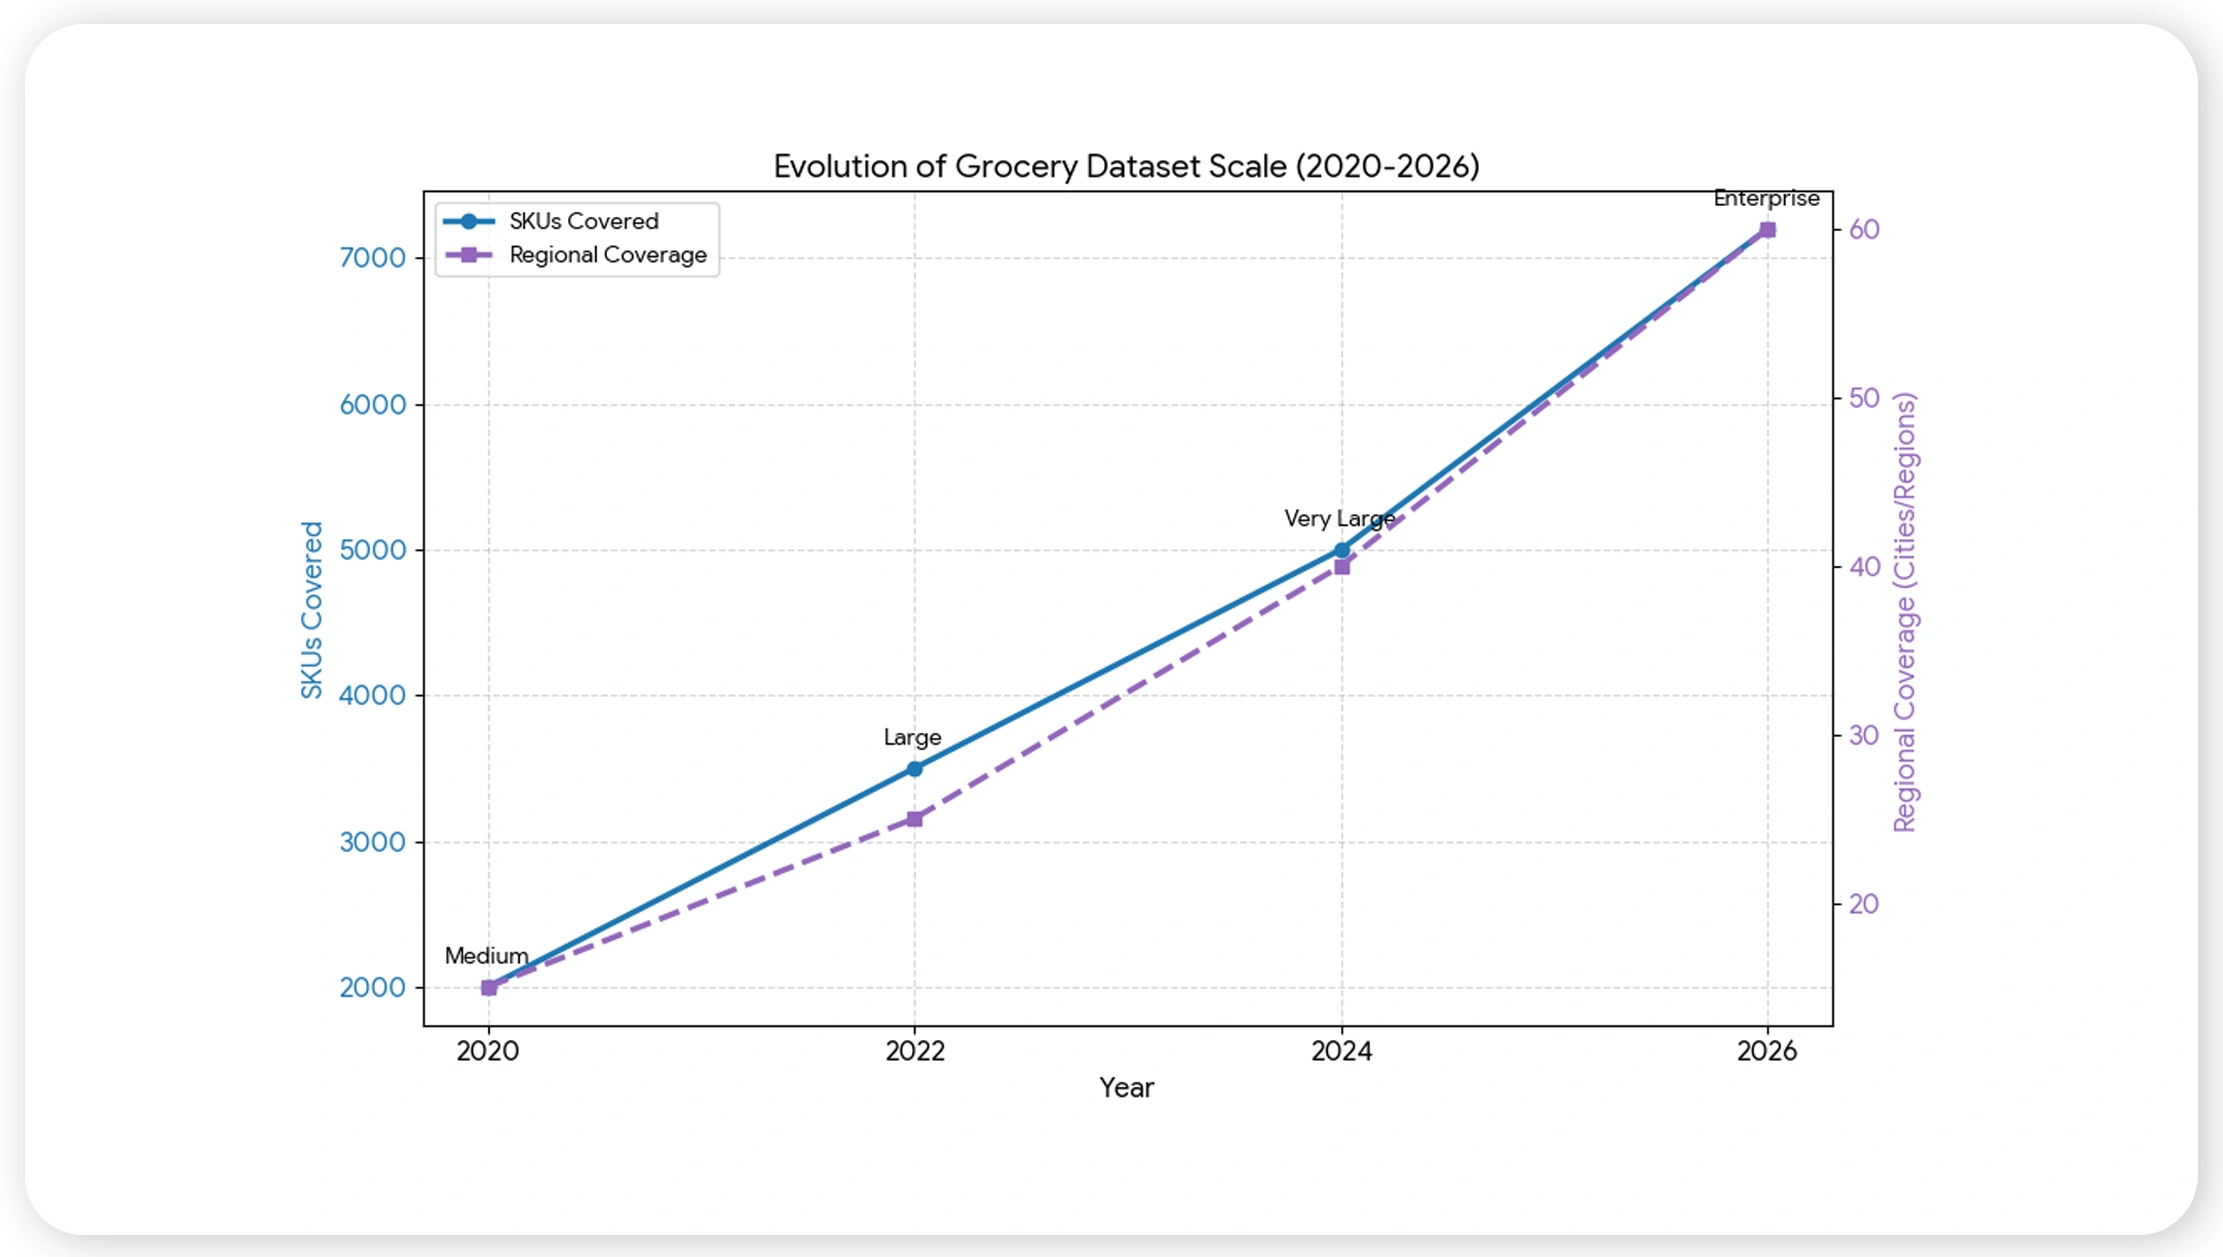
Structured insights depend on robust Grocery Dataset creation. Consolidated datasets allow multi-dimensional analysis including pricing, availability, and promotional trends.
Between 2020 and 2026, retailers increasingly relied on curated datasets to support forecasting, trend analysis, and competitive strategy. This approach also enabled predictive analytics and automated reporting.
Key observations:
- Historical trends supported 30% better forecasting
- Datasets improved cross-category analytics
- Data-driven promotions increased ROI
| Year | Dataset Size | SKUs Covered | Regional Coverage |
|---|---|---|---|
| 2020 | Medium | 2,000 | 15 |
| 2022 | Large | 3,500 | 25 |
| 2024 | Very Large | 5,000 | 40 |
| 2026 | Enterprise | 7,200 | 60 |
Curated datasets transform raw market signals into strategic business intelligence.
Why Choose Real Data API?
Real Data API empowers retailers with Real-Time Price Data Monitoring for Grocery Prices and leverages Real-time grocery market intelligence for faster pricing insights to drive smarter pricing, promotion, and assortment strategies. Our solution provides automated, scalable, and accurate pipelines that reduce latency and increase operational efficiency.
Conclusion
The modern grocery market rewards speed and intelligence. With Grocery Data Extraction and Real-time grocery market intelligence for faster pricing insights, retailers gain actionable, structured intelligence to stay ahead of competitors. Real Data API enables real-time monitoring, predictive insights, and centralized analytics, providing a clear competitive edge.
Unlock faster, smarter, and data-driven grocery decisions with Real Data API today!
Latest posts
How to Scrape Grocery Price Inflation Data Using Quick Commerce APIs for Real-Time Market Insights?
Real-Time Grocery Price Monitoring Across Blinkit BigBasket and Amazon Fresh - A Complete Guide to Competitive Pricing Intelligence

How Quick Commerce Data Scraping for Digital Shelf Intelligence Helps Brands Win Shelf Space in 2026
Scrape Zepto Data for new Product Launch for CPG brands - Track Availability, Pricing, and Consumer Trends
Real Data API stands out as one of the premier global companies specializing in web data Scraping and web extraction.


Rating 4.7
Rating 4.7
Rating 4.5
Rating 4.7
Rating 4.7


Disclaimer : RealData API functions solely as an independent data infrastructure and technology solutions provider. We build customized automation workflows designed to collect publicly accessible web data based exclusively on client instructions. RealData API neither owns proprietary datasets nor engages in the sale or redistribution of extracted information. Our operations are limited strictly to lawful public web data processing and never involve unauthorized access to restricted systems or private networks. Any company names, trademarks, logos, or brand references displayed on this website are used purely for demonstrative and illustrative purposes to showcase our technical capabilities and do not imply endorsement, partnership, or affiliation. Use of our platform and services remains subject to our Terms of Service.