

Introduction
In today’s data-driven retail environment, analyzing competitor store locations isn’t just smart—it’s essential. For businesses in convenience retail, fuel, quick commerce, and local delivery, understanding the geographic footprint of giants like 7-Eleven offers a competitive edge. That's why many forward-thinking brands Scrape 7-eleven Store locations USA to gain insights into strategic expansion, localized demand, and untapped market opportunities.
This blog explores how competitor location data—especially from convenience leaders like 7-Eleven—can help you grow, optimize, and outperform.
Why Competitor Store Location Data Matters?

Knowing where your competitors operate gives you clarity on:
- Market saturation
- Untapped zones for expansion
- Location-specific performance trends
- Traffic overlap and customer behavior
7-Eleven, with over 9,000 stores across the U.S., has a meticulously planned network. 7-eleven store locations data scraping USA allows businesses to reverse-engineer this strategy for their benefit.
| Year | 7-Eleven Stores USA | Competitor Stores (Avg.) | New Store Openings (7-Eleven) |
|---|---|---|---|
| 2020 | 9,100 | 3,800 | 75 |
| 2021 | 9,300 | 3,950 | 95 |
| 2022 | 9,480 | 4,100 | 105 |
| 2023 | 9,620 | 4,230 | 120 |
| 2024 | 9,750 | 4,300 | 130 |
| 2025* | 9,880 (Projected) | 4,420 (Projected) | 140 (Projected) |
Source: National Association of Convenience Stores (NACS), Real Data API estimates
1. Identifying Growth Gaps Through Geolocation Analysis
By analyzing where 7-Eleven isn’t, you can uncover profitable gaps in the market. Retailers, delivery services, and quick commerce startups Scrape 7-eleven Store locations USA to identify underserved ZIP codes, towns, or even entire metro areas.
Using heatmaps or city-wise location breakdowns, retailers can compare their own coverage with 7-Eleven’s presence to:
- Launch new outlets
- Partner with hyperlocal delivery firms
- Target location-specific advertising
| Year | Cities with High 7-Eleven Density | Cities with Low Density | Estimated Market Gap (Stores) |
|---|---|---|---|
| 2020 | 60 | 140 | 300 |
| 2021 | 65 | 130 | 280 |
| 2022 | 70 | 120 | 260 |
| 2023 | 75 | 110 | 240 |
| 2024 | 80 | 100 | 220 |
| 2025* | 85 (Projected) | 90 (Projected) | 200 (Projected) |
Source: Real Data API geolocation models, internal benchmarks
2. Strategic Delivery Zone Optimization
Delivery businesses, especially in food and convenience, benefit greatly from competitor proximity data. If 7-Eleven has a dense store network in a city, demand for fast, convenient delivery is likely high.
Using Scraping 7-eleven store Locations Data USA, Q-commerce players and last-mile startups can:
- Build efficient delivery zones
- Avoid location overlap
- Identify underserved suburbs and urban pockets
| Year | Avg. Delivery Coverage Radius | Missed Opportunity Zones Identified | Cost Savings via Zone Recalibration |
|---|---|---|---|
| 2020 | 4.2 miles | 85 | $75,000 |
| 2021 | 3.9 miles | 95 | $85,000 |
| 2022 | 3.5 miles | 110 | $96,000 |
| 2023 | 3.2 miles | 125 | $110,000 |
| 2024 | 3.0 miles | 140 | $125,000 |
| 2025* | 2.8 miles (Projected) | 160 (Projected) | $140,000 (Projected) |
Source: Delivery benchmarks from Real Data API clients in logistics and Q-commerce
Unlock location intelligence—Scrape 7-Eleven Store Locations USA to drive competitive analysis and strategic retail growth today!
Get Insights Now!3. Real Estate and Franchise Expansion Decisions
Real estate developers and franchise businesses use location data to evaluate retail site potential. If a 7-Eleven store exists near a particular intersection, the area likely sees decent foot traffic, good zoning policies, and stable rental trends.
Web Scraping 7-eleven store locations USA provides:
- Competitive presence mapping
- Traffic pattern correlation
- Optimal lease negotiation insights
| Year | Real Estate ROI (Near 7-Eleven Zones) | Avg. Franchise Revenue | Site Selection Accuracy (Post-Scraping) |
|---|---|---|---|
| 2020 | 7.2% | $325K | 68% |
| 2021 | 8.1% | $348K | 73% |
| 2022 | 9.3% | $374K | 78% |
| 2023 | 10.1% | $395K | 82% |
| 2024 | 11.4% | $425K | 86% |
| 2025* | 12.5% (Projected) | $455K (Projected) | 90% (Projected) |
Source: Franchise Times, Real Data API surveys, local real estate analytics
4. Localized Marketing and Promotions
Marketing teams use competitor presence data to create laser-focused promotions. Brands launch geo-targeted digital ads or SMS campaigns where 7-Eleven stores are clustered or absent.
With tools like 7-eleven stores locations Extractor USA, marketers can:
- Launch “Next to 7-Eleven” ads
- Offer counter deals in high-traffic zones
- Avoid ad spend in saturated areas
| Year | Campaign ROI with Geotargeting | Avg. Customer Acquisition Cost | Local Promo Conversion Rate |
|---|---|---|---|
| 2020 | 2.4x | $19.50 | 3.1% |
| 2021 | 2.7x | $17.80 | 3.5% |
| 2022 | 3.0x | $16.00 | 3.9% |
| 2023 | 3.3x | $14.90 | 4.2% |
| 2024 | 3.6x | $13.40 | 4.6% |
| 2025* | 3.9x (Projected) | $12.20 (Projected) | 5.0% (Projected) |
Source: Campaign data from Real Data API clients, Digital Commerce 360
5. Benchmarking and Store Performance Intelligence
Retail chains often benchmark their locations against competitors like 7-Eleven to evaluate performance metrics. Data from Store location USA tools helps businesses analyze sales vs. store density, catchment overlap, and seasonal spikes.
Even non-retail businesses such as vending machine companies or ATM networks Scrape 7-eleven Store locations USA to find high-footfall zones for their installations.
| Year | Retailers Using Competitor Store Benchmarks | Avg. Performance Improvement | Sales Uplift After Store Repositioning |
|---|---|---|---|
| 2020 | 32% | 5.5% | 6.2% |
| 2021 | 41% | 6.8% | 7.4% |
| 2022 | 48% | 7.6% | 8.1% |
| 2023 | 55% | 8.4% | 9.0% |
| 2024 | 62% | 9.3% | 10.2% |
| 2025* | 70% (Projected) | 10.1% (Projected) | 11.4% (Projected) |
Source: Real Data API internal performance tracking
Why Choose Real Data API?
Real Data API is the trusted partner for thousands of businesses seeking precise, reliable store location data. Here's why you should choose us:
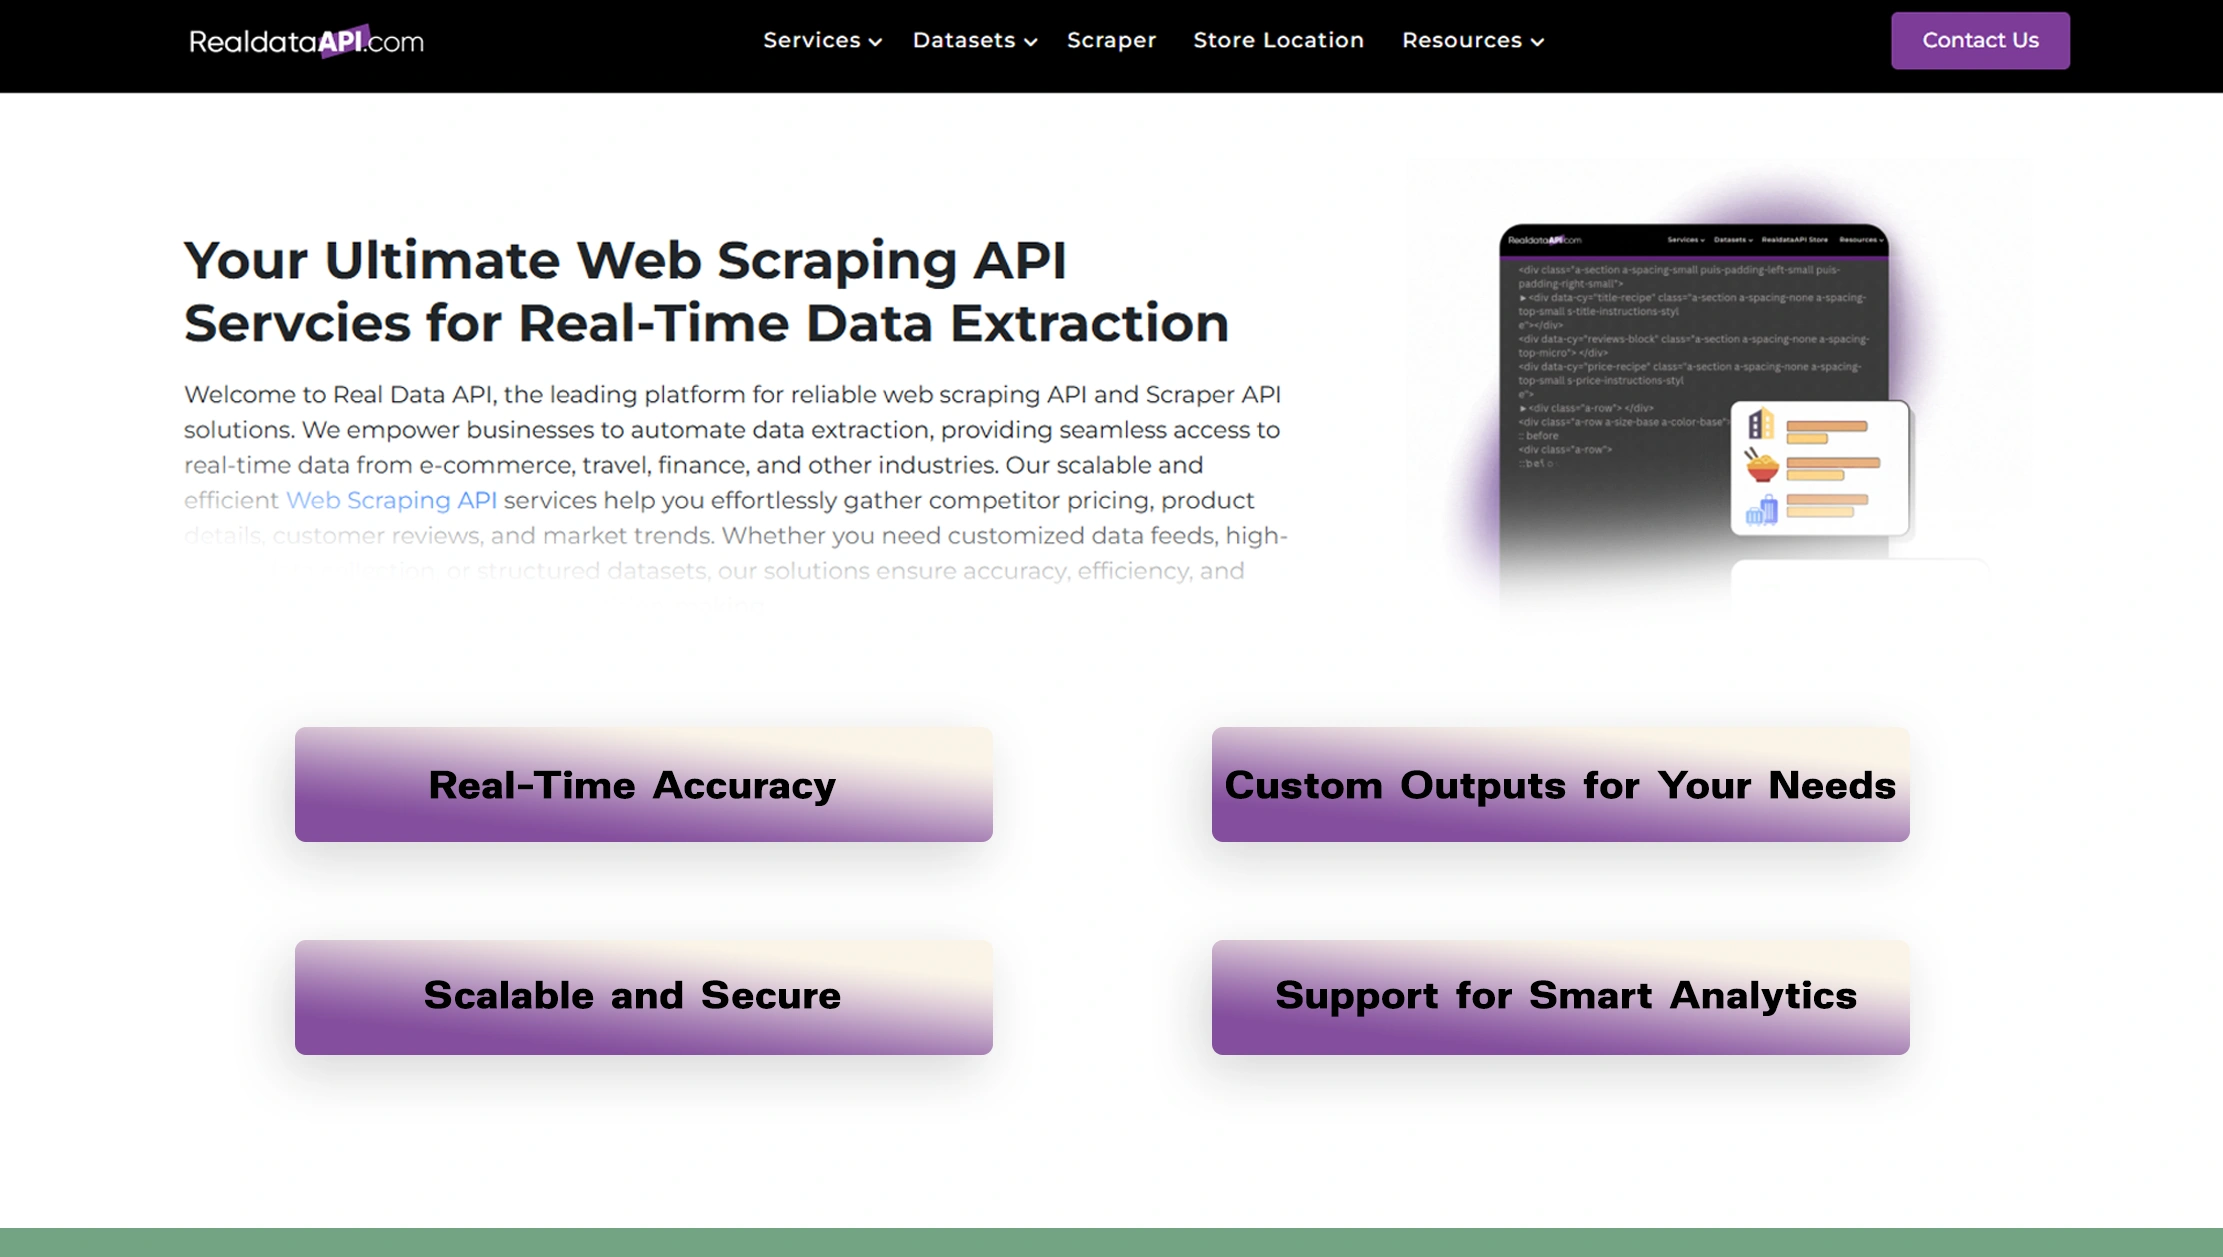
Real-Time Accuracy: We refresh our data regularly, ensuring all store coordinates, city tags, and ZIP codes are current and actionable.
Custom Outputs for Your Needs: From JSON to CSV or API endpoints, choose the data format that fits your workflow—whether you're mapping, modeling, or integrating.
Scalable and Secure: Access millions of data points without performance lag. Plus, we adhere to industry best practices and scraping compliance standards.
Support for Smart Analytics: Use our enriched datasets to run proximity analysis, traffic models, and retail forecasting.
Whether you’re a startup, franchise, logistics company, or real estate planner—Real Data API delivers the store location intelligence you need to grow.
Conclusion
Today’s market leaders no longer guess—they analyze. That’s why forward-thinking businesses Scrape 7-eleven Store locations USA to understand competitor strategy, discover expansion zones, and power smarter decisions. From delivery mapping to localized campaigns and franchise growth, scraping competitor location data using tools like 7-eleven store locations data scraping USA and 7-eleven stores locations Extractor USA unlocks actionable insights.
Start scraping smarter—try Real Data API today and gain full access to U.S. retail location intelligence that drives results!
Latest posts

Why Brands Use Competitive Data Intelligence to Increase Market Share in Highly Competitive Markets?

How To Scrape Competitor Data To Support Market Entry Strategy And Expansion Planning For Data-Driven Business Growth?

How Hotel Occupancy Intelligence Through Public Data Sources Is Reshaping Revenue Management

The ZIP Code Advantage: How Hyper-Local Amazon Product Data Collection Is Redefining Retail Intelligence
Real Data API stands out as one of the premier global companies specializing in web data Scraping and web extraction.


Rating 4.7
Rating 4.7
Rating 4.5
Rating 4.7
Rating 4.7


Disclaimer : RealData API functions solely as an independent data infrastructure and technology solutions provider. We build customized automation workflows designed to collect publicly accessible web data based exclusively on client instructions. RealData API neither owns proprietary datasets nor engages in the sale or redistribution of extracted information. Our operations are limited strictly to lawful public web data processing and never involve unauthorized access to restricted systems or private networks. Any company names, trademarks, logos, or brand references displayed on this website are used purely for demonstrative and illustrative purposes to showcase our technical capabilities and do not imply endorsement, partnership, or affiliation. Use of our platform and services remains subject to our Terms of Service.