
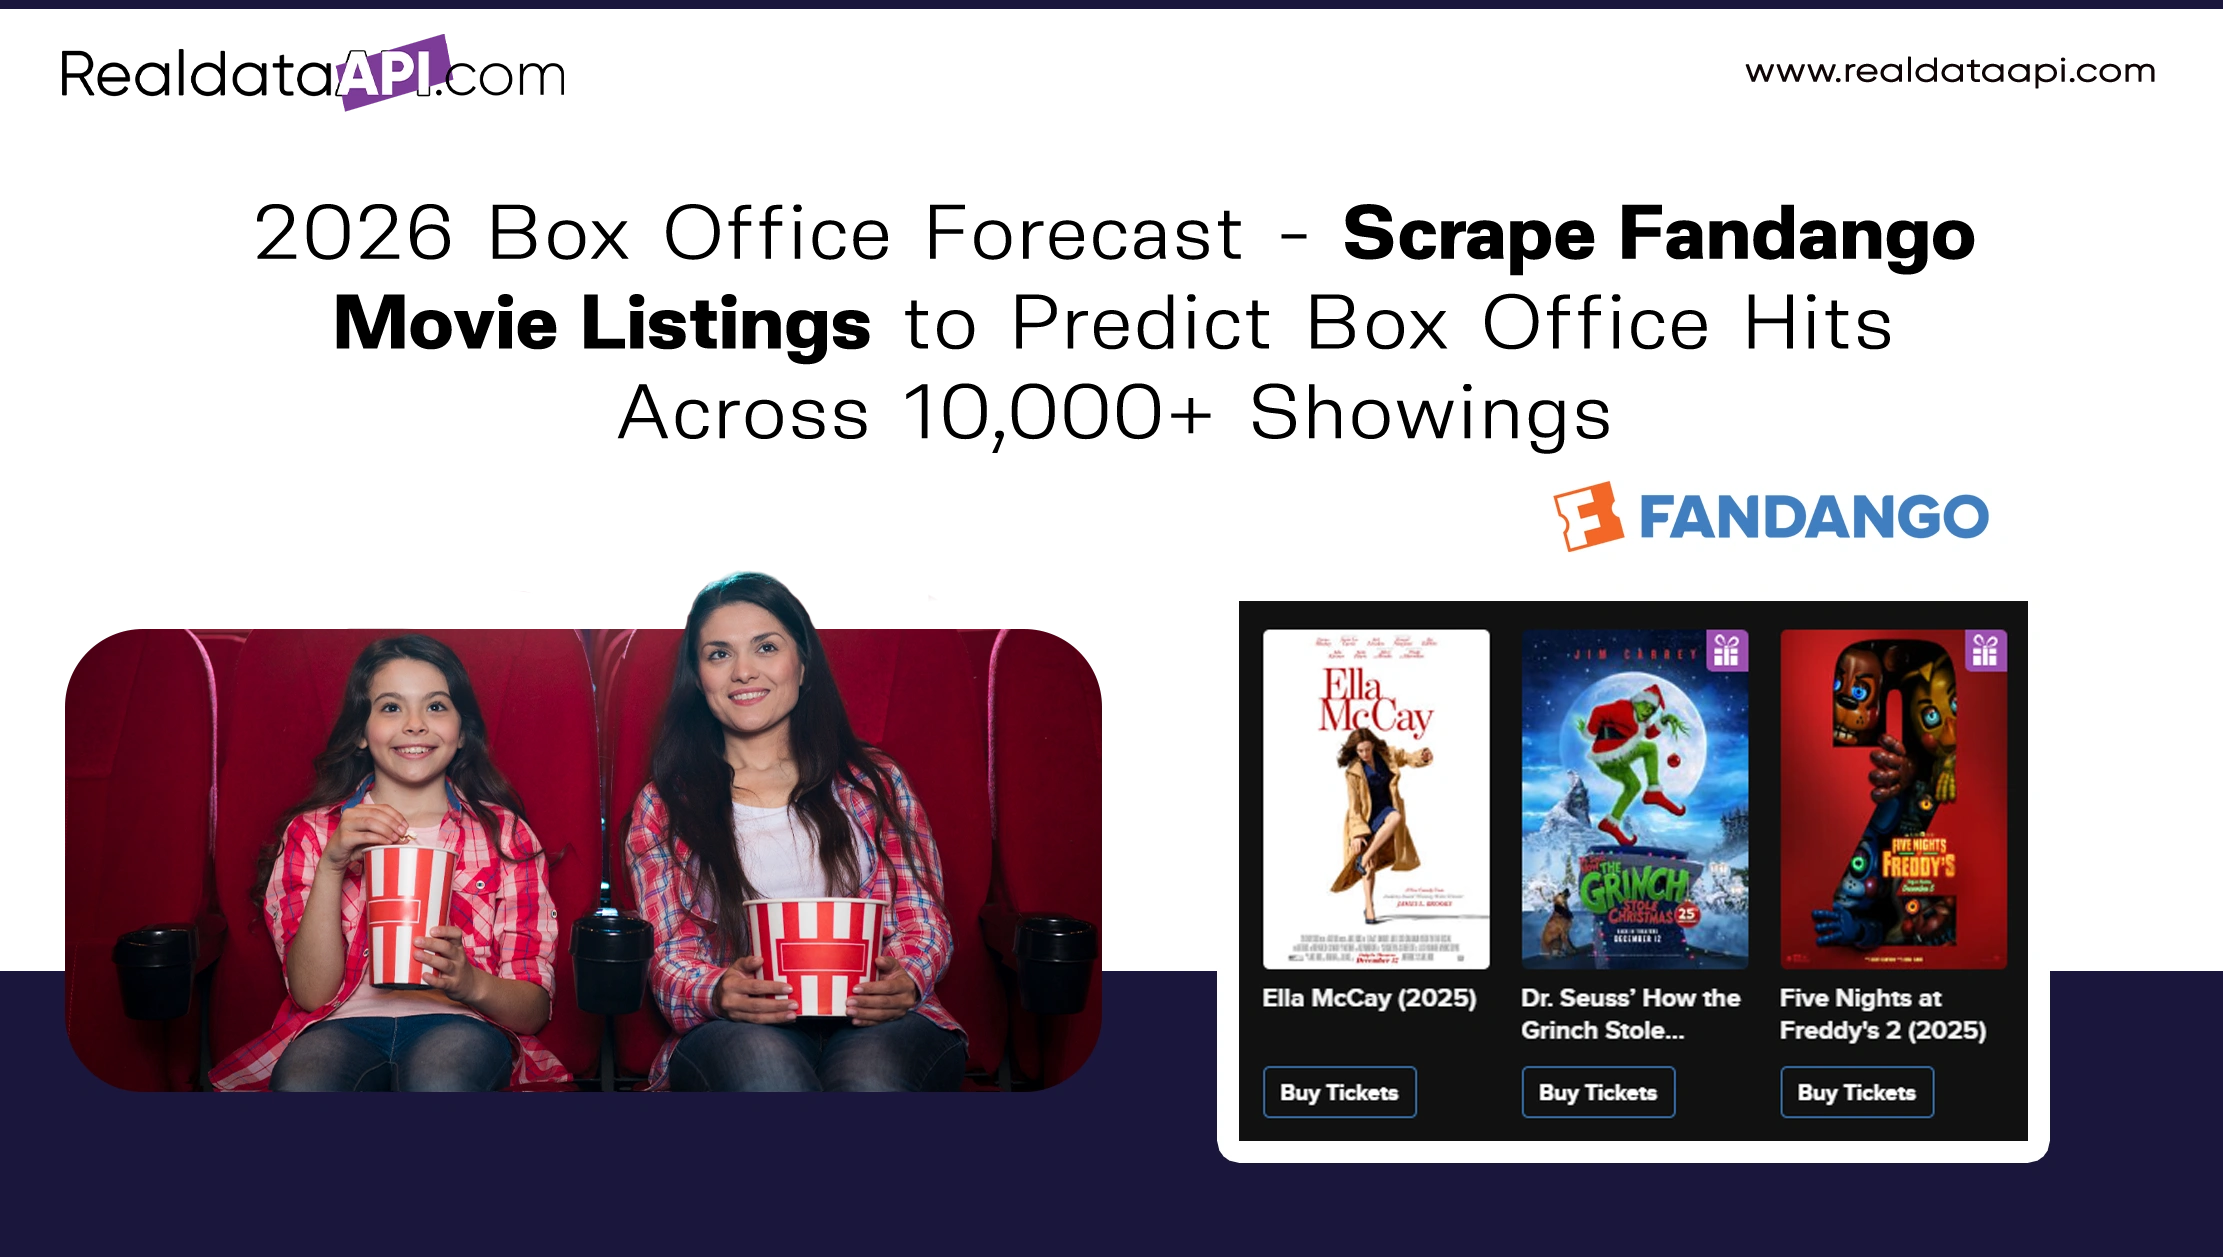
Introduction
Predicting box office hits has historically been a challenging task for studios, distributors, and theater operators. Traditional forecasting relied heavily on market intuition, marketing spend, star power, and historical trends. However, the emergence of digital ticketing platforms like Fandango has revolutionized this process. By enabling analysts and studios to scrape Fandango movie listings to predict box office hits, it is now possible to access real-time, structured data on movie showtimes, ticket sales, theater performance, and audience preferences with the help of Price Comparison tool.
This data-driven approach allows studios to track trends across thousands of showings annually, understand consumer behavior, and optimize release strategies. By combining this data with OTT Data Scraping API insights, businesses can monitor streaming trends that directly influence theater attendance. Integrating ticket sales, pricing patterns, and audience engagement metrics provides a holistic view of potential revenue. With over 10,000 showings analyzed, decision-makers can now make informed marketing, distribution, and scheduling choices, ensuring films reach their maximum box office potential .
Tracking Movie and Theater Trends
Understanding audience preferences and theater performance is essential for box office forecasting. Using Movie and theater trend insights via Fandango scraping, analysts can identify patterns in genre popularity, peak showtimes, and regional attendance trends. This information helps studios determine which films are likely to perform best and where to focus marketing efforts.
Movie Trends (2020–2025)
| Year | Total Movies Listed | Avg. Showings per Movie | Top Genres |
|---|---|---|---|
| 2020 | 3,200 | 25 | Action, Drama |
| 2021 | 3,500 | 28 | Action, Comedy |
| 2022 | 4,000 | 30 | Action, Adventure |
| 2023 | 4,500 | 32 | Comedy, Drama |
| 2024 | 4,800 | 35 | Action, Sci-Fi |
| 2025* | 5,000 | 38 | Action, Fantasy |
For instance, the rise of superhero and fantasy films from 2022–2025 corresponds with the largest increases in showings. Regional theaters in urban hubs saw higher average showings per movie due to dense population and higher ticket demand. By analyzing these trends, studios can optimize release schedules, adjust marketing budgets, and identify underperforming genres to refine content production.
Showtimes and Pricing Insights

Ticket pricing and showtime scheduling are critical for revenue optimization. Fandango showtime and pricing data extraction allows analysts to monitor ticket costs, peak viewing hours, and occupancy trends. This data helps theaters maximize revenue and studios predict opening weekend performance accurately.
Pricing Metrics (2020–2025)
| Year | Avg. Ticket Price ($) | Peak Showtimes | Max Capacity (%) |
|---|---|---|---|
| 2020 | 12 | 7–9 PM | 80 |
| 2021 | 12.5 | 6–9 PM | 82 |
| 2022 | 13 | 6–9 PM | 84 |
| 2023 | 13.5 | 5–8 PM | 85 |
| 2024 | 14 | 5–8 PM | 87 |
| 2025* | 14.5 | 5–8 PM | 88 |
Dynamic pricing strategies, such as higher weekend and evening prices, significantly impact revenue. Data from Fandango enables predictive adjustments to ticket pricing based on historical trends, helping theaters improve occupancy and studios forecast earnings.
Ticket Sales Analytics
Ticket sales data is a direct indicator of audience interest. Web Scraping Fandango ticket sales data provides insights into sales velocity, opening weekend performance, and overall engagement trends.
Sales Metrics (2020–2025)
| Year | Total Tickets Sold | Avg. Tickets per Movie | Avg. Daily Revenue ($) |
|---|---|---|---|
| 2020 | 5,000,000 | 1,500 | 18,000 |
| 2021 | 5,500,000 | 1,600 | 19,500 |
| 2022 | 6,000,000 | 1,700 | 20,800 |
| 2023 | 6,500,000 | 1,800 | 22,000 |
| 2024 | 7,000,000 | 1,900 | 23,500 |
| 2025* | 7,500,000 | 2,000 | 25,000 |
Tracking sales patterns during pre-sales and opening weekends allows studios to adjust marketing campaigns and optimize theater allocation. High pre-sale rates often indicate a film's potential to become a box office hit. Coupled with social media analytics, sales data provides a complete picture of audience sentiment.
API Integration for Scalable Scraping
Automation is essential when handling thousands of movies and showings. Using a Fandango API scraper, analysts can gather real-time data on listings, ticket sales, and showtimes efficiently.
API Metrics (2020–2025)
| Year | API Requests | Avg. Response Time (s) | Successful Data Retrieval (%) |
|---|---|---|---|
| 2020 | 50,000 | 1.2 | 92 |
| 2021 | 60,000 | 1.1 | 94 |
| 2022 | 70,000 | 1.0 | 95 |
| 2023 | 80,000 | 0.9 | 96 |
| 2024 | 90,000 | 0.8 | 97 |
| 2025* | 100,000 | 0.7 | 98 |
API-based scraping ensures accurate, real-time insights across thousands of listings, reducing manual errors and allowing studios to predict box office hits weeks in advance.
Leveraging Web Scraping Services

Custom Fandango Web Scraping Services enable extraction of detailed datasets including audience demographics, regional attendance, and ticket trends. This allows for highly targeted marketing and optimized release strategies.
Web Scraping Metrics (2020–2025)
| Year | Movies Scraped | Total Data Points | Avg. Processing Time (hrs) |
|---|---|---|---|
| 2020 | 3,000 | 50,000 | 10 |
| 2021 | 3,500 | 70,000 | 9 |
| 2022 | 4,000 | 90,000 | 8 |
| 2023 | 4,500 | 110,000 | 7 |
| 2024 | 4,800 | 130,000 | 6 |
| 2025* | 5,000 | 150,000 | 5 |
These services ensure comprehensive coverage of movie listings, enabling predictive analytics for both theater and OTT platforms.
OTT and Streaming Insights
OTT platforms influence theater attendance, making OTT Data Scraping API insights critical. Tracking streaming popularity, release timing, and viewer ratings allows studios to anticipate box office performance.
OTT Metrics (2020–2025)
| Year | Total Movies on OTT | Avg. Views per Movie | Avg. Ratings |
|---|---|---|---|
| 2020 | 1,500 | 20,000 | 4.2 |
| 2021 | 1,700 | 25,000 | 4.3 |
| 2022 | 2,000 | 30,000 | 4.4 |
| 2023 | 2,500 | 35,000 | 4.5 |
| 2024 | 3,000 | 40,000 | 4.6 |
| 2025* | 3,500 | 50,000 | 4.7 |
OTT data complements theater analytics to create holistic forecasting models, helping studios predict overall film performance across platforms.
Key Takeaways

- Box office potential can now be forecasted by combining theater and OTT analytics.
- Fandango scraping reveals trends in genres, showtimes, ticket pricing, and regional performance.
- API and web scraping tools provide real-time, structured datasets for predictive insights.
- Pre-sales, opening weekend performance, and streaming popularity are key indicators of success.
- Using scraped Fandango movie listings to predict box office hits improves ROI for marketing campaigns and release strategies.
Why Choose Real Data API?
Real Data API provides end-to-end solutions to scrape Fandango movie listings to predict box office hits accurately. Combined with structured OTT Dataset analytics, our services help studios, theaters, and analysts forecast revenue, optimize marketing campaigns, and allocate resources effectively. With real-time updates and scalable APIs, Real Data API ensures you never miss critical insights that influence box office success.
Conclusion
Leveraging Real Data API enables stakeholders to scrape Fandango movie listings to predict box office hits, analyze ticket trends, and perform Price Comparison across theaters and showtimes. This empowers studios to plan releases strategically, maximize revenue, and respond to audience preferences with precision.
Unlock predictive insights for your next blockbuster—contact Real Data API today to scrape Fandango movie listings and ticket trends for actionable box office forecasting!
Latest posts

Why Brands Use Competitive Data Intelligence to Increase Market Share in Highly Competitive Markets?

How To Scrape Competitor Data To Support Market Entry Strategy And Expansion Planning For Data-Driven Business Growth?

How Hotel Occupancy Intelligence Through Public Data Sources Is Reshaping Revenue Management

The ZIP Code Advantage: How Hyper-Local Amazon Product Data Collection Is Redefining Retail Intelligence
Real Data API stands out as one of the premier global companies specializing in web data Scraping and web extraction.


Rating 4.7
Rating 4.7
Rating 4.5
Rating 4.7
Rating 4.7


Disclaimer : RealData API functions solely as an independent data infrastructure and technology solutions provider. We build customized automation workflows designed to collect publicly accessible web data based exclusively on client instructions. RealData API neither owns proprietary datasets nor engages in the sale or redistribution of extracted information. Our operations are limited strictly to lawful public web data processing and never involve unauthorized access to restricted systems or private networks. Any company names, trademarks, logos, or brand references displayed on this website are used purely for demonstrative and illustrative purposes to showcase our technical capabilities and do not imply endorsement, partnership, or affiliation. Use of our platform and services remains subject to our Terms of Service.