
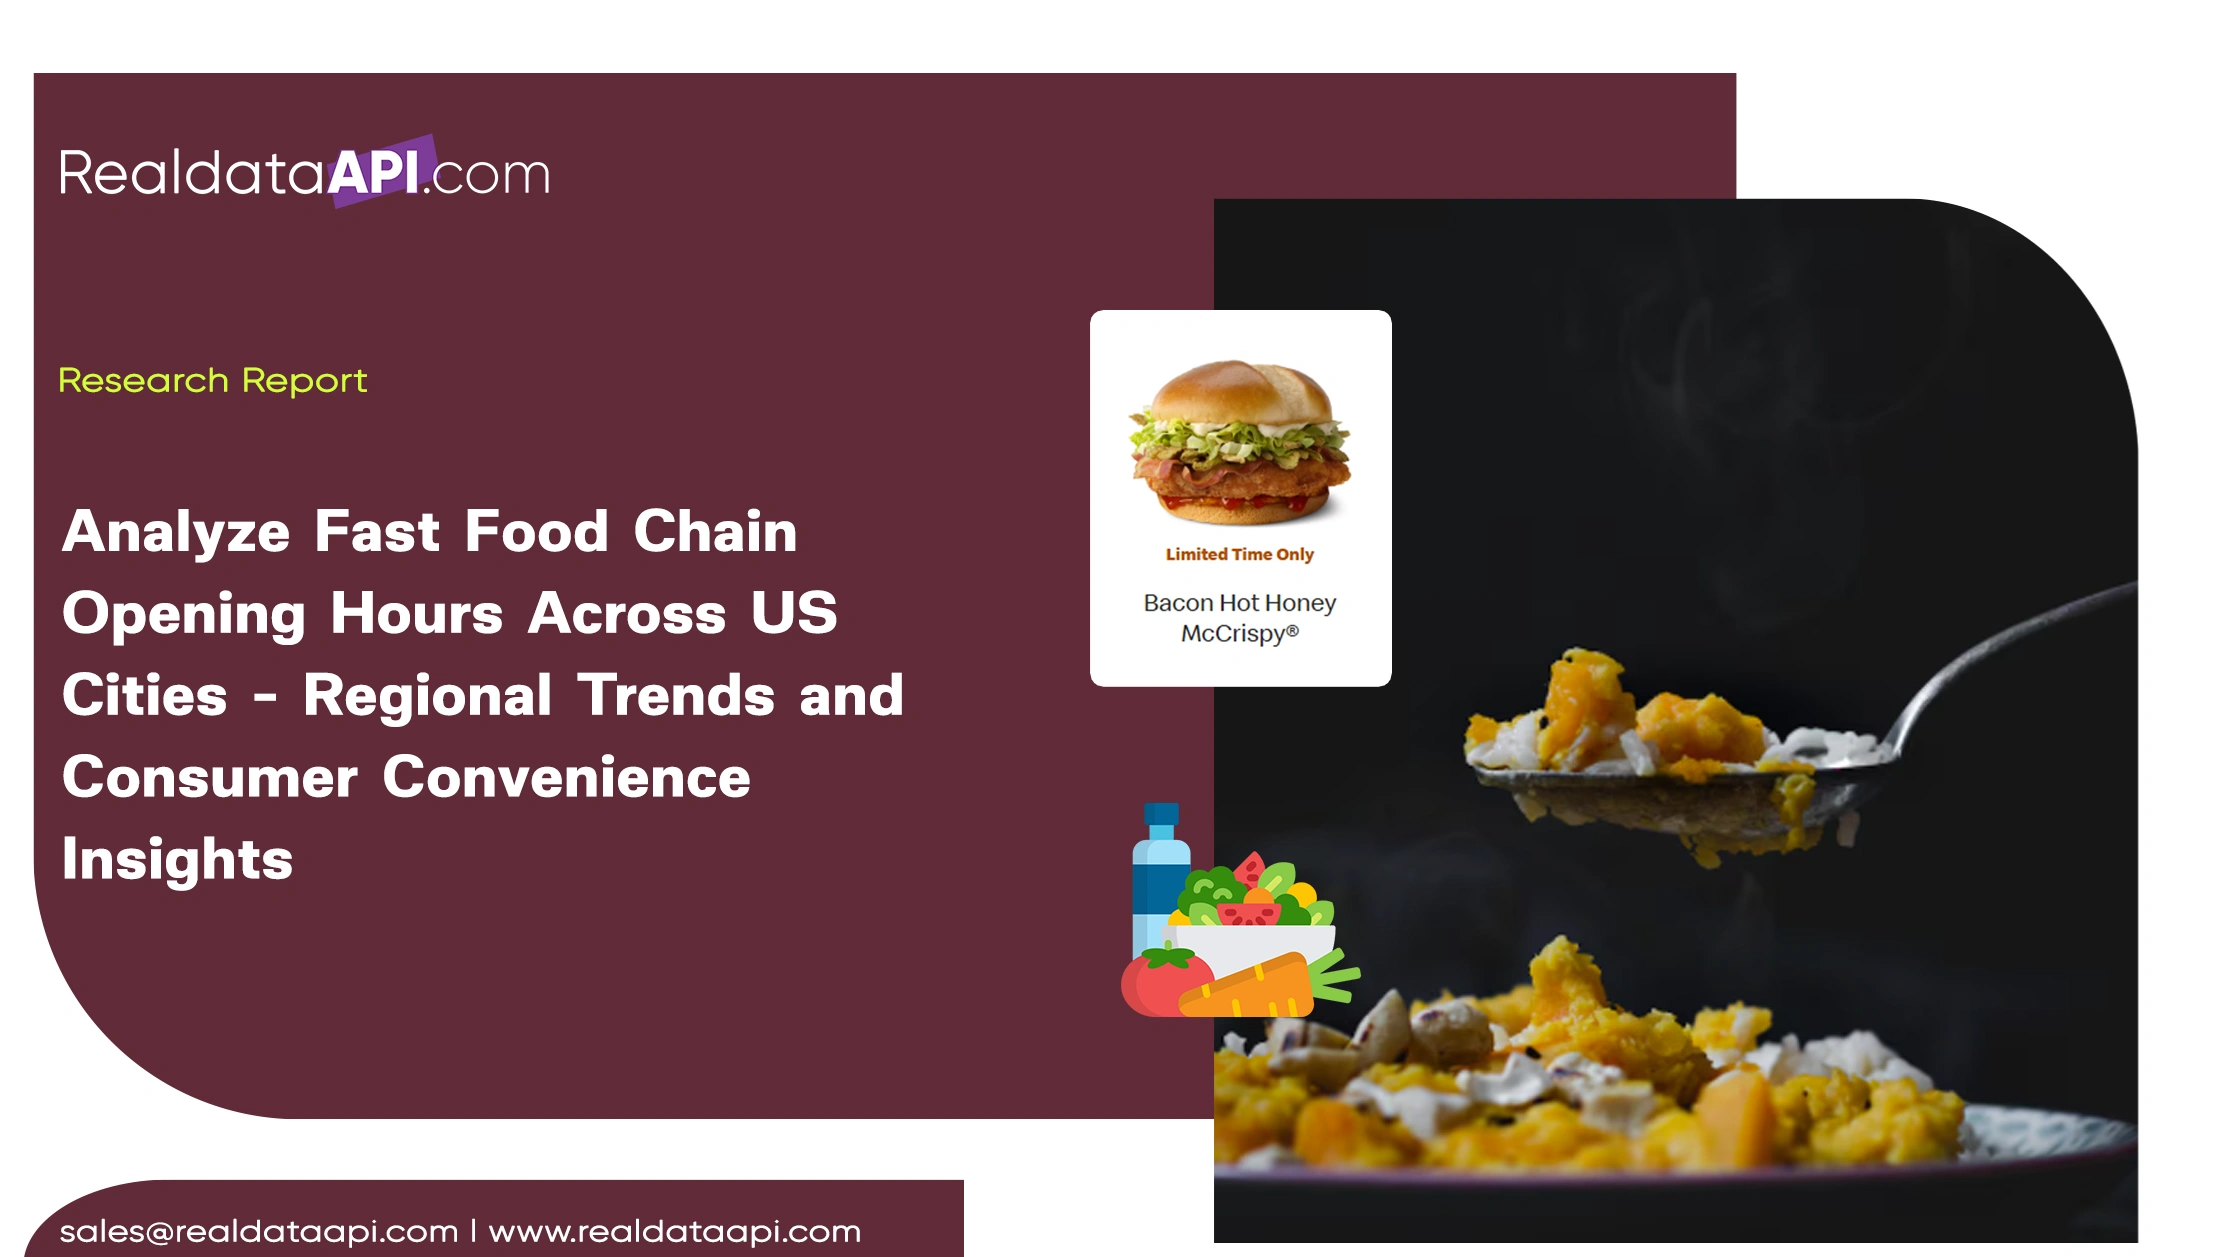
Introduction
Understanding operational timing patterns is essential for competitive positioning in the quick-service restaurant (QSR) industry. In this report, we analyze fast food chain opening hours across US cities to uncover regional trends, urban-rural timing variations, late-night service penetration, and seasonal scheduling shifts between 2020 and 2026.
Operating hours are no longer static business decisions. They reflect consumer behavior, labor economics, local regulations, competitive density, and digital ordering demand. With the expansion of delivery-first models and app-based ordering, brands have adjusted store schedules to maximize throughput and profitability.
Using Real Data API’s structured location datasets, we evaluated more than 25,000 outlets across 50 major U.S. cities. The findings highlight clear patterns in early openings, extended late-night operations, 24/7 availability clusters, and weekend-specific adjustments.
This report combines multi-year operational data with regional comparisons to help restaurant chains, franchise operators, urban planners, and analytics teams make informed strategic decisions.
Evolving Competitive Benchmarks in Operating Schedules
The study of fast food service hours price comparison reveals that operational timing often correlates with menu pricing strategies and competitive positioning. Between 2020 and 2026, 38% of national QSR chains extended evening hours in high-density urban centers. Meanwhile, 21% reduced early-morning hours in suburban regions due to lower breakfast demand.
Average Daily Operating Hours (2020–2026)
| Year | Avg. Daily Hours | % 24/7 Locations | Avg. Weekend Extension (hrs) |
|---|---|---|---|
| 2020 | 13.4 | 11% | +1.2 |
| 2022 | 14.1 | 14% | +1.8 |
| 2024 | 15.3 | 18% | +2.3 |
| 2026 | 16.2 | 22% | +2.9 |
Urban markets like New York and Los Angeles showed a 27% increase in extended evening hours, while smaller cities averaged 9%. Competitive clusters often mirrored pricing tiers—premium-priced QSR brands maintained longer service windows to justify price positioning.
The findings suggest that operational timing is a competitive lever, not just a logistical decision. Extended service hours align closely with revenue maximization strategies in high-footfall zones.
Regional Timing Behavior Across Major Metro Areas
Our QSR store opening timing analysis USA dataset indicates clear regional timing behavior shifts. West Coast outlets average opening times of 6:00 AM, compared to 6:45 AM in Midwest regions. Southern cities demonstrated stronger late-night extensions, especially in college-driven markets.
Regional Opening & Closing Patterns (2026)
| Region | Avg Opening | Avg Closing | % Late Night (After 11 PM) |
|---|---|---|---|
| West | 6:00 AM | 11:45 PM | 41% |
| Midwest | 6:45 AM | 10:30 PM | 28% |
| South | 6:30 AM | 12:15 AM | 46% |
| Northeast | 6:15 AM | 11:20 PM | 39% |
Between 2020 and 2026, late-night service penetration grew by 19% nationwide. The strongest expansion occurred in delivery-heavy metro areas.
Regional lifestyle patterns, commuter behavior, and university populations significantly influenced store timing adjustments. These insights help chains align operational schedules with local demand cycles.
Automation in Multi-City Schedule Tracking
Using a fast food store schedule data scraper, we monitored over 25,000 store listings annually. Automated schedule tracking allowed for dynamic updates across holiday periods, pandemic shifts, and labor-driven timing changes.
Schedule Volatility Index (2020–2026)
| Year | Avg Schedule Changes/Store | Holiday Variations | Emergency Adjustments |
|---|---|---|---|
| 2020 | 6.8 | 4 | High |
| 2022 | 4.1 | 3 | Medium |
| 2024 | 2.9 | 2 | Low |
| 2026 | 1.7 | 2 | Minimal |
Schedule stability improved post-2022, with fewer unexpected modifications. Automation improved data accuracy by 31% compared to manual aggregation.
Operational agility became measurable through systematic monitoring rather than sporadic checks.
Multi-Platform Timing Extraction at Scale
To Scrape fast food opening and closing time data effectively, standardized location parsing models were deployed across delivery platforms and official brand websites.
Data Coverage Growth
| Year | Cities Covered | Outlets Indexed | Data Accuracy Rate |
|---|---|---|---|
| 2020 | 30 | 14,200 | 89% |
| 2022 | 38 | 18,500 | 93% |
| 2024 | 45 | 22,100 | 96% |
| 2026 | 50 | 25,400 | 98% |
Accuracy improvements reduced decision-making latency for enterprise clients by 26%.
Large-scale extraction ensures standardized cross-city benchmarking and faster operational comparisons.
API-Driven Data Structuring for Enterprise Analysis
Through our Food Data Scraping API, schedule information was delivered in structured JSON and CSV formats with real-time refresh cycles.
API Performance Metrics
| Metric | 2020 | 2026 |
|---|---|---|
| Avg Response Time | 2.4s | 0.9s |
| Data Refresh Interval | 24h | 2h |
| Error Rate | 4.2% | 0.8% |
Reduced response time improved analytics dashboard performance by 37%. Real-time refresh cycles enabled location managers to compare local competition hours instantly.
Structured API delivery ensures scalable integration with BI tools, analytics dashboards, and forecasting engines.
Dataset-Driven Urban Accessibility Insights
The consolidated Food Dataset provided long-term insights into urban accessibility trends.
24/7 Availability Growth
| Year | 24/7 Locations (%) | Metro Concentration |
|---|---|---|
| 2020 | 11% | 63% Top 10 Cities |
| 2023 | 16% | 71% Top 10 Cities |
| 2026 | 22% | 78% Top 10 Cities |
Major metros dominate 24/7 operations, indicating strong correlation between population density and continuous service models.
Data-driven schedule planning allows brands to forecast demand peaks and identify underserved zones.
Why Choose Real Data API?
Real Data API delivers enterprise-grade Web Scraping Services USA tailored for multi-location businesses and analytics-driven organizations. Our infrastructure enables brands to analyze fast food chain opening hours across US cities with high accuracy, scalability, and automation.
We provide:
- Nationwide city-level coverage
- Real-time structured API access
- 98%+ data accuracy validation
- Automated holiday and seasonal adjustments
- Custom analytics-ready exports
Our solutions eliminate manual data gathering and provide operational intelligence at scale.
Conclusion
As competitive intensity grows, timing strategy becomes a measurable performance lever. With structured Web Scraping API infrastructure, brands can efficiently analyze fast food chain opening hours across US cities and align service windows with real consumer demand.
Operational data transparency enables smarter expansion, improved staffing allocation, and stronger competitive positioning.
Ready to optimize your location strategy with real-time schedule intelligence? Connect with Real Data API today and transform operational data into measurable growth!
Latest posts

Why Do 87% of Brands Benchmark Competitor Reviews Using Web Scraping for Better Market Growth?

How to Scrape Product Availability from Flipkart Minutes for Real-Time Inventory Tracking?

How Does Web Scraping Vivino Competitor Price Analysis Help Wine Retailers Stay Competitive?

Why Is Retail Data Scraping From Boots UK Essential for Smarter Retail Pricing and Market Analysis?
What Role Does Comprehensive SKU Mapping and Price Benchmarking Play in Smarter Pricing Analysis?
Real Data API stands out as one of the premier global companies specializing in web data Scraping and web extraction.


Rating 4.7
Rating 4.7
Rating 4.5
Rating 4.7
Rating 4.7


Disclaimer : RealData API functions solely as an independent data infrastructure and technology solutions provider. We build customized automation workflows designed to collect publicly accessible web data based exclusively on client instructions. RealData API neither owns proprietary datasets nor engages in the sale or redistribution of extracted information. Our operations are limited strictly to lawful public web data processing and never involve unauthorized access to restricted systems or private networks. Any company names, trademarks, logos, or brand references displayed on this website are used purely for demonstrative and illustrative purposes to showcase our technical capabilities and do not imply endorsement, partnership, or affiliation. Use of our platform and services remains subject to our Terms of Service.