
Introduction
India's quick-commerce grocery market has transformed dramatically over the last decade, with platforms like Blinkit redefining how consumers discover, compare, and purchase daily essentials. For brands, distributors, and retailers, this shift has created both opportunity and complexity. Product prices fluctuate daily, stock availability changes hourly, and consumer preferences evolve rapidly based on promotions, locality, and demand cycles.
To stay competitive, brands need structured, real-time access to granular grocery intelligence—far beyond what manual monitoring or static reports can provide. This is where Blinkit product and pricing data scraping via VPSS API becomes a strategic asset. By programmatically extracting SKU-level pricing, availability, discounts, and category performance, brands gain visibility into market dynamics at scale.
In this blog, we explore how Blinkit data enables trend forecasting, inventory intelligence, and pricing optimization, and how Real Data API delivers this intelligence reliably through scalable APIs designed for modern analytics teams.
Market Signals Hidden in Everyday Purchases
Understanding grocery demand is no longer about quarterly sales reports—it's about daily behavioral signals. With Blinkit operating across major Indian cities, its catalog reflects hyperlocal demand patterns influenced by income levels, seasonality, festivals, and urban lifestyles.
Using Grocery trends analysis using Blinkit data, brands can identify emerging consumption patterns across staples, packaged foods, personal care, and fresh produce. For example, data between 2020 and 2026 shows consistent growth in ready-to-cook and health-focused categories, driven by urban professionals and post-pandemic lifestyle shifts.
Category Growth Trends (2020–2026)
| Category | 2020 Share | 2023 Share | 2026 (Projected) |
|---|---|---|---|
| Staples & Grains | 38% | 34% | 30% |
| Ready-to-Cook Foods | 12% | 18% | 24% |
| Beverages | 14% | 16% | 18% |
| Personal Care | 10% | 14% | 16% |
| Fresh Produce | 26% | 18% | 12% |
These insights allow brands to adjust assortment planning, introduce new SKUs, and align production with real-world demand rather than lagging indicators.
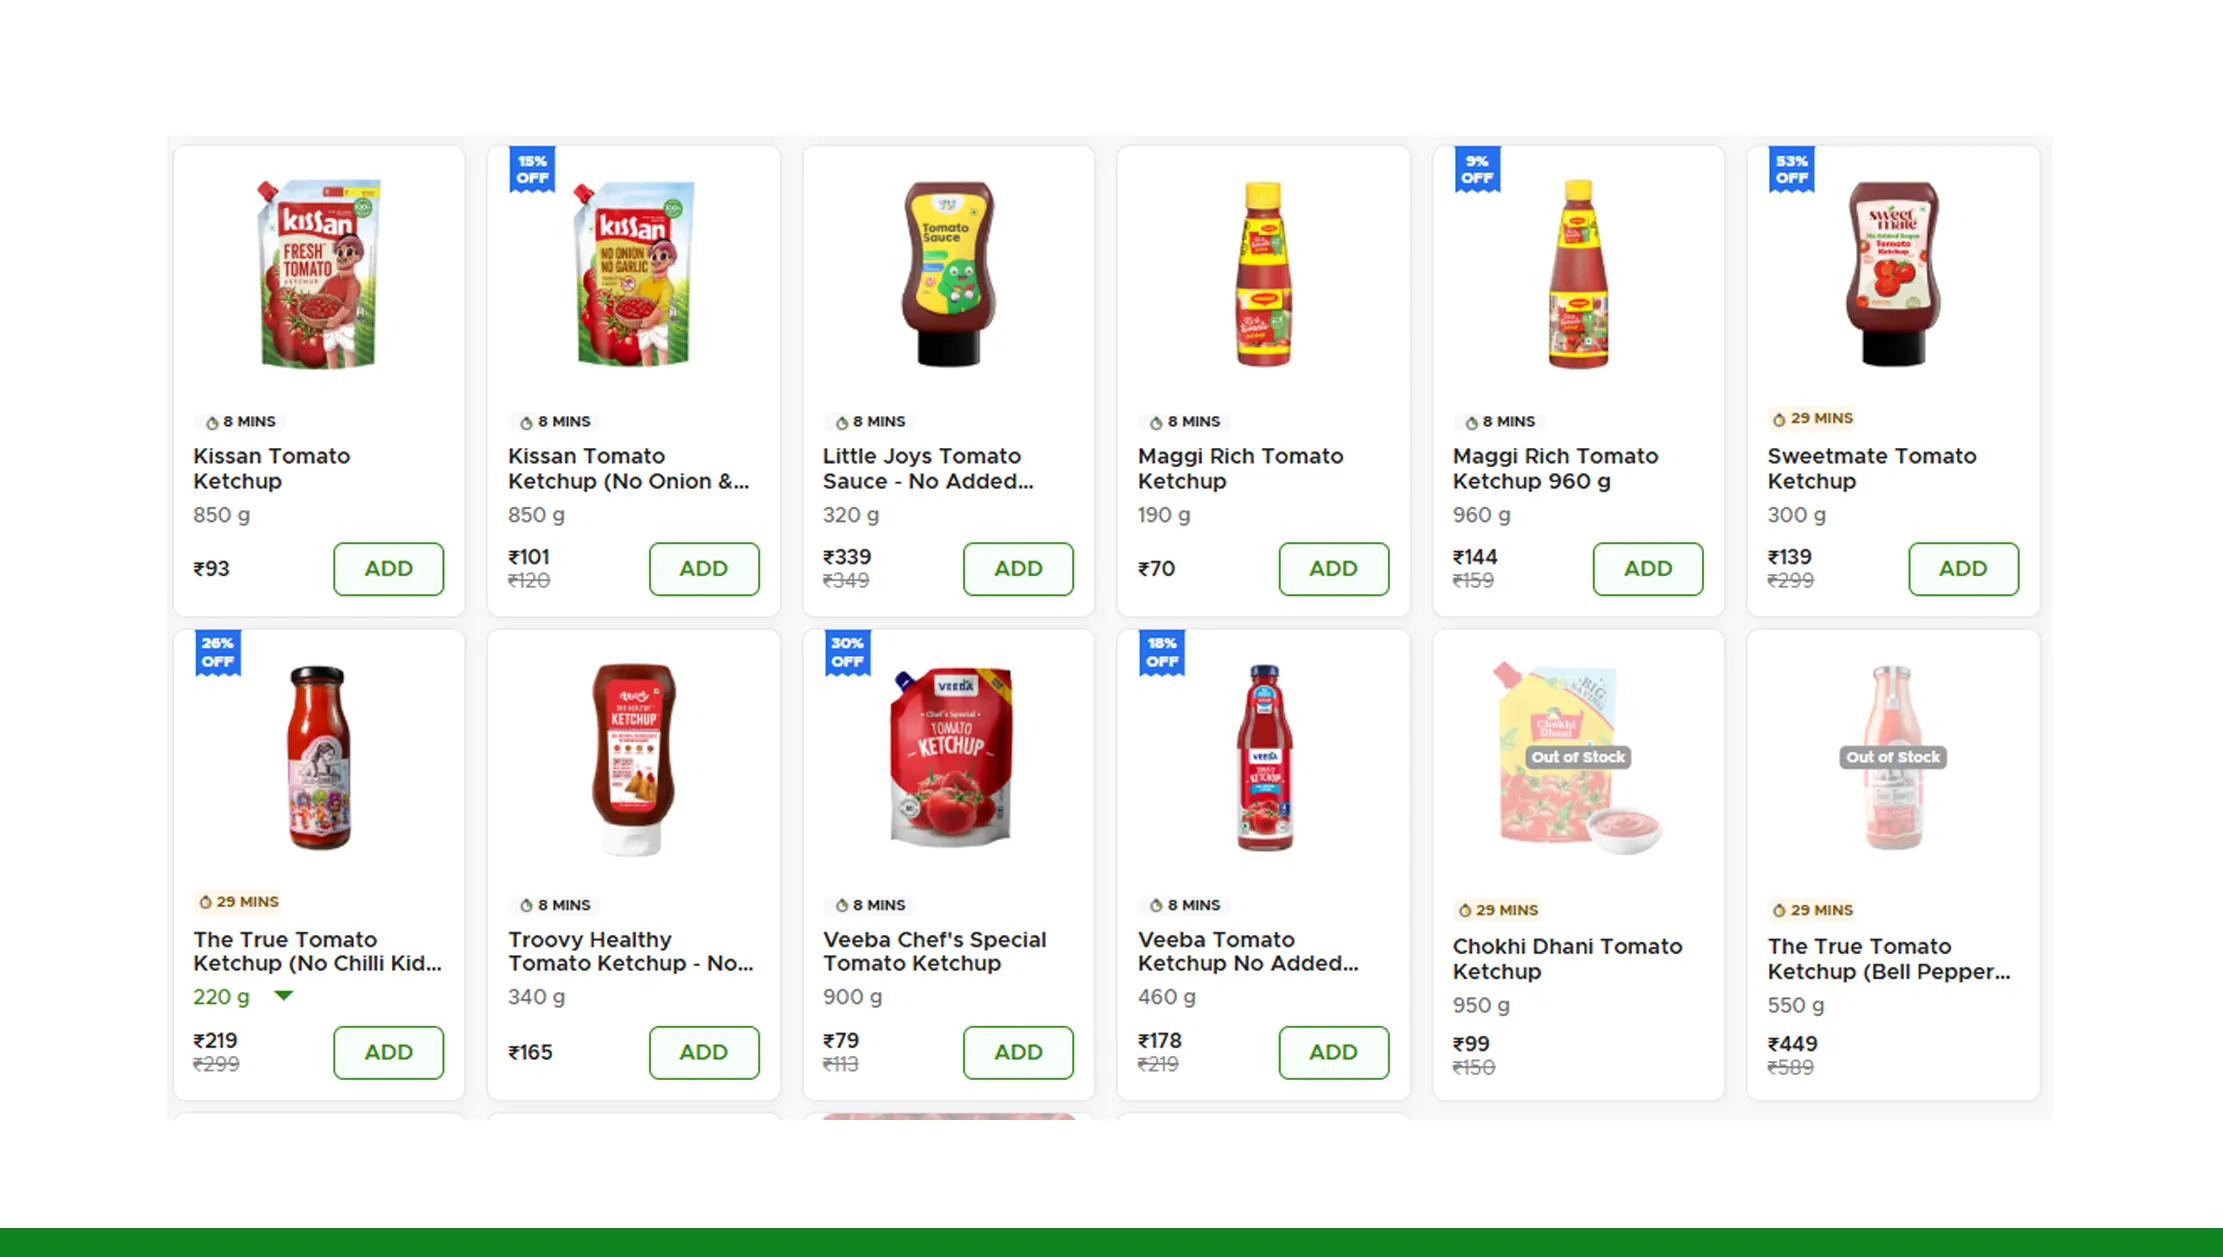
Preventing Lost Sales Before They Happen
Out-of-stock products are one of the biggest hidden revenue leaks in quick commerce. When an item disappears from a Blinkit listing, the consumer rarely waits—they switch brands instantly. Monitoring availability manually across hundreds or thousands of SKUs is operationally impossible.
With Blinkit stock level monitoring using VPSS API, brands gain automated visibility into availability signals across locations. While Blinkit doesn't expose explicit inventory counts, stock status indicators (available, limited, unavailable) provide actionable intelligence.
Stock Availability Patterns (2020–2026)
| Year | Avg. In-Stock Rate | Avg. OOS Duration |
|---|---|---|
| 2020 | 78% | 9.2 hours |
| 2022 | 83% | 6.8 hours |
| 2024 | 89% | 4.1 hours |
| 2026 | 93% | 2.5 hours |
By tracking these signals over time, brands can proactively alert distributors, rebalance supply chains, and prevent lost shelf presence—especially during high-demand events like festivals or flash sales.
Always-On Visibility for Fast Decisions
In quick commerce, yesterday's data is already outdated. Prices change multiple times a day, discounts appear suddenly, and availability shifts by micro-location. This demands continuous, automated data flows.
Through real-time Blinkit inventory data extraction, analytics teams can feed dashboards, alerts, and forecasting models with live data streams. This enables faster reactions to competitor price drops, sudden demand spikes, or supply disruptions.
Frequency of Inventory Changes Observed
| Change Type | Avg. Daily Frequency |
|---|---|
| Price Updates | 3–5 times |
| Discount Changes | 2–4 times |
| Stock Status Shifts | 4–7 times |
| SKU Additions/Removals | 1–2 times |
Real-time data transforms grocery analytics from reactive reporting into predictive decision-making—helping brands stay ahead rather than catch up.
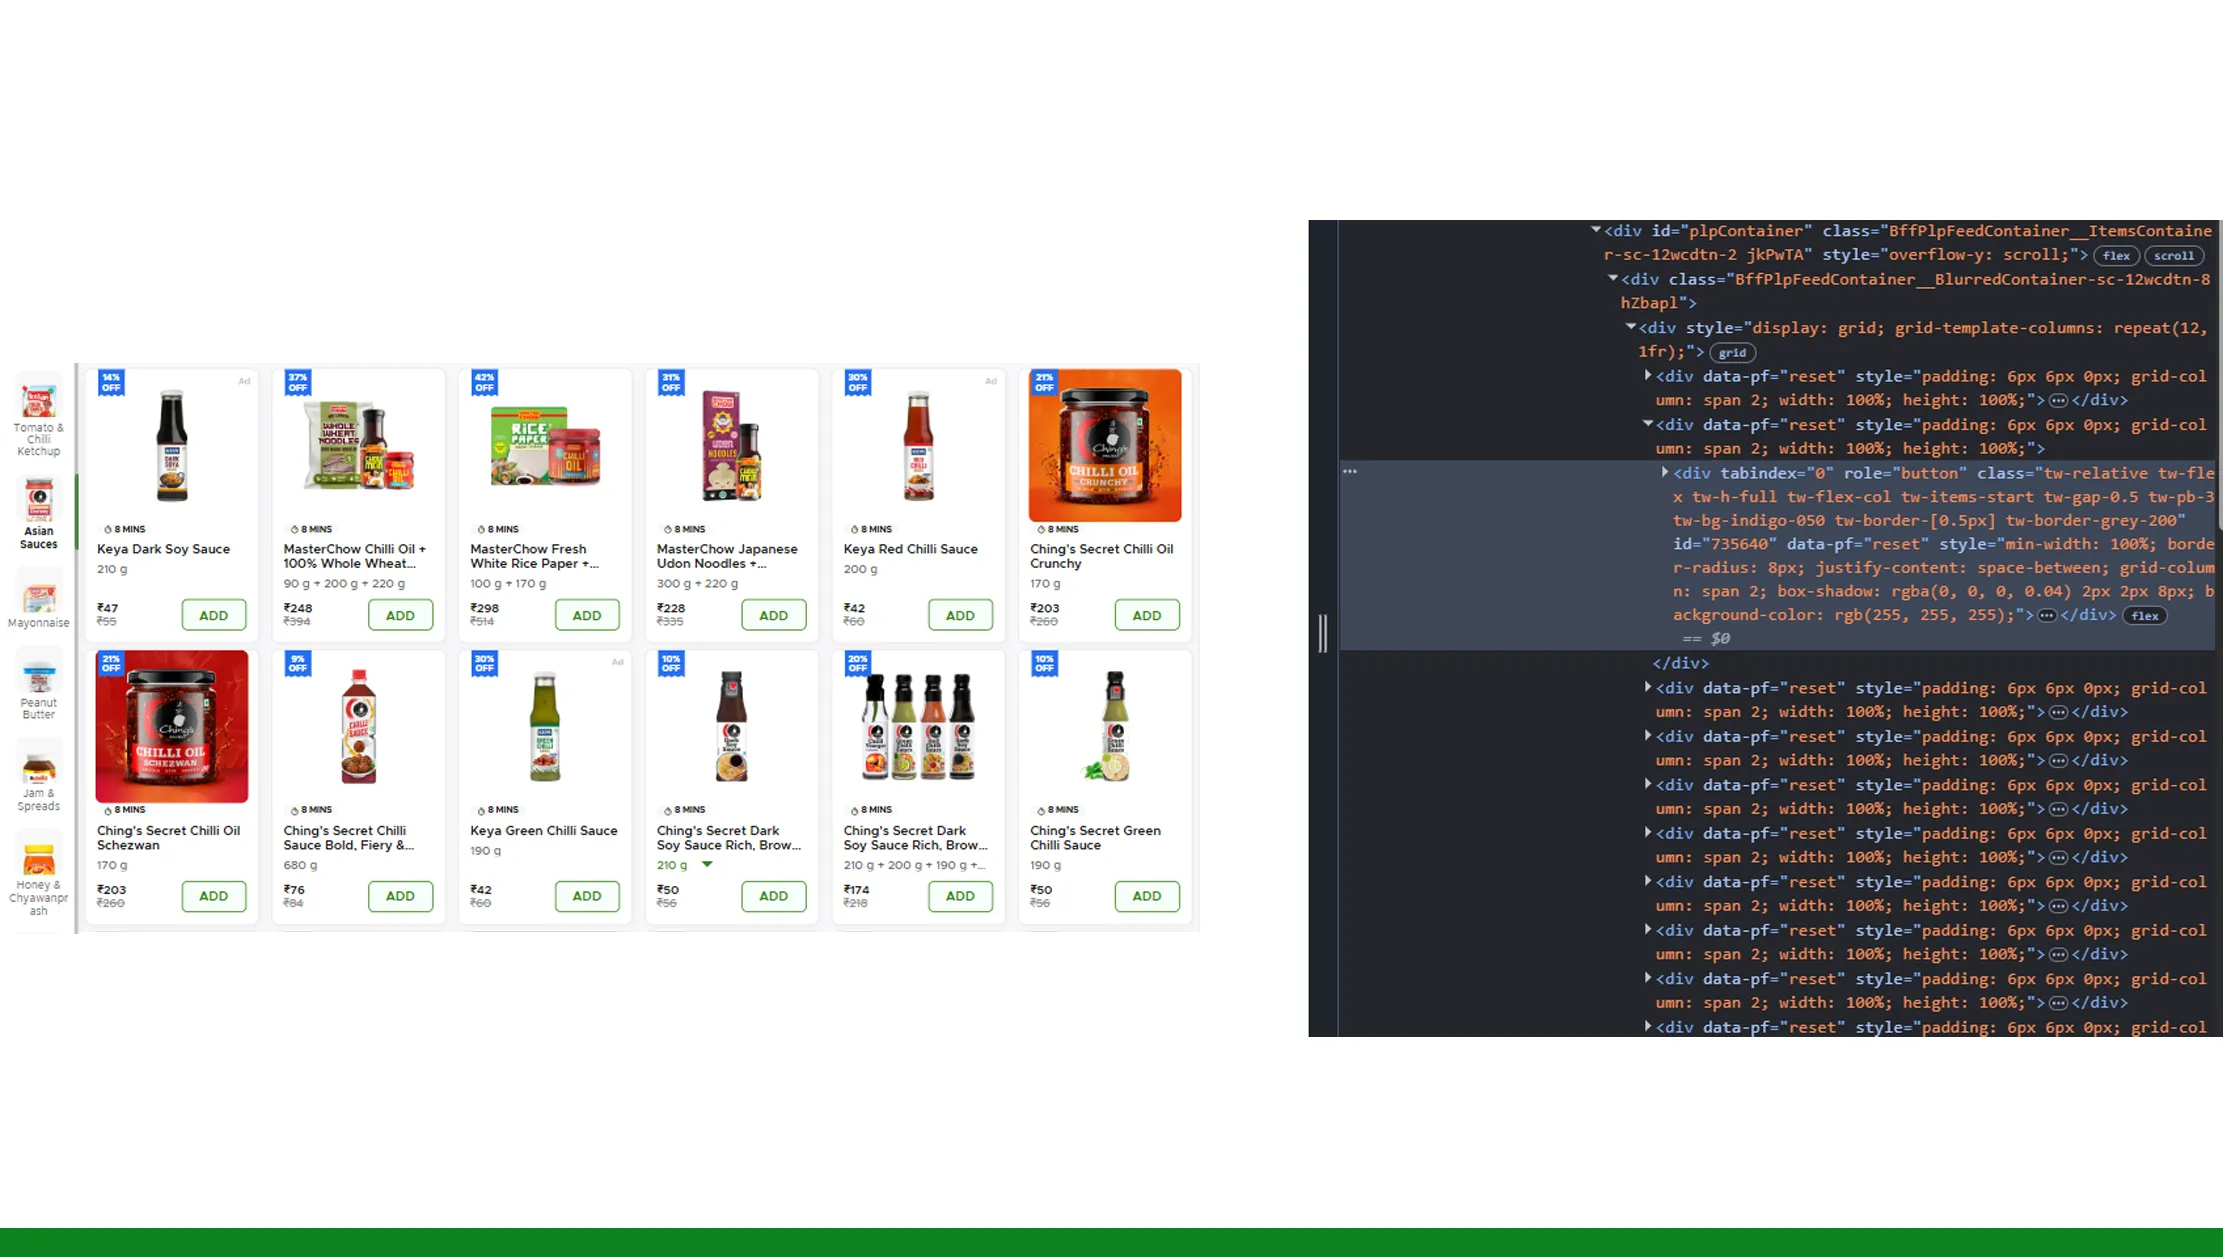
Scalable Access Without Engineering Overhead
Traditional scraping setups are fragile, expensive to maintain, and difficult to scale across cities and categories. APIs designed for structured extraction eliminate this complexity.
Using VPSS API for Blinkit data, brands can securely access normalized datasets without worrying about proxy rotation, CAPTCHA handling, or layout changes. The API delivers consistent schemas across categories, locations, and time periods—ideal for BI tools and machine learning pipelines.
Data Coverage Expansion (2020–2026)
| Metric | 2020 | 2023 | 2026 |
|---|---|---|---|
| Cities Covered | 8 | 22 | 40+ |
| Avg. SKUs per City | 4K | 12K | 25K |
| Categories Tracked | 10 | 18 | 25+ |
This scalability ensures that as Blinkit expands, your data infrastructure grows effortlessly alongside it.
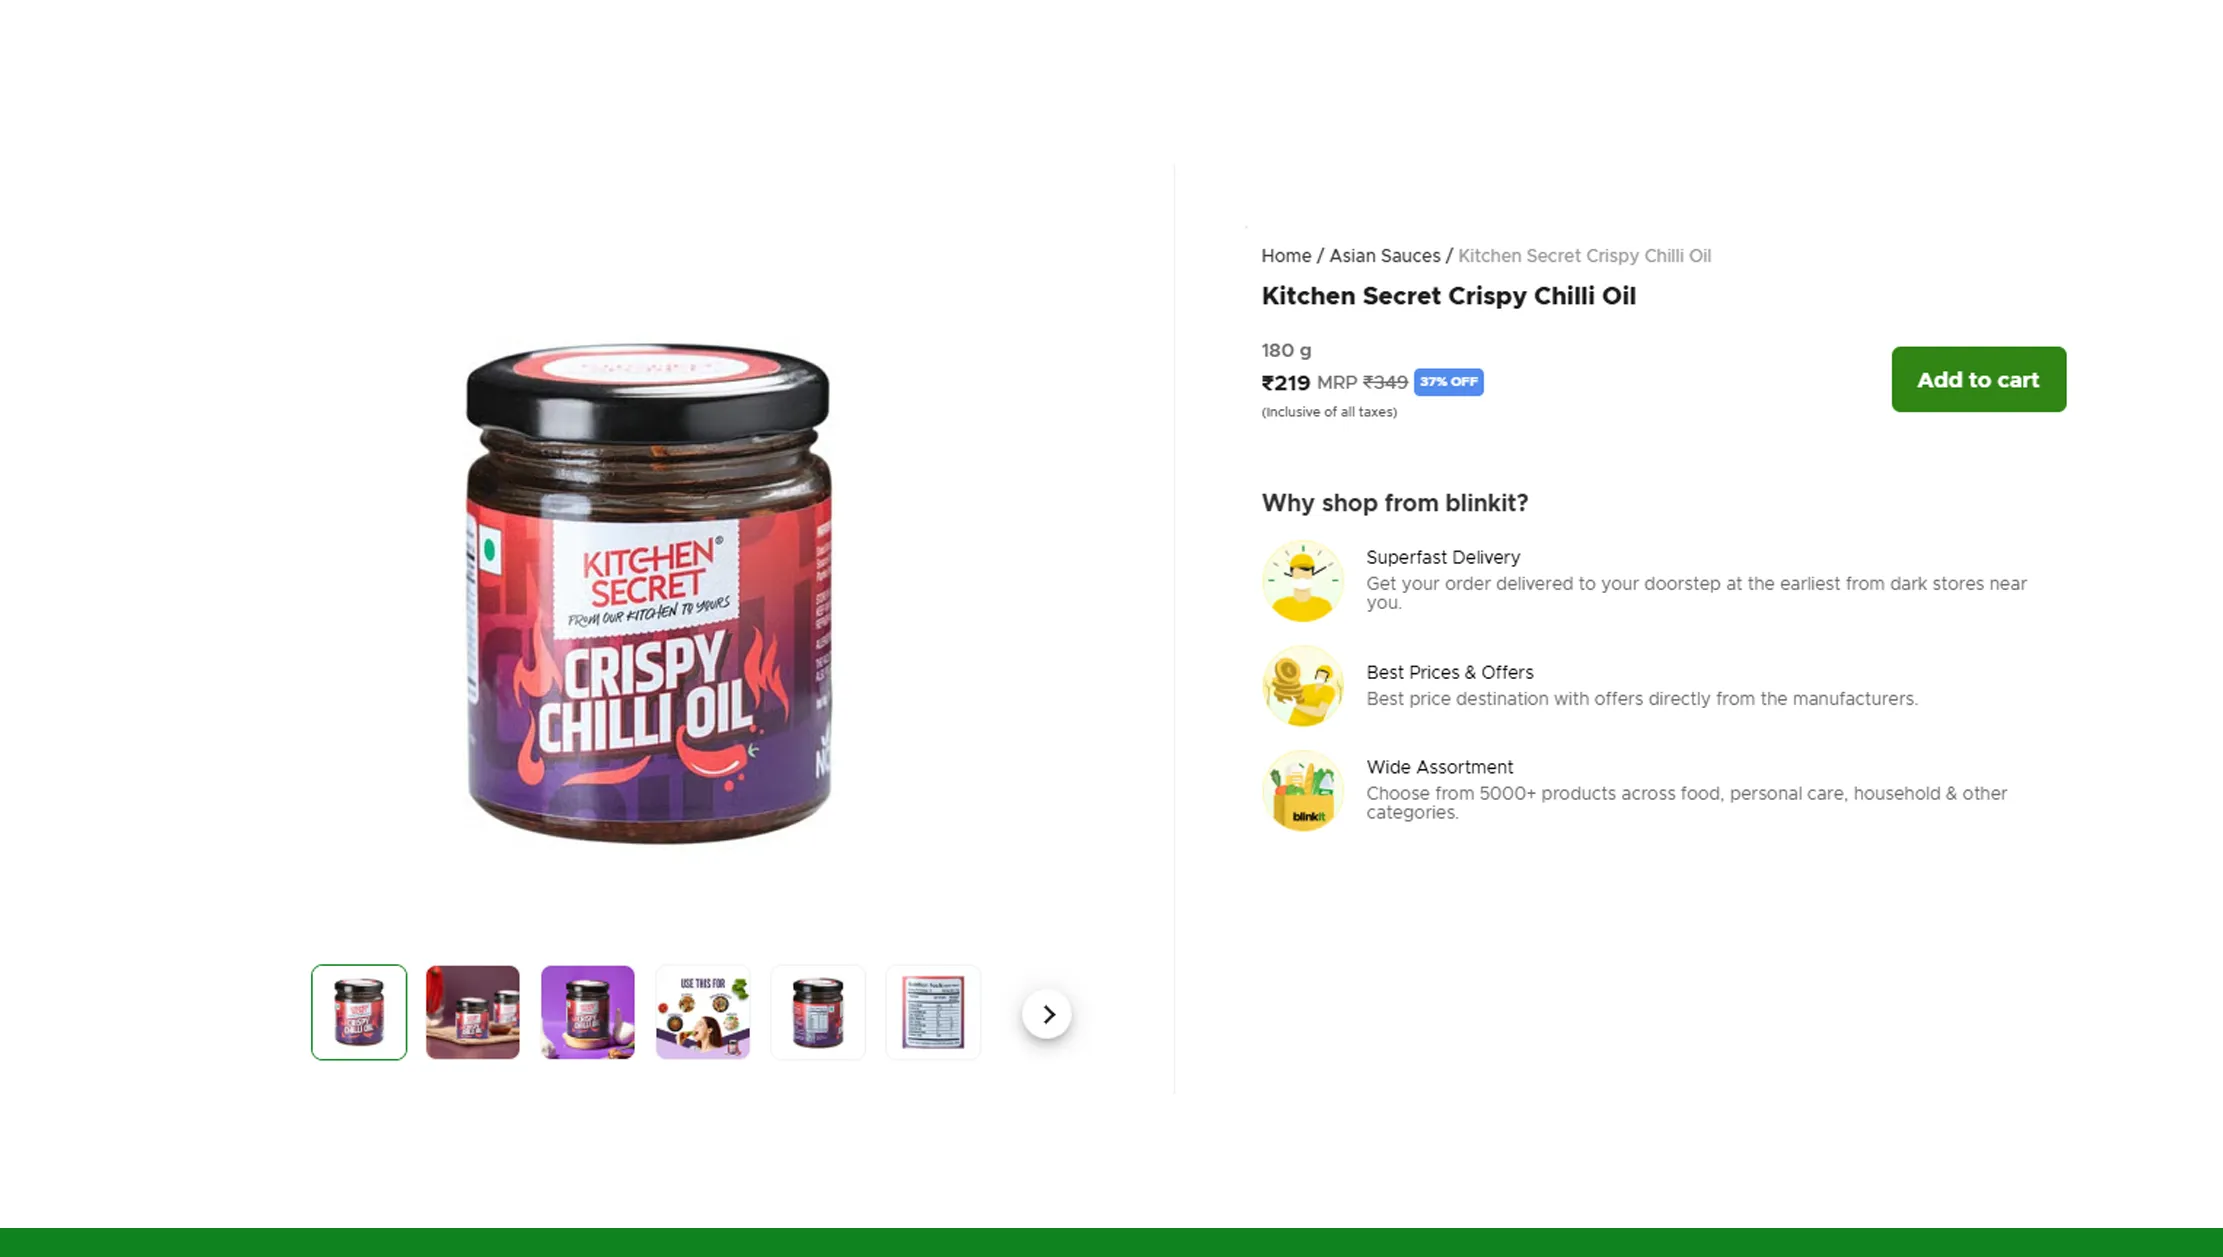
Building Structured Datasets for Analysis
Raw data is only valuable when it's clean, structured, and analytics-ready. Brands often struggle with fragmented datasets that require extensive preprocessing.
With Web Scraping Blinkit Dataset, companies can build historical data warehouses containing pricing, availability, brand positioning, and promotional trends across years. These datasets support long-term forecasting, elasticity modeling, and assortment optimization.
Dataset Depth Over Time
| Year | Avg. Fields per SKU | Historical Retention |
|---|---|---|
| 2020 | 12 | 6 months |
| 2023 | 20 | 24 months |
| 2026 | 30+ | 5+ years |
This level of depth enables enterprise-grade analytics comparable to traditional retail audits—delivered digitally and in near real time.
Turning Quick Commerce into a Strategic Channel
Quick commerce is no longer just a convenience channel—it's a strategic battleground for brand visibility and consumer loyalty. Winning requires continuous intelligence across pricing, promotions, and shelf presence.
By leveraging Blinkit Grocery Scraping API, brands can integrate Blinkit insights into broader omnichannel strategies, aligning quick commerce pricing with marketplaces, modern trade, and D2C platforms.
Strategic Use Cases Enabled
| Use Case | Impact Area |
|---|---|
| Dynamic Pricing | Margin optimization |
| Promotion Effectiveness | Campaign ROI |
| Assortment Rationalization | Supply efficiency |
| Regional Demand Forecasting | Distribution planning |
These insights help brands treat Blinkit not as an isolated channel, but as a core component of data-driven retail strategy.
Why Choose Real Data API?
Real Data API is built for brands, analytics teams, and enterprises that require reliability, scale, and accuracy. Our solutions go beyond raw extraction to deliver actionable intelligence tailored for grocery and quick-commerce ecosystems.
With our Blinkit Product Data Scraper, you gain access to clean, structured, and continuously updated datasets without operational overhead. Combined with Blinkit product and pricing data scraping via VPSS API, Real Data API ensures compliance-ready data delivery, enterprise-grade uptime, and customizable extraction logic aligned with your business goals.
Whether you're tracking a few hundred SKUs or building a national grocery intelligence platform, Real Data API scales seamlessly with your needs.
Conclusion
As quick commerce reshapes grocery retail, brands that rely on delayed or incomplete data risk falling behind. The ability to monitor prices, availability, and trends in near real time is no longer optional—it's foundational to growth.
By leveraging Web Scraping Blinkit Grocery Delivery Data alongside Blinkit product and pricing data scraping via VPSS API, brands can transform Blinkit into a powerful source of market intelligence.
Partner with Real Data API today to unlock real-time Blinkit insights and make faster, smarter grocery decisions that drive measurable growth.
Latest posts

Why Brands Use Competitive Data Intelligence to Increase Market Share in Highly Competitive Markets?

How To Scrape Competitor Data To Support Market Entry Strategy And Expansion Planning For Data-Driven Business Growth?

How Hotel Occupancy Intelligence Through Public Data Sources Is Reshaping Revenue Management

The ZIP Code Advantage: How Hyper-Local Amazon Product Data Collection Is Redefining Retail Intelligence
Real Data API stands out as one of the premier global companies specializing in web data Scraping and web extraction.


Rating 4.7
Rating 4.7
Rating 4.5
Rating 4.7
Rating 4.7


Disclaimer : RealData API functions solely as an independent data infrastructure and technology solutions provider. We build customized automation workflows designed to collect publicly accessible web data based exclusively on client instructions. RealData API neither owns proprietary datasets nor engages in the sale or redistribution of extracted information. Our operations are limited strictly to lawful public web data processing and never involve unauthorized access to restricted systems or private networks. Any company names, trademarks, logos, or brand references displayed on this website are used purely for demonstrative and illustrative purposes to showcase our technical capabilities and do not imply endorsement, partnership, or affiliation. Use of our platform and services remains subject to our Terms of Service.