

Introduction
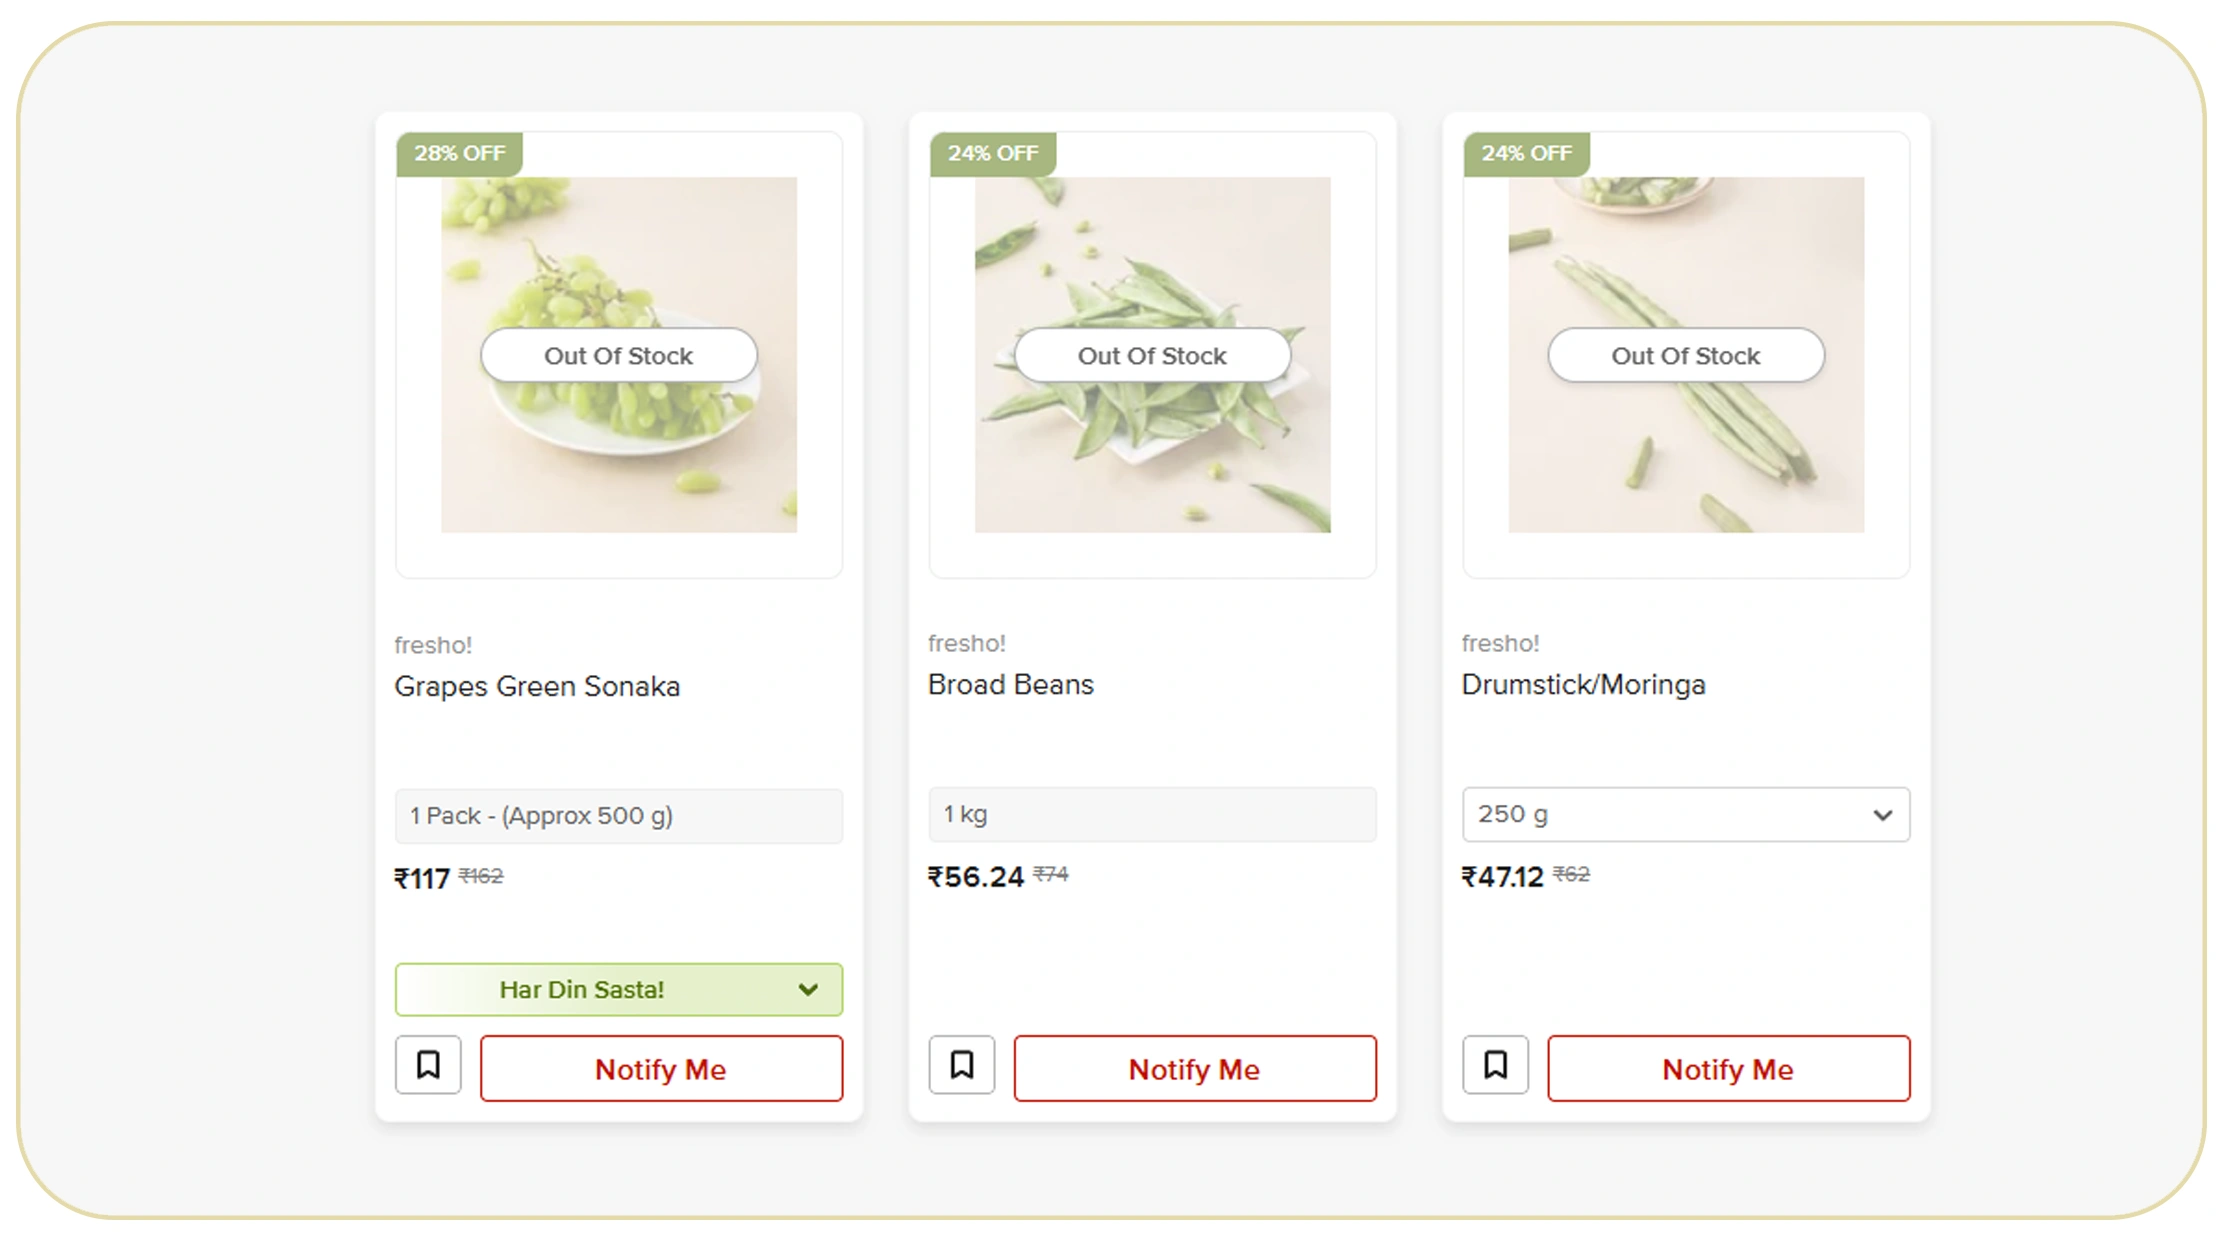
Quick commerce has transformed the retail landscape by promising deliveries within 10–30 minutes. While this model boosts convenience, it also increases operational complexity. Customers expect instant product availability, accurate stock visibility, and seamless checkout experiences. Even a brief stockout can lead to cart abandonment and platform switching. Research shows nearly 40% of quick commerce users shift to competitors when products are unavailable.
To stay competitive, businesses must scrape quick commerce product stock levels continuously across platforms. Real-time monitoring helps brands, aggregators, and retailers detect stock gaps, anticipate demand spikes, and respond proactively. Traditional reporting systems often lag behind real-time inventory movements, creating costly blind spots.
A powerful Quick Commerce Data Scraping API eliminates these gaps by delivering structured, live availability data from multiple platforms. Between 2020 and 2026, the global quick commerce market expanded rapidly, intensifying price wars and inventory volatility. In such an environment, large-scale stock tracking is no longer optional—it is essential for retaining customers, optimizing supply chains, and protecting revenue streams.
Measuring the Financial Impact of Stockouts
Stockouts directly affect conversion rates, brand loyalty, and long-term customer retention. From 2020 onward, the average SKU assortment across quick commerce platforms increased by more than 30%, making inventory management increasingly complex. High SKU counts increase the likelihood of supply-demand mismatches.
Through Extract quick commerce out-of-stock data analysis, businesses can identify recurring stock gaps and demand patterns. Leveraging insights from a structured Grocery Dataset, retailers gain clarity on:
- Frequently unavailable high-demand SKUs
- Seasonal product shortages
- Weekend and peak-hour stock depletion
- Warehouse-specific inventory imbalances
Stockout Trends (2020–2026)
| Year | Avg SKU Assortment | Stockout Rate | Customer Switching Rate |
|---|---|---|---|
| 2020 | 8,000 | 8% | 22% |
| 2022 | 11,500 | 11% | 28% |
| 2024 | 15,000 | 14% | 34% |
| 2026* | 19,000 | 17% | 40% |
As the table shows, increasing SKU complexity correlates with higher stockout rates. Companies that proactively analyze out-of-stock patterns can implement better replenishment models and reduce revenue leakage.
Real-Time Availability as a Competitive Advantage
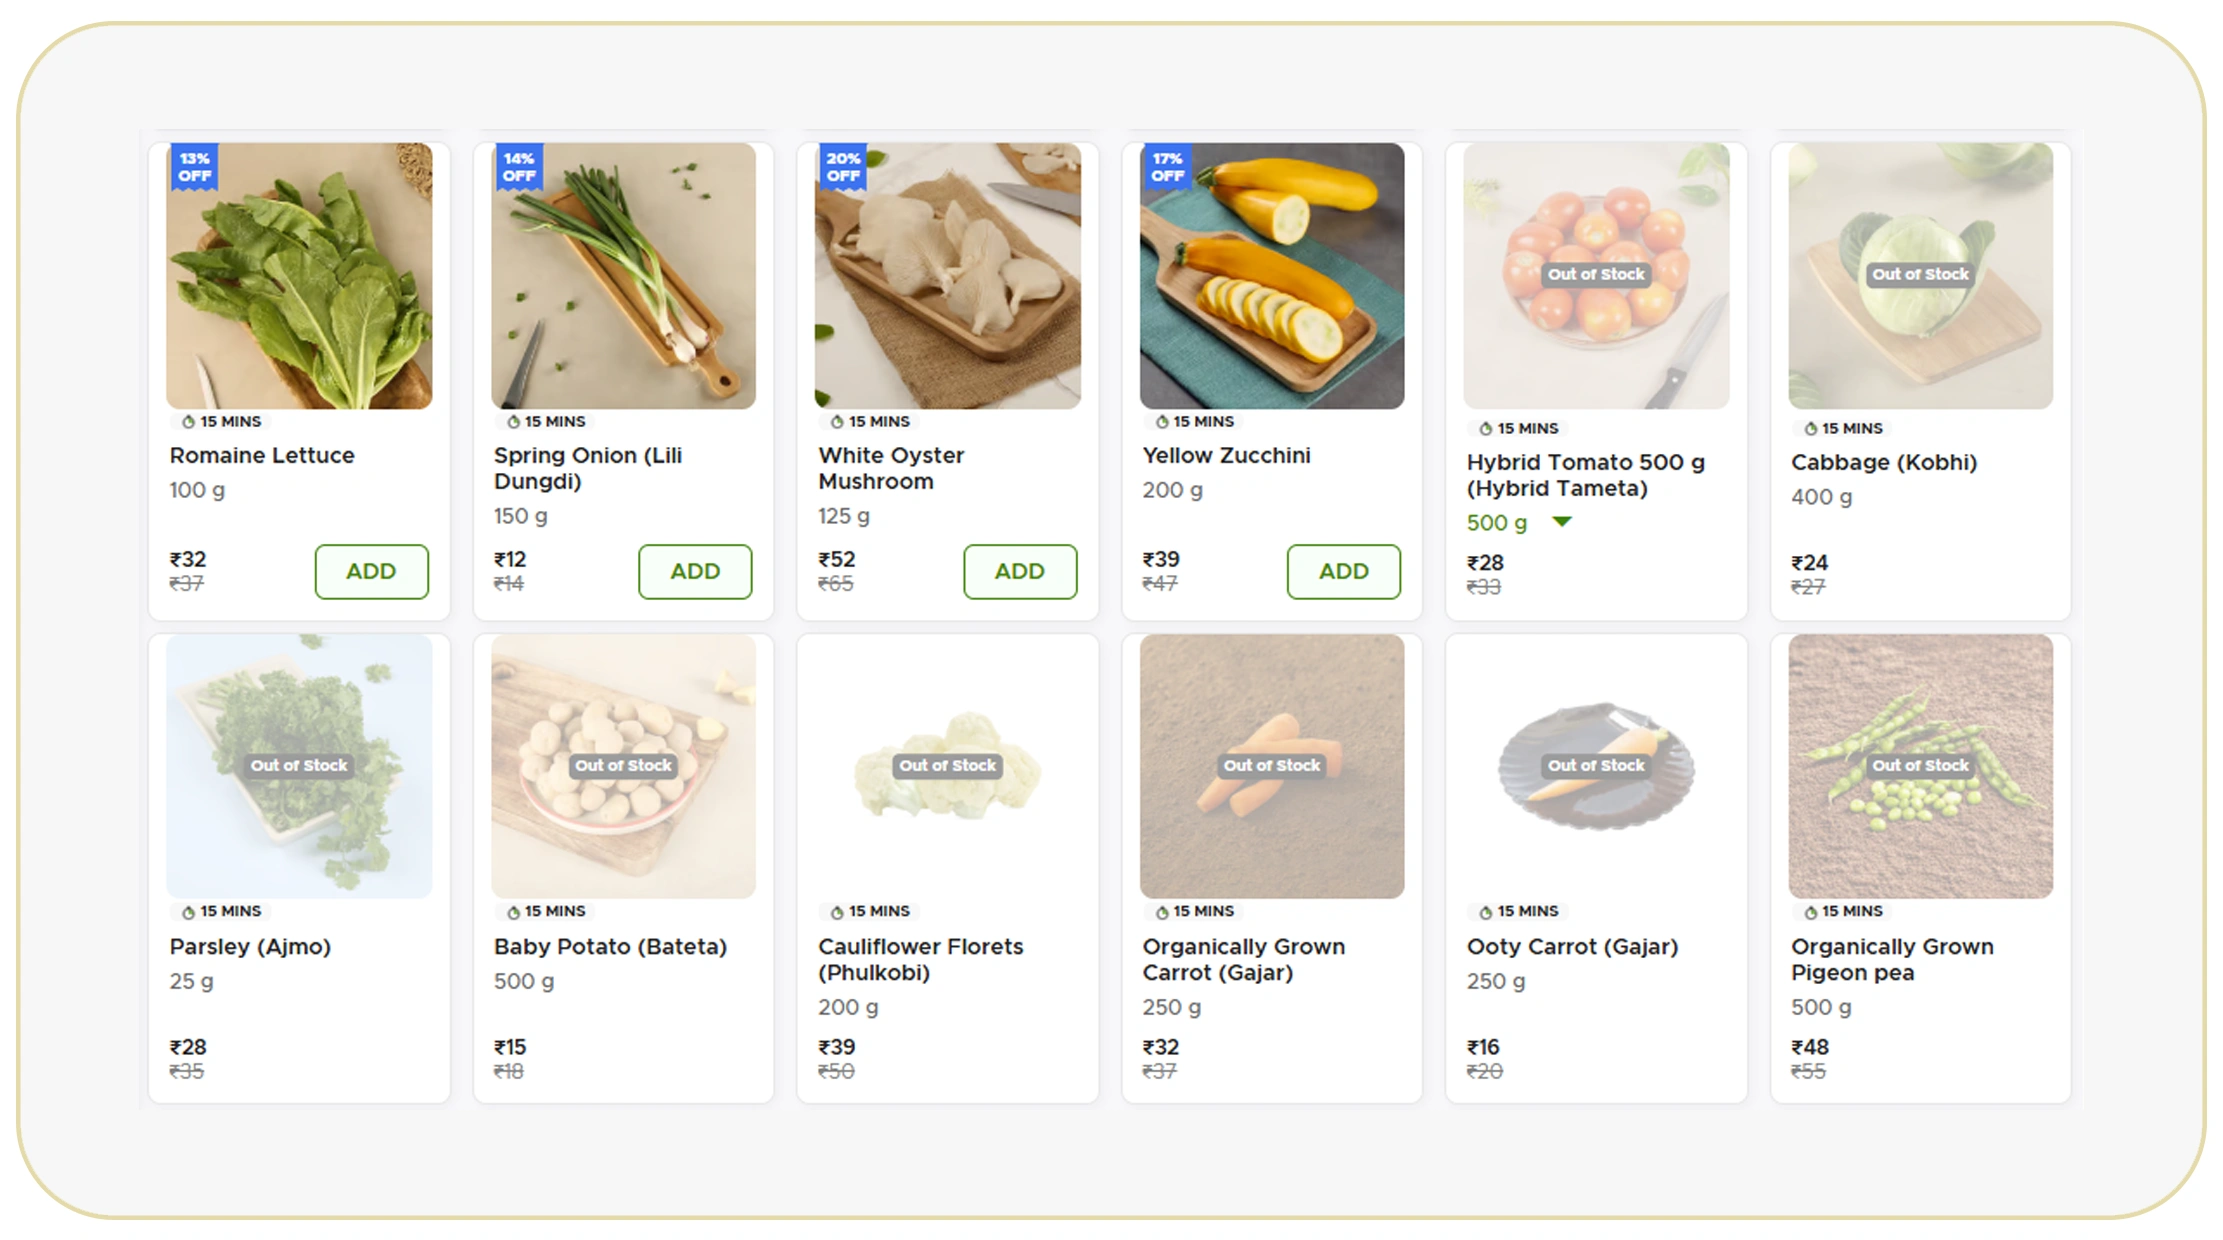
Quick commerce thrives on immediacy. Consumers rely on apps for urgent purchases such as groceries, medicines, and household essentials. If availability information is inaccurate, trust declines rapidly.
Access to real-time quick commerce product availability data allows businesses to maintain operational transparency. Between 2020 and 2026, adoption of real-time analytics in retail increased from 30% to nearly 75%, reflecting the urgency for instant decision-making.
Real-Time Inventory Monitoring Adoption
| Year | Retailers Using Real-Time Tools |
|---|---|
| 2020 | 30% |
| 2022 | 47% |
| 2024 | 62% |
| 2026* | 75% |
Real-time availability monitoring supports:
- Immediate restocking triggers
- Competitor stock gap identification
- Promotion optimization during rival shortages
- Reduced cart abandonment
Retailers equipped with live stock data outperform competitors who rely on delayed reporting systems.
Cross-App Inventory Visibility
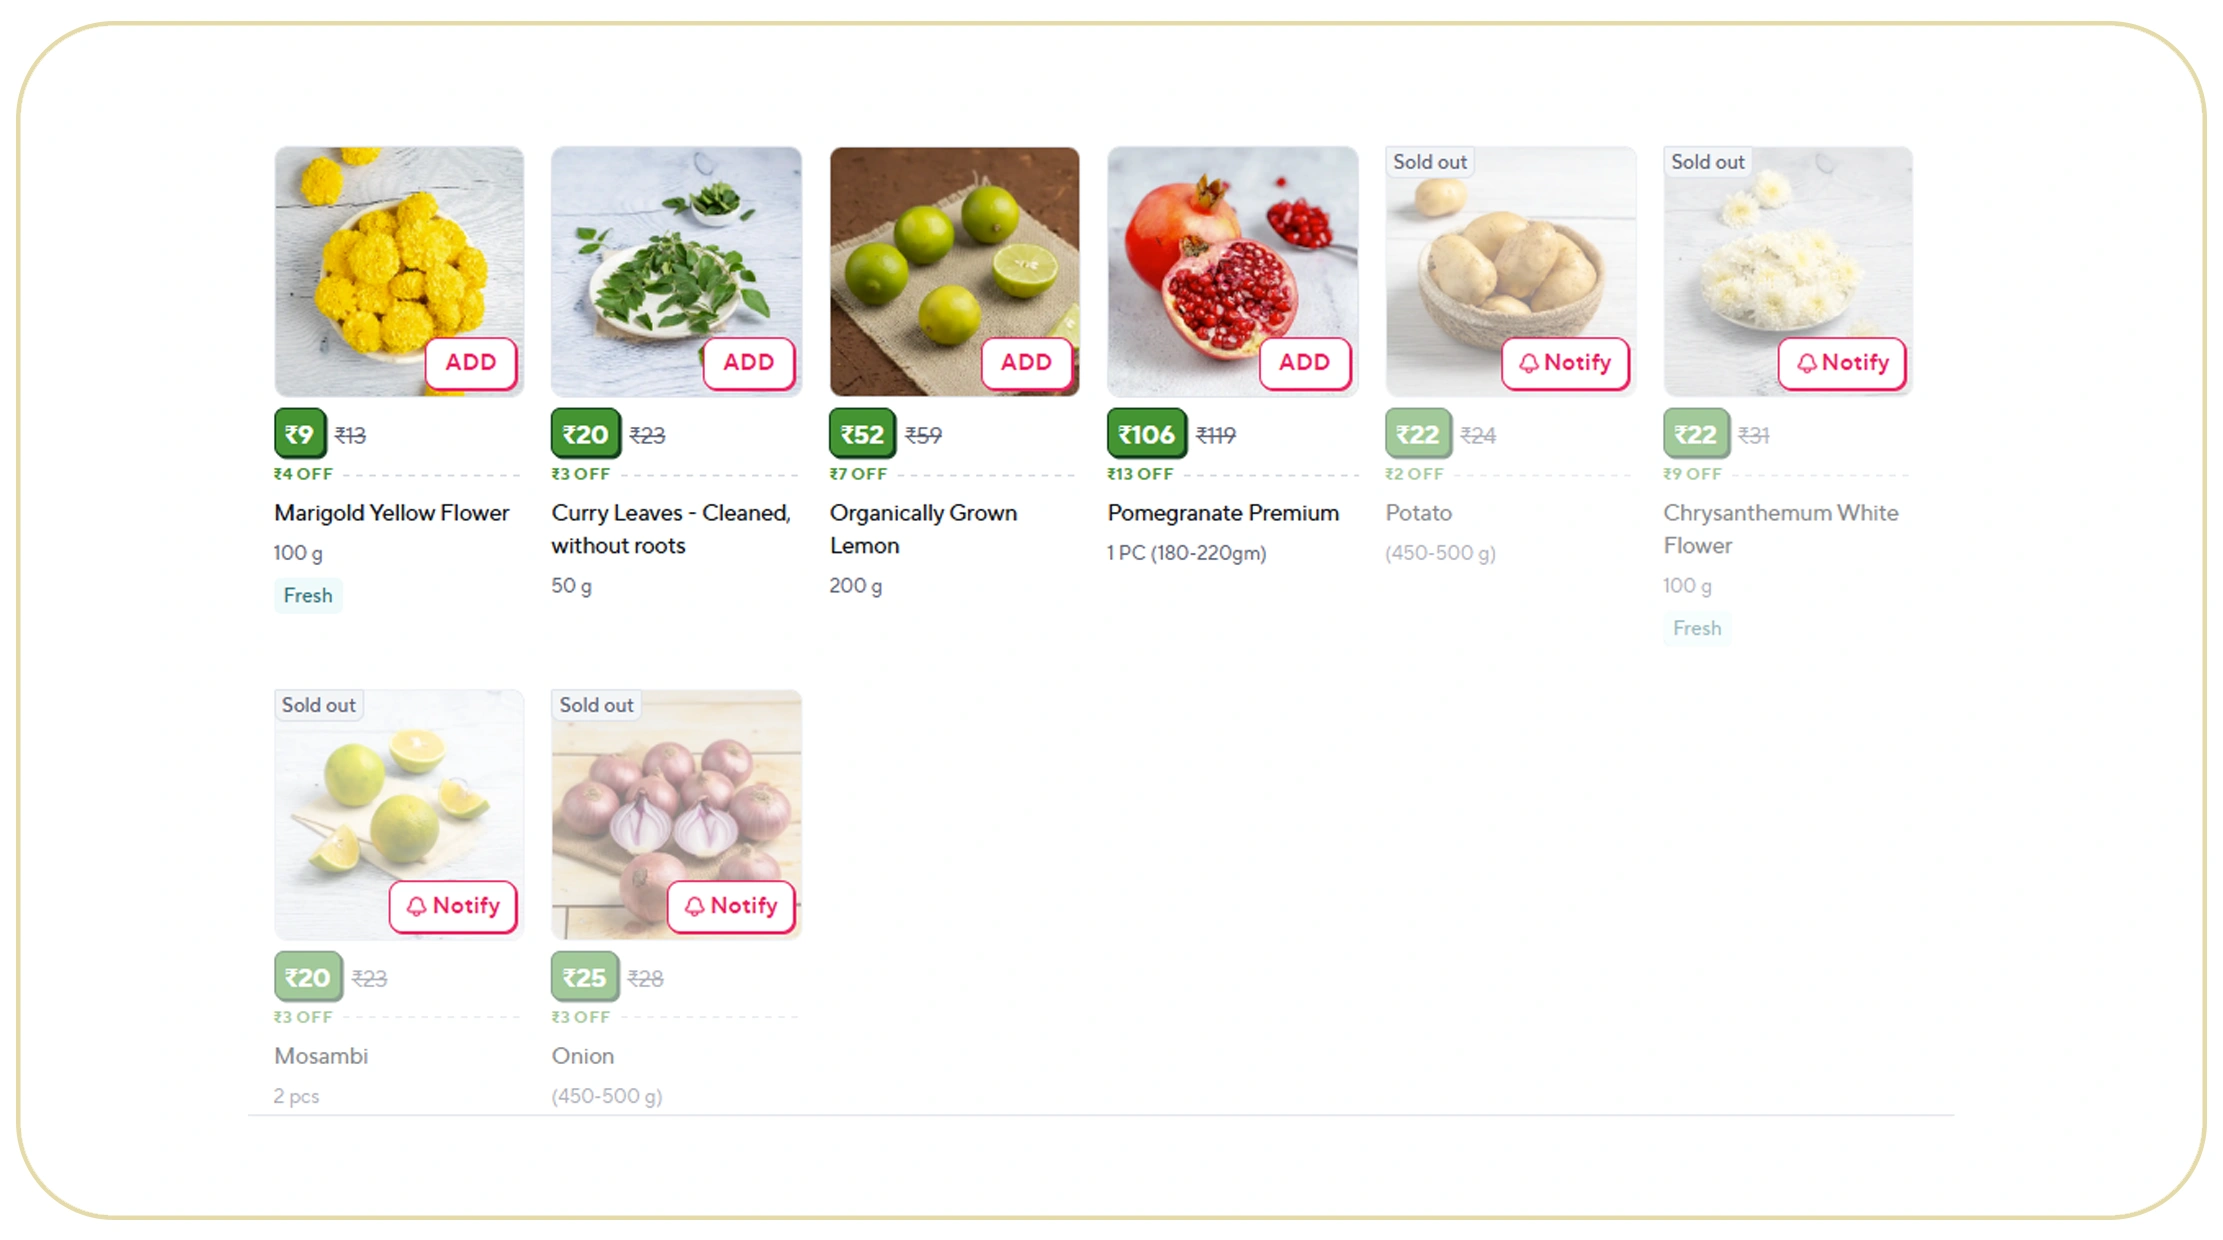
Consumers frequently switch between multiple quick commerce apps to compare availability and prices. Businesses must monitor inventory across platforms simultaneously.
Using Web Scraping inventory availability data across major quick commerce apps, brands centralize multi-platform insights into unified dashboards. For example, structured insights from the Web Scraping Zepto Dataset enable SKU-level comparisons across cities and warehouses.
Consumer Multi-App Usage (2020–2026)
| Year | Avg Apps Used per Consumer |
|---|---|
| 2020 | 1.4 |
| 2022 | 2.1 |
| 2024 | 2.9 |
| 2026* | 3.7 |
As consumer behavior shifts toward multi-app usage, cross-platform stock tracking becomes crucial. Businesses that lack centralized intelligence risk missing competitive pricing and availability opportunities.
Hyperlocal Inventory Optimization

Quick commerce depends heavily on dark stores and hyperlocal fulfillment centers. While this enables fast deliveries, it also increases inventory fragmentation.
Through Zepto product availability scraping, companies gain location-specific insights from Zepto. Hyperlocal analysis highlights:
- Area-specific demand spikes
- Warehouse-level stock inconsistencies
- Regional purchasing trends
- Delivery zone performance
Dark Store Expansion (India)
| Year | Estimated Dark Stores |
|---|---|
| 2020 | 150 |
| 2022 | 420 |
| 2024 | 780 |
| 2026* | 1,250 |
Granular monitoring ensures that fast-moving SKUs remain adequately stocked in high-demand zones. This reduces delivery delays and enhances customer satisfaction.
Benchmarking Against Competitors
Inventory stability is a direct indicator of operational strength. By choosing to Scrape Blinkit inventory data, brands can compare stock reliability against competitors such as Blinkit.
Competitor Stock Stability Index
| Year | Avg Stability (%) |
|---|---|
| 2020 | 86% |
| 2022 | 82% |
| 2024 | 77% |
| 2026* | 72% |
Declining stability indicates increasing complexity and demand pressure. By monitoring competitor stock gaps, businesses can strategically adjust promotions, increase ad spending during rival shortages, and capture additional market share.
Unified Global Intelligence
Quick commerce leaders such as Instamart and Gopuff operate across diverse markets with varying demand patterns.
By choosing to Extract Instamart product availability data alongside insights powered by the GoPuff Quick Commerce Scraping API, companies achieve unified cross-platform intelligence.
Global Market Growth (2020–2026)
| Year | Market Size (USD Billion) |
|---|---|
| 2020 | 25 |
| 2022 | 48 |
| 2024 | 75 |
| 2026* | 110 |
Centralized intelligence enables predictive forecasting, automated alerts, and dynamic inventory balancing across multiple regions and platforms.
Why Choose Real Data API?
Real Data API delivers enterprise-grade quick commerce intelligence tailored for brands, retailers, and analytics providers. Our solutions are built for scalability, reliability, and high-frequency updates.
We provide:
- Accurate Gopuff stock monitoring data
- Structured multi-platform dashboards
- Automated refresh cycles
- API-ready structured outputs
With our advanced infrastructure, businesses can confidently scrape quick commerce product stock levels at scale. We ensure clean, reliable datasets that integrate seamlessly with BI tools and decision-making systems.
Our expertise spans multiple platforms, enabling brands to gain a 360-degree view of inventory performance without operational complexity.
Conclusion
Stockouts are silent revenue killers in quick commerce. As consumer expectations for instant delivery rise, even minor availability gaps can cause significant customer churn. Businesses must adopt real-time monitoring to stay competitive.
By integrating intelligence tools such as Getir product price scraping with the ability to scrape quick commerce product stock levels, organizations eliminate blind spots, enhance demand forecasting, and improve replenishment strategies.
Real Data API empowers companies to transform fragmented inventory data into actionable, real-time insights.
Ready to eliminate stockouts and maximize quick commerce growth? Contact Real Data API today to unlock scalable, real-time inventory intelligence solutions!
Latest posts
Build on-demand delivery solutions with the Snoonu API - A Complete Guide for Modern Businesses

How Valorant and Lotto Games Betting Odds Data Collection Helps Access Betting Data Statistics Via Legal Bypass Methods Like VPN Services
How to Automate Data Collection from MyGate API for Smarter Property Management Analytics
Scrape iFood Restaurant Menus and Prices via API to Power Smarter Restaurant Analytics and Pricing Insights