
Introduction
The global skincare market is projected to surpass $190 billion by 2026, with dermatologist-recommended brands like CeraVe and Cetaphil dominating pharmacy and eCommerce shelves. As inflation, ingredient innovation, and retail competition intensify, pricing transparency has become a decisive factor in consumer purchasing behavior.
The ongoing CeraVe vs Cetaphil skincare market price comparison wars highlight how even minor price shifts, discount cycles, and formulation differences influence brand preference. With structured access to tools like the Cetaphil API, brands, retailers, and analytics firms can monitor real-time price movements, ingredient positioning, and availability across marketplaces.
This blog explores competitive pricing trends from 2020–2026, ingredient differentiation, discount strategies, and how Real Data API empowers businesses with actionable intelligence for smarter decision-making.
The Expanding Dermatological Skincare Economy
Between 2020 and 2026, pharmacy-led skincare brands experienced steady growth driven by consumer demand for ingredient transparency and dermatologist-backed formulations.
| Year | Global Skincare Market ($B) | Dermatology Segment Share % |
|---|---|---|
| 2020 | 145 | 28% |
| 2022 | 162 | 31% |
| 2024 | 178 | 33% |
| 2026 | 190+ | 35% |
CeraVe and Cetaphil expanded aggressively across Amazon, Walmart, Target, and pharmacy chains. Consumers increasingly compare price-per-ounce, ingredient composition, and promotional offers before purchase.
Retail competition intensified during inflation spikes (2021–2023), pushing brands to adjust pricing tiers strategically. This created visible pricing gaps across online and offline channels—fueling the competitive dynamics observed today.
Retail Pricing Trends and Discount Battles
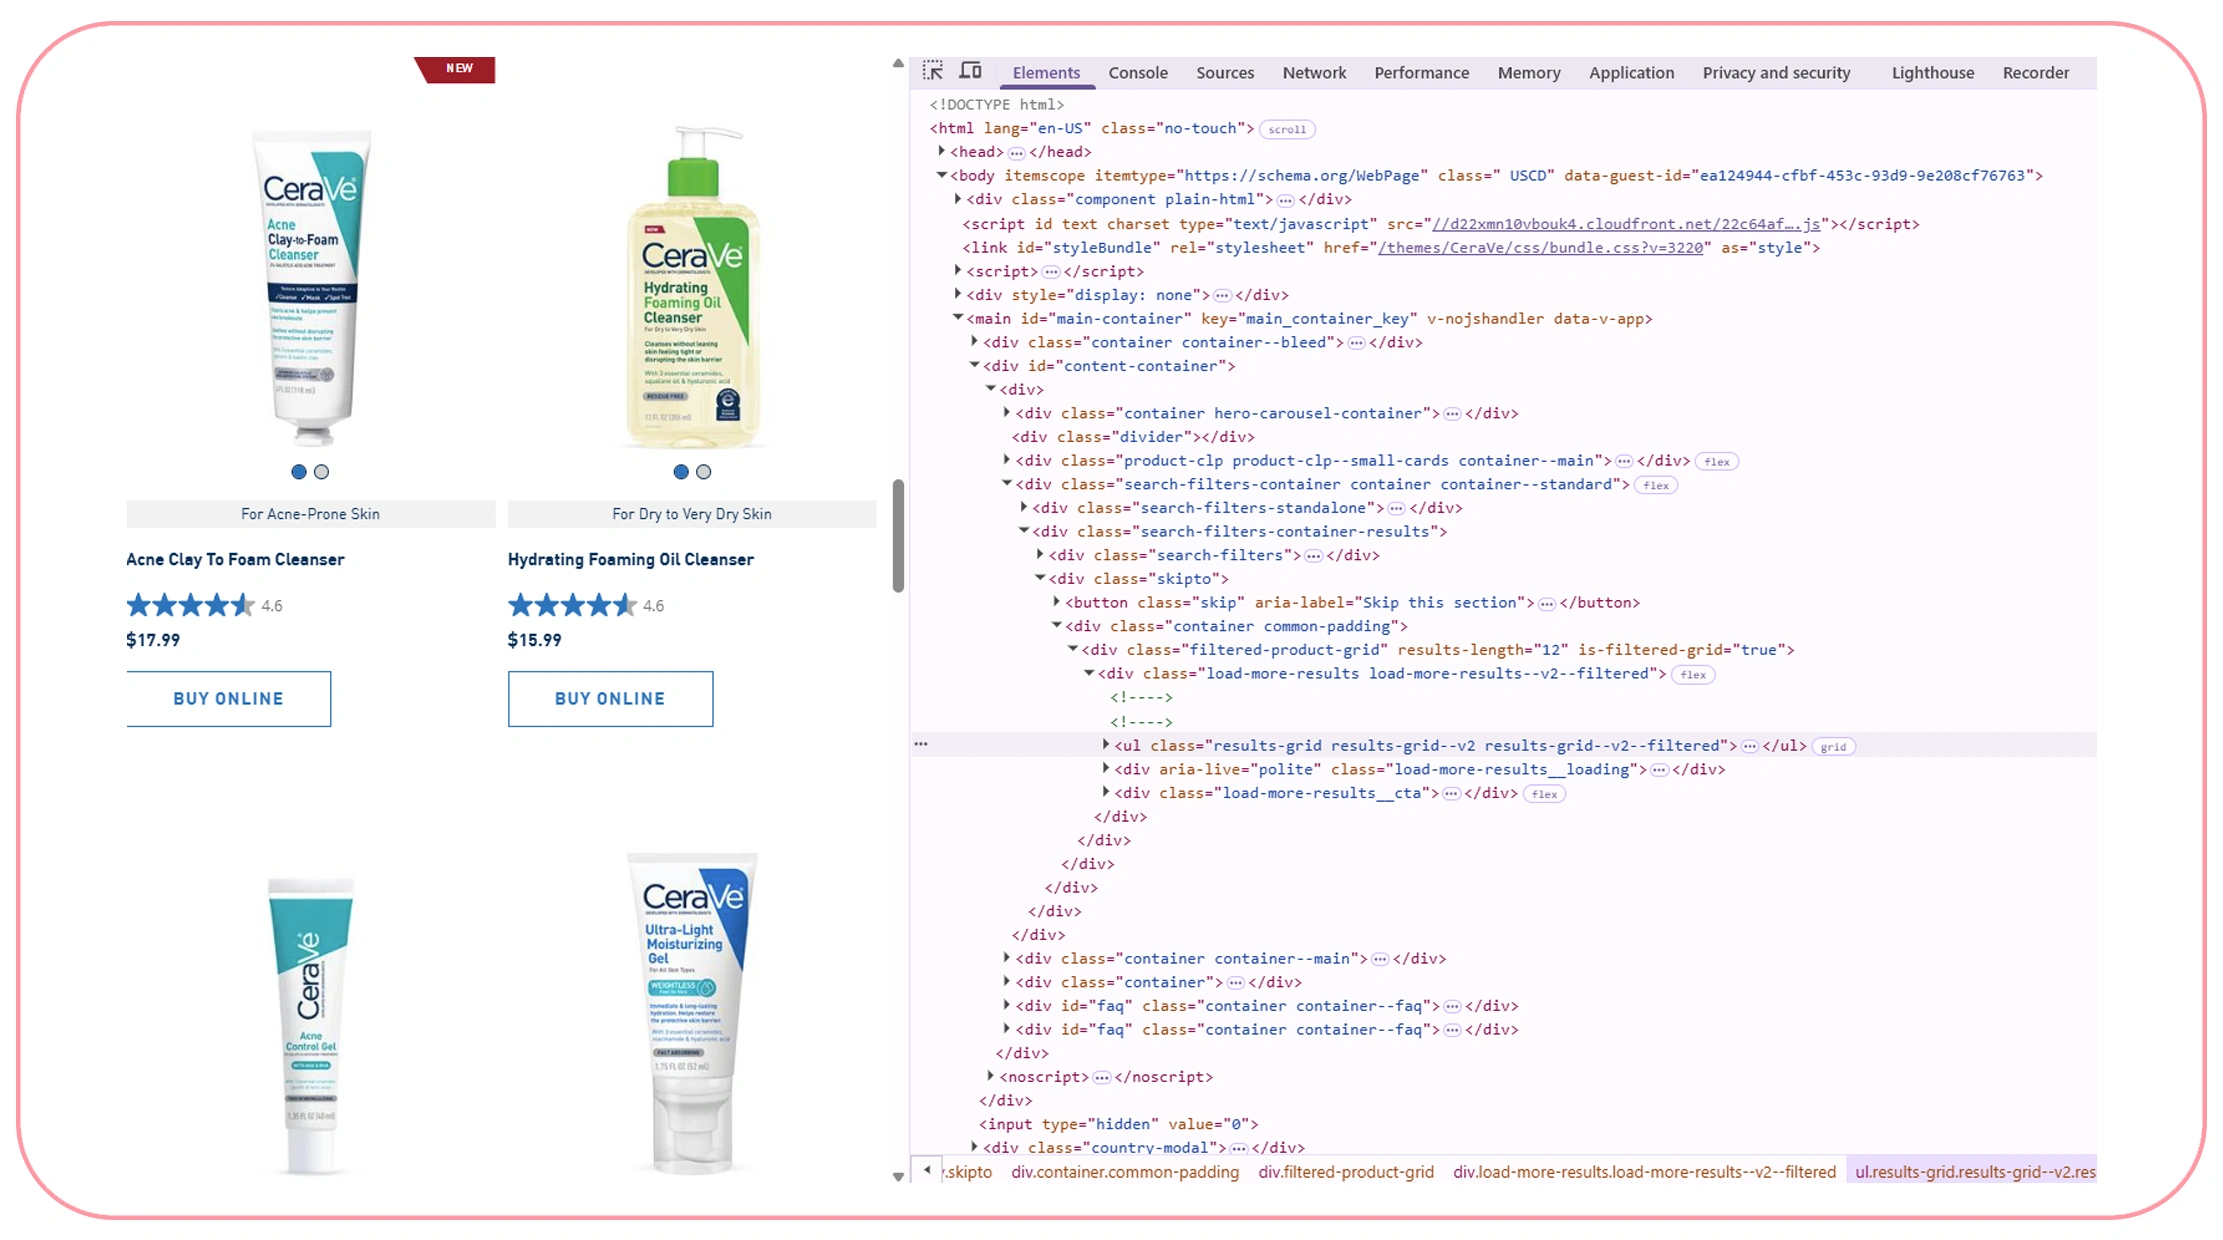
Pricing fluctuations are central to the competitive landscape. To effectively Scrape skincare product data for brands CeraVe and Cetaphil, analysts track SKU-level prices across retailers.
From 2020 to 2026, average moisturizer prices increased due to raw material and packaging costs.
| Year | Avg CeraVe Moisturizer Price ($) | Avg Cetaphil Moisturizer Price ($) |
|---|---|---|
| 2020 | 13.49 | 12.99 |
| 2022 | 14.99 | 14.29 |
| 2024 | 15.79 | 15.19 |
| 2026 | 16.49 | 15.89 |
However, discount frequency increased simultaneously.
| Year | Avg Discount Depth % | Promotional SKU Share % |
|---|---|---|
| 2020 | 18% | 22% |
| 2022 | 24% | 30% |
| 2024 | 27% | 36% |
| 2026 | 30% | 41% |
This indicates aggressive pricing competition, particularly during seasonal campaigns and pharmacy loyalty events.
Ingredient Transparency as a Competitive Lever
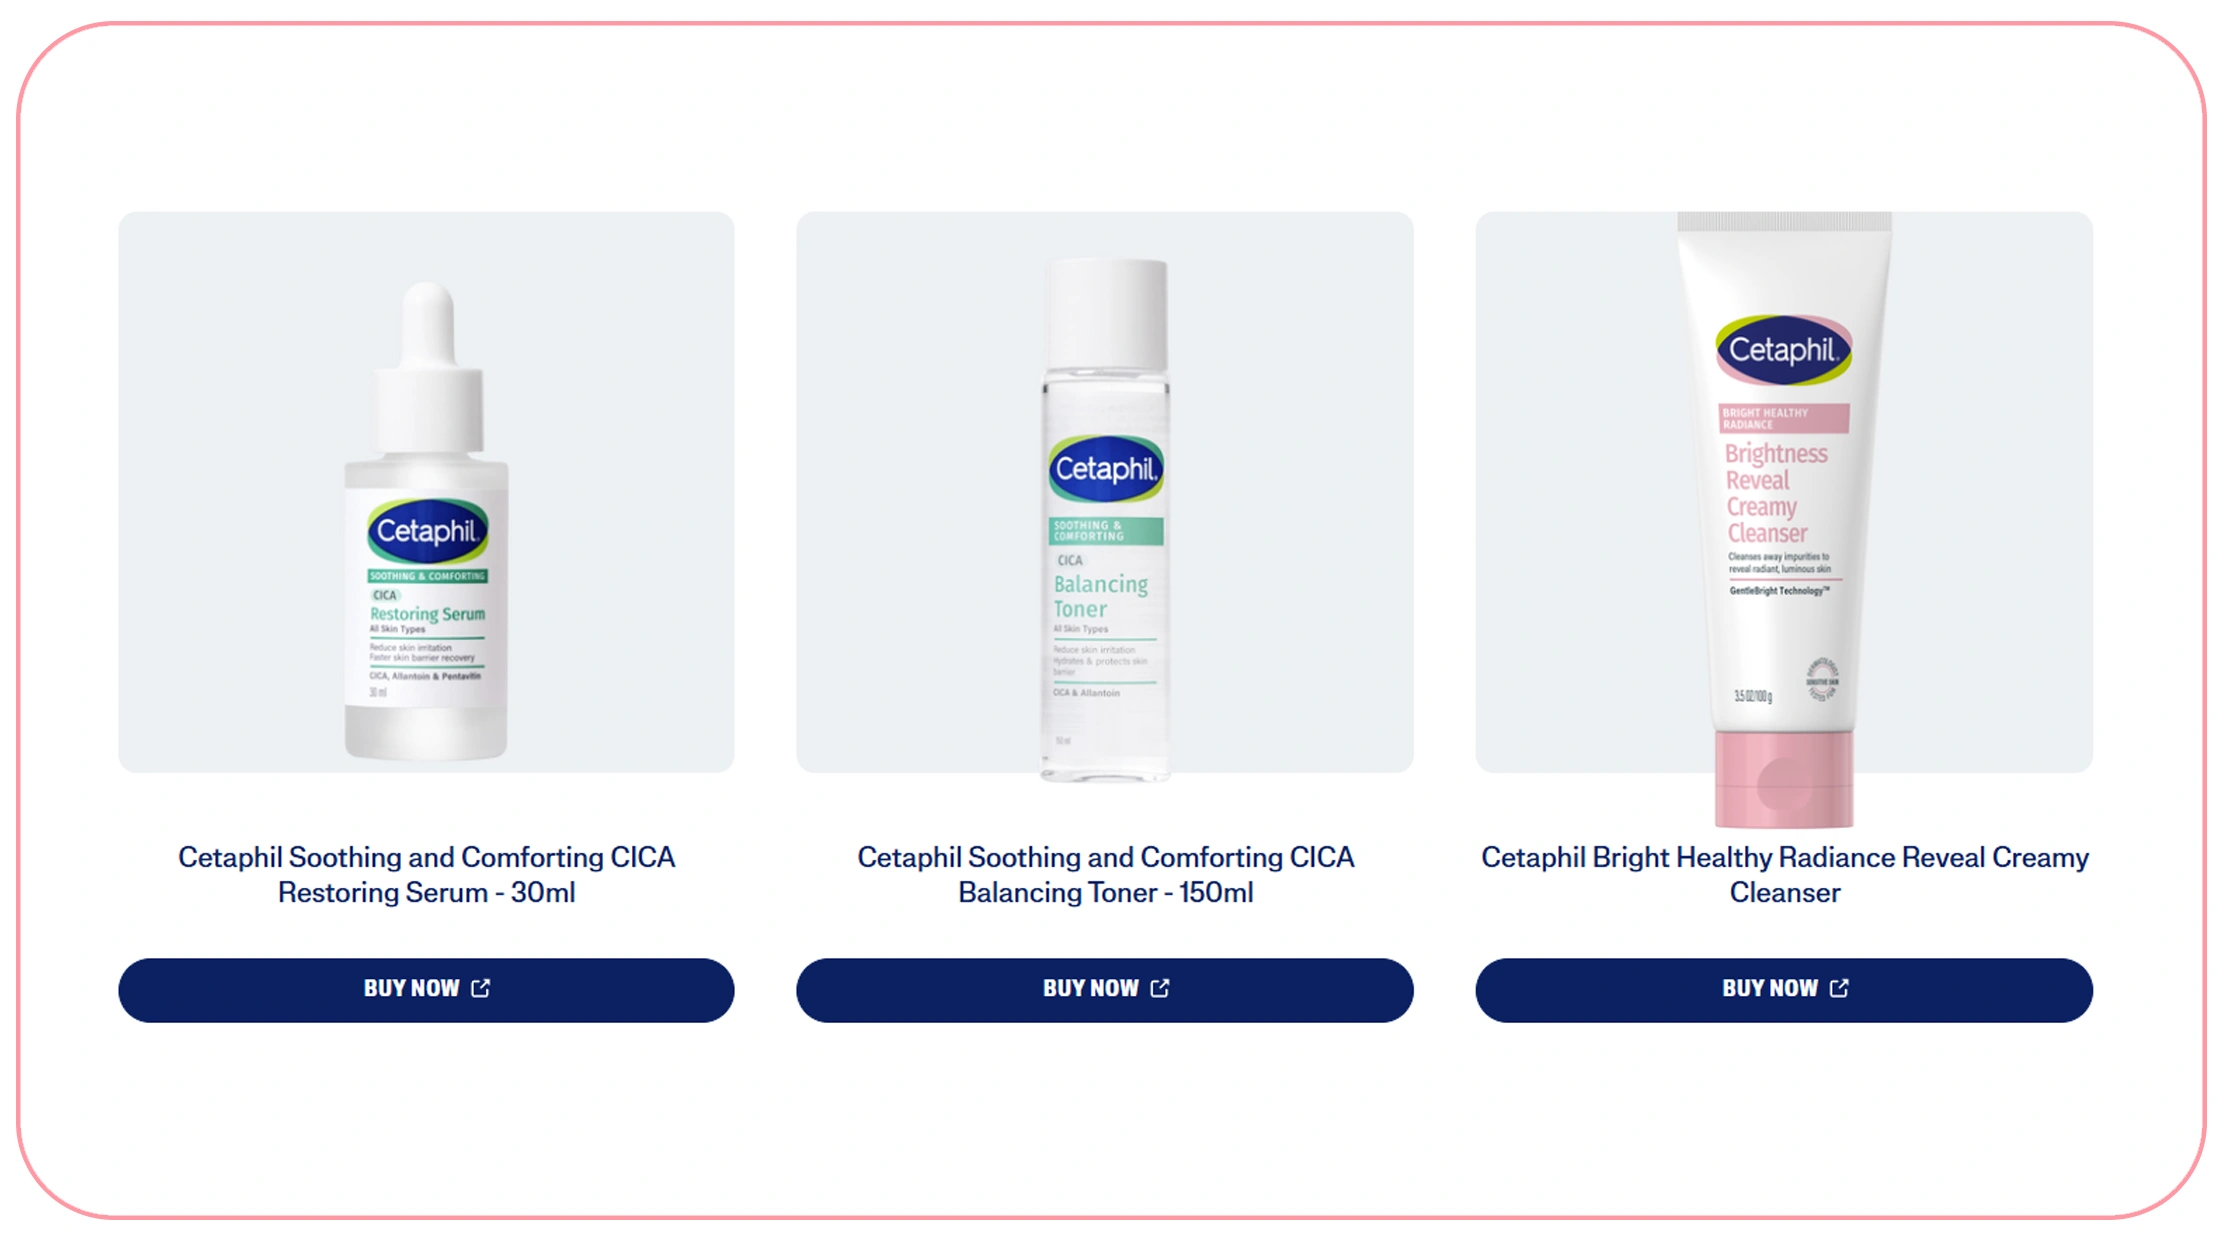
Consumers increasingly compare not only prices but ingredient lists. Businesses that extract skincare prices and ingredients from brands gain insights into formulation positioning.
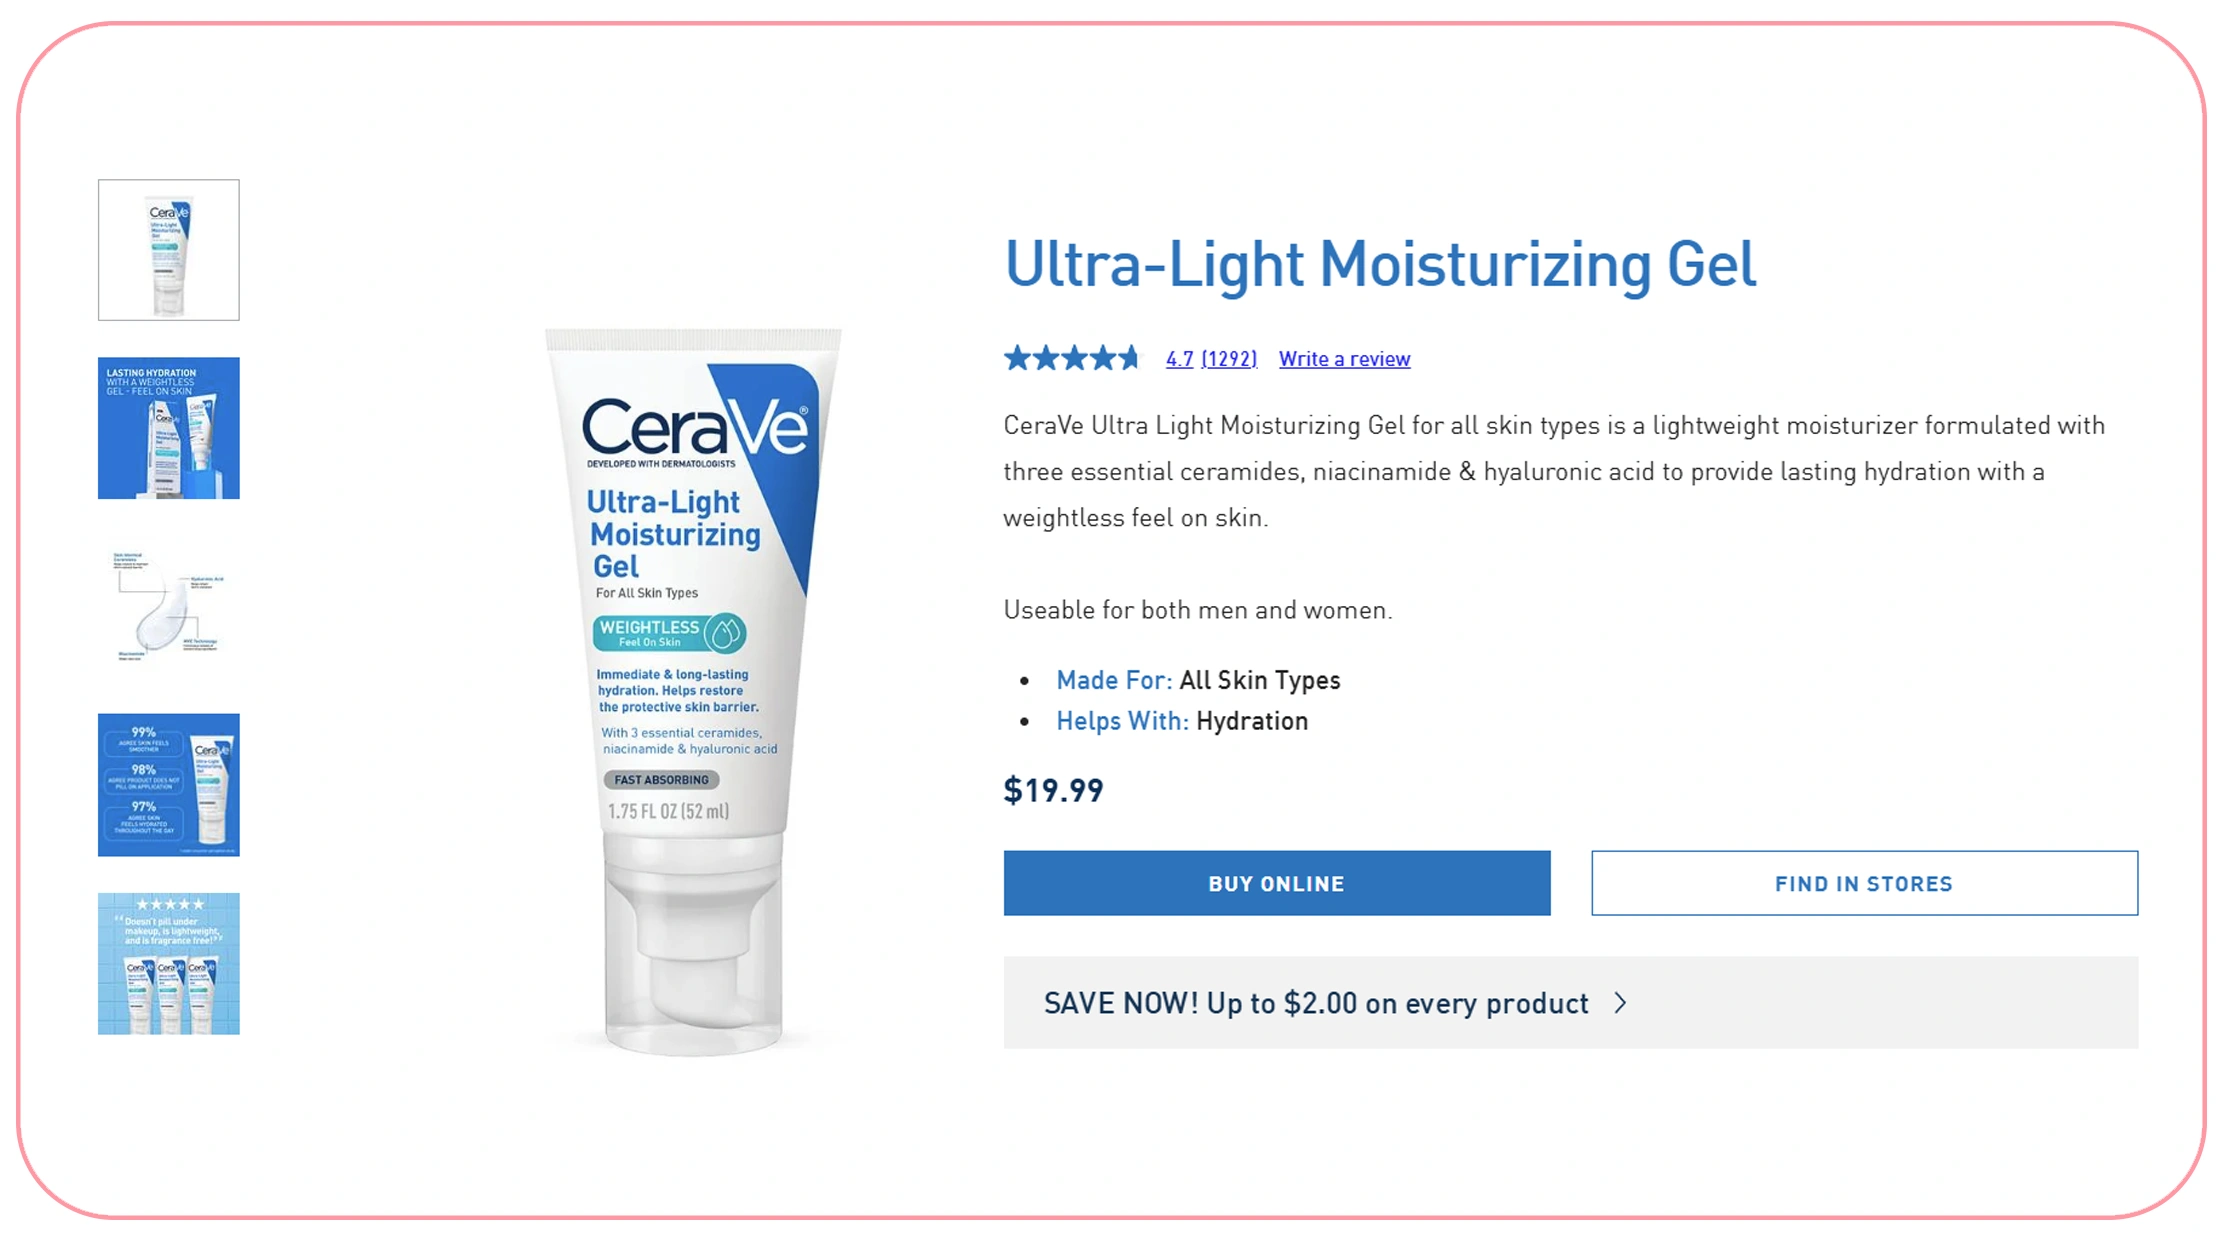
CeraVe emphasizes ceramides and hyaluronic acid, while Cetaphil highlights gentle cleansers and dermatologist-tested formulas. Ingredient-led marketing directly impacts perceived value.
| Key Ingredient Focus | CeraVe | Cetaphil |
|---|---|---|
| Ceramides | High | Moderate |
| Hyaluronic Acid | Yes | Limited |
| Fragrance-Free | Yes | Yes |
| Sensitive Skin Claims | Strong | Very Strong |
With Cetaphil skincare ingredient data extraction, brands can benchmark ingredient concentration trends and track reformulations. Ingredient differentiation often justifies price premiums and influences long-term brand loyalty.
Availability Gaps and Omnichannel Visibility
Product availability directly impacts revenue and brand perception. Through CeraVe skincare product availability data scraping, retailers can monitor stock levels, regional distribution, and eCommerce inventory fluctuations.
Between 2020 and 2023, supply chain disruptions led to periodic stockouts.
| Year | Avg Stockout Rate % (CeraVe) | Avg Stockout Rate % (Cetaphil) |
|---|---|---|
| 2020 | 6% | 5% |
| 2022 | 11% | 9% |
| 2024 | 7% | 6% |
| 2026 | 4% | 4% |
Brands that quickly restored availability gained competitive advantage. Real-time monitoring of Healthcare Datasets ensures retailers prevent lost sales and maintain digital shelf presence during high-demand periods.
Competitive Positioning and API-Driven Intelligence
The ability to integrate structured data via a CeraVe API allows seamless access to product pricing, SKU attributes, ingredient lists, and promotional data.
Healthcare and beauty analytics firms leverage Healthcare Datasets to conduct broader Market Research across dermatology categories.
Retail pricing tiers from 2020–2026 reveal strategic positioning:
| Tier | CeraVe Avg Price Range | Cetaphil Avg Price Range |
|---|---|---|
| Cleanser | $9–$16 | $8–$15 |
| Moisturizer | $12–$18 | $11–$17 |
| Specialty Care | $16–$22 | $14–$20 |
CeraVe often positions slightly above Cetaphil in pricing but compensates with ingredient-forward branding. Cetaphil maintains competitive parity with frequent pharmacy promotions.
Data-Driven Strategies to Win Pricing Wars

To stay competitive, brands must combine pricing intelligence with ingredient transparency and stock monitoring. Businesses using structured APIs can:
- Monitor competitor price shifts daily
- Analyze ingredient trends across SKUs
- Identify discount timing patterns
- Compare price-per-ml across marketplaces
- Track regional availability gaps
Advanced analytics reveal that price parity within 3–5% significantly influences conversion rates in online marketplaces.
Retailers integrating pricing dashboards observed up to 12% improvement in promotional ROI between 2023 and 2026.
Frequently Asked Questions
Why are CeraVe and Cetaphil constantly compared?
Both brands target dermatologist-recommended, sensitive-skin consumers with similar product categories and pricing tiers.
How does ingredient transparency affect pricing?
Consumers perceive higher value in clinically backed ingredients like ceramides and hyaluronic acid.
Why do prices vary across retailers?
Retail markups, promotional events, and inventory levels influence price differences.
How can brands monitor competitors efficiently?
Using APIs and automated data extraction tools enables real-time price and availability tracking.
Why Choose Real Data API
Real Data API delivers structured, scalable, and real-time intelligence to help brands win competitive pricing battles. Our solutions enable businesses to Scrape skincare product data for brands CeraVe and Cetaphil, monitor promotional fluctuations, and analyze formulation positioning across retailers. With seamless integration capabilities including the CeraVe API, clients gain automated access to SKU-level pricing, ingredient insights, and availability tracking.
Our advanced data pipelines support comprehensive Healthcare Datasets and in-depth Market Research, empowering retailers, brands, and analytics firms to identify pricing gaps, optimize promotions, and strengthen digital shelf performance with actionable intelligence.
Conclusion
The competitive dynamics of CeraVe vs Cetaphil skincare market price comparison wars demonstrate how pricing, discounts, ingredient positioning, and availability collectively shape consumer decisions.
In today's digital-first retail environment, data visibility is critical. Brands that integrate structured APIs, monitor ingredient trends, and track price fluctuations in real time gain measurable competitive advantages.
Real Data API empowers skincare brands, retailers, and analytics firms with scalable solutions to monitor pricing, availability, and formulation insights.
If you want to gain a strategic edge in the evolving skincare marketplace, partner with Real Data API today and transform pricing intelligence into growth opportunities.
Latest posts

Why Brands Use Competitive Data Intelligence to Increase Market Share in Highly Competitive Markets?

How To Scrape Competitor Data To Support Market Entry Strategy And Expansion Planning For Data-Driven Business Growth?

How Hotel Occupancy Intelligence Through Public Data Sources Is Reshaping Revenue Management

The ZIP Code Advantage: How Hyper-Local Amazon Product Data Collection Is Redefining Retail Intelligence
Real Data API stands out as one of the premier global companies specializing in web data Scraping and web extraction.


Rating 4.7
Rating 4.7
Rating 4.5
Rating 4.7
Rating 4.7


Disclaimer : RealData API functions solely as an independent data infrastructure and technology solutions provider. We build customized automation workflows designed to collect publicly accessible web data based exclusively on client instructions. RealData API neither owns proprietary datasets nor engages in the sale or redistribution of extracted information. Our operations are limited strictly to lawful public web data processing and never involve unauthorized access to restricted systems or private networks. Any company names, trademarks, logos, or brand references displayed on this website are used purely for demonstrative and illustrative purposes to showcase our technical capabilities and do not imply endorsement, partnership, or affiliation. Use of our platform and services remains subject to our Terms of Service.