

Introduction
In Part 1, we built the foundational dataset of restaurants, menus, pricing, and delivery attributes from YUMMi Delivery API.In Part 2, we structured discount and promotional campaign intelligence.In Part 3, we developed competitive benchmarking models.
Now in Part 4, we go deeper into one of the most powerful strategic layers of food delivery analytics:
Location-Based Data Extraction for City-Wise Food Delivery Insights
Food delivery is not a uniform market. Pricing, competition, cuisine density, delivery fees, and promotional intensity vary significantly from one city to another — and even between suburbs within the same city.
When powered by scalable scraping infrastructure like Real Data API, geo-segmented intelligence enables hyper-local competitive strategy, expansion planning, and demand forecasting.
Let's explore how to build it.
Why Location-Based Intelligence Matters in Food Delivery

Consumer behavior in Auckland differs from Wellington. Christchurch differs from Hamilton. Urban hubs differ from suburban zones.
Key factors that vary geographically:
- Restaurant density
- Cuisine popularity
- Price levels
- Delivery fee averages
- Discount intensity
- Delivery time efficiency
- Premium vs budget segmentation
Without location-based scraping, businesses only see partial market signals.
With geo-targeted extraction, businesses can answer:
- Which city has the highest average menu pricing?
- Where is competition most saturated?
- Which suburbs are under-served?
- Are delivery fees higher in central business districts?
- Where are discount wars most aggressive?
Geo-intelligence transforms broad analytics into actionable regional strategy.
Understanding Location Personalization on YUMMi NZ
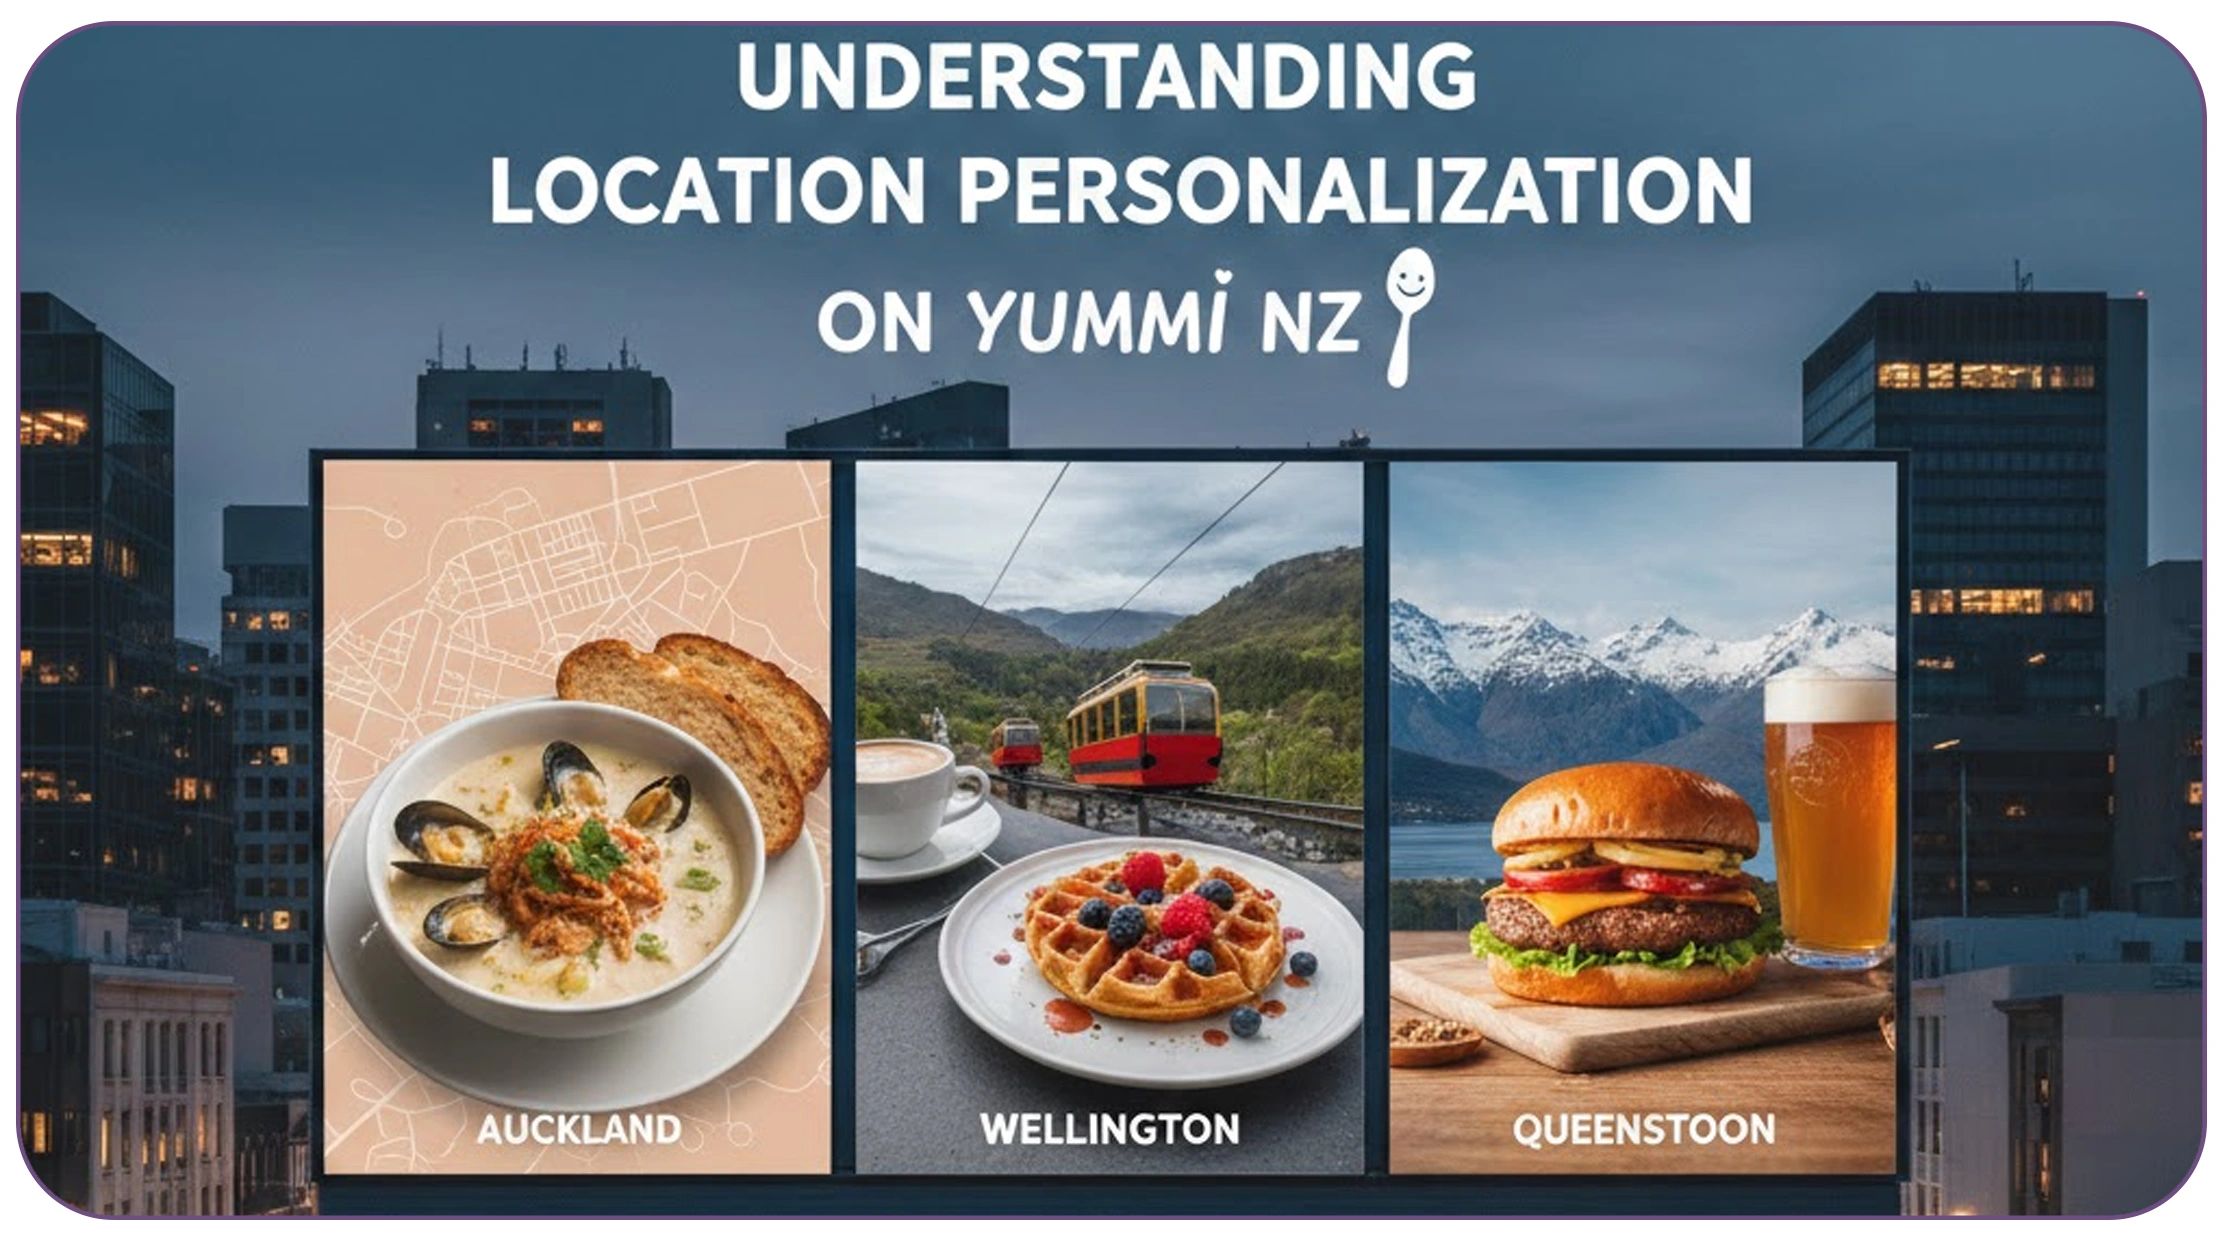
Food delivery platforms dynamically display restaurants based on:
- Delivery address
- Postal code
- Geo-coordinates
- Browser session data
This means:
The restaurant list in central Auckland will differ from suburban Christchurch.
To extract comprehensive datasets, scraping systems must simulate multiple geographic locations.
Key requirements:
- Address-based session triggering
- City-level crawling
- Suburb-level iteration
- Delivery radius testing
- Pagination handling
Real Data API support location-rotational Enterprise Web Crawling frameworks, enabling structured extraction across multiple NZ regions automatically.
Designing a Location-Based Data Schema
To build geo-level insights, your dataset must include strong location tagging.
Restaurant Geo Schema
| Field | Description |
|---|---|
| restaurant_id | Unique identifier |
| city | Primary city |
| suburb | Delivery area |
| postal_code | If available |
| geo_latitude | If extractable |
| geo_longitude | If extractable |
| delivery_radius | Estimated coverage |
| cuisine | Cuisine category |
| rating | Customer rating |
| delivery_fee | Fee |
| minimum_order | Threshold |
This structure enables city-wise, suburb-wise, and even cluster-level analysis.
With Real Data API pipelines, geo-tagging can be normalized across refresh cycles to ensure consistency.
City-Wise Restaurant Density Analysis

The first geo-level insight is restaurant density.
Metrics to Calculate
- Total restaurants per city
- Restaurants per cuisine per city
- Restaurants per square kilometer (if geo-data available)
- New restaurant growth rate
Example insights:
Auckland may have higher cuisine diversity.
Wellington may show strong premium clustering.
Christchurch may have lower restaurant density but higher discount dependency.
Restaurant density analysis helps identify:
- Market saturation
- Expansion opportunities
- Competitive clustering
- Cuisine dominance
Suburb-Level Competitive Heatmaps

City-level analysis is broad.Suburb-level analysis is precise.
By scraping restaurants per suburb, businesses can:
- Identify underserved neighborhoods
- Detect high-competition clusters
- Analyze local price sensitivity
- Map delivery time efficiency
Suburb Benchmark Metrics
- Average menu price per suburb
- Delivery fee variance
- Promotion intensity
- Average rating distribution
- Minimum order threshold comparison
For example:
Central Auckland may show higher delivery fees.
Outer suburbs may have longer delivery times.
Premium cuisines may cluster near commercial districts.
Geo-segmentation enables hyper-local targeting strategies.
City-Wise Pricing Comparison

Pricing varies by geography due to:
- Rent differences
- Consumer purchasing power
- Competitive intensity
- Operational costs
Using structured Web Scraping Services, you can calculate:
- Average item price per cuisine per city
- Median delivery fee per city
- Price dispersion range
- Premium pricing clusters
Example:
Average pizza price in Auckland vs Wellington
Delivery fee difference between Christchurch and Hamilton
Burger pricing variance by suburb
Real Data API supports continuous price tracking across cities, enabling real-time price shift detection.
Location-Based Promotion Intelligence

Promotions are not always uniform nationwide.
Restaurants may:
- Offer discounts in competitive zones
- Reduce delivery fees in high-density areas
- Launch city-specific campaigns
By integrating Part 2's promotion dataset with geo-layer tagging, businesses can measure:
- Discount intensity per city
- Free delivery frequency by suburb
- Campaign duration differences
- Regional price wars
Geo-based promotion analysis reveals local competitive pressure.
Delivery Time & Operational Efficiency by City

Delivery time is a major competitive factor.
Extractable metrics:
- Estimated delivery time
- Time range variance
- Delivery time vs rating correlation
City-based analysis may show:
- Faster average delivery in compact cities
- Longer times in suburban areas
- Premium restaurants offering priority delivery
Delivery efficiency benchmarking helps:
- Optimize logistics
- Identify operational gaps
- Improve customer satisfaction strategy
Geo-Based Cuisine Popularity Mapping
Cuisine trends vary geographically.
By aggregating scraped data, you can measure:
- Cuisine share by city
- Fast-growing cuisines by suburb
- Premium cuisine clustering
- Vegetarian/vegan density
Example:
Sushi dominance in urban Auckland
Indian cuisine concentration in specific suburbs
Burger chains dominating central areas
Cuisine mapping supports:
- Market entry decisions
- New branch placement
- Menu diversification planning
Identifying Underserved Regions
One of the most valuable outputs of geo-based scraping is gap detection.
Key questions:
- Which suburb has low restaurant density?
- Are delivery fees unusually high due to limited competition?
- Is there low availability of certain cuisines?
- Are minimum order thresholds higher than average?
Gap analysis reveals white-space opportunities.
Real Data API automation allows businesses to scan multiple cities simultaneously and identify expansion targets based on structured metrics.
Building Geo-Segmented Competitive Dashboards

Manual geo-analysis is inefficient.
An automated geo-dashboard should include:
- City comparison charts
- Suburb-level heatmaps
- Price distribution graphs
- Delivery fee maps
- Promotion intensity maps
- Cuisine density visualizations
With Real Data API, businesses can:
- Automate city-wise scraping
- Refresh data daily
- Track regional changes
- Integrate directly into BI tools
- Set alerts for market shifts
This transforms raw geo-data into executive-ready insights.
Advanced Location-Based Metrics
Beyond basic metrics, advanced geo-analytics include:
1️. Competitive Density Index
Measure number of similar cuisine competitors in a radius.
2️. Price Volatility by Region
Track how frequently menu prices change by city.
3️. Discount Saturation Ratio
Percentage of restaurants offering promotions in a suburb.
4️. Delivery Fee Elasticity
Correlation between delivery fee changes and rating growth.
5️. Premium Cluster Mapping
Identify high-priced restaurant zones.
These advanced insights require consistent geo-tagged scraping infrastructure.
Real Data API supports incremental updates, historical comparisons, and structured API outputs for such modeling.
Infrastructure Requirements for Geo-Scraping
Location-based scraping requires:
- Geo-rotational session handling
- Address simulation
- Proxy rotation
- Rate limiting
- Structured output validation
- Suburb-level normalization
Challenges include:
- Dynamic content loading
- Location detection changes
- UI structure updates
- Session expiration
Enterprise-grade solutions like Real Data API reduce these complexities through:
- Automated geo-session management
- Distributed crawling frameworks
- Change detection alerts
- Structured data normalization pipelines
Ethical & Responsible Geo-Data Monitoring
When conducting location-based scraping:
- Focus on publicly visible information
- Respect request frequency limits
- Avoid excessive load
- Use data for analytical purposes
- Maintain compliance with local data regulations
Responsible scraping ensures long-term Price Monitoring stability.
Strategic Applications of Location-Based Insights
Geo-based intelligence supports:
1. Restaurant Chains
Choose optimal new branch locations.
2. Food Delivery Startups
Identify low-competition suburbs.
3. Consultants
Deliver city-specific pricing advisory.
4. Investors
Measure saturation risk by geography.
5. Marketing Teams
Launch hyper-local campaigns.
Conclusion: Powering City-Wise Food Delivery Intelligence with Real Data API
Location-based intelligence transforms food delivery data into strategic regional insights.
By systematically scraping and structuring geo-segmented data from YUMMi NZ, businesses can:
- Compare pricing across cities
- Benchmark delivery fees by suburb
- Detect promotion intensity by region
- Identify underserved neighborhoods
- Map cuisine dominance
- Measure competitive saturation
However, geo-based benchmarking requires more than manual research. It demands:
- Automated location simulation
- Multi-city scraping coverage
- Structured geo-tagging
- Historical tracking
- Real-time data refresh
This is where Real Data API becomes a powerful enabler.
Real Data API allows businesses to:
- Automate large-scale geo-targeted web scraping
- Capture structured city-wise datasets
- Maintain consistent suburb-level tagging
- Integrate geo-intelligence into BI dashboards
- Monitor regional competitive shifts in real time
With Real Data API, location-based insights evolve from static analysis into a continuously updated competitive advantage.
In Part 5, we will complete the series with Delivery Charges, Minimum Order & Service Fee Analysis for Profit Optimization, diving into operational and margin modeling.
Latest posts

Web Scraping Competitor Product Monitoring Using Marketplace Data for Real-Time E-commerce Insights and Business Growth?
How to Scrape Product Intelligence Platform Using Marketplace Data to Help Brands Optimize Pricing, Inventory, and Product Strategy?

Why Companies scrape business data from Google Maps using keywords to Build Accurate Business Lists and Competitive Insights?
How Review scraping and monitoring services Help Businesses Track Customer Sentiment and Protect Brand Reputation in 2026?

How Real Estate Investment Insights Using RERA Data Scraping Help Investors Minimize Risk and Maximize Returns
Real Data API stands out as one of the premier global companies specializing in web data Scraping and web extraction.


Rating 4.7
Rating 4.7
Rating 4.5
Rating 4.7
Rating 4.7


Disclaimer : RealData API functions solely as an independent data infrastructure and technology solutions provider. We build customized automation workflows designed to collect publicly accessible web data based exclusively on client instructions. RealData API neither owns proprietary datasets nor engages in the sale or redistribution of extracted information. Our operations are limited strictly to lawful public web data processing and never involve unauthorized access to restricted systems or private networks. Any company names, trademarks, logos, or brand references displayed on this website are used purely for demonstrative and illustrative purposes to showcase our technical capabilities and do not imply endorsement, partnership, or affiliation. Use of our platform and services remains subject to our Terms of Service.