

Introduction
The Indian e-commerce sector has witnessed exponential growth over the past five years, with platforms like Amazon, Flipkart, Ajio, Meesho, and Myntra leading in product variety, pricing strategies, and customer engagement. Consumers increasingly demand convenience, variety, and competitive pricing, making data-driven decisions essential for businesses seeking to optimize their online offerings.
Organizations, analysts, and market researchers now rely on real-time, structured data to monitor trends, analyze competitor performance, and forecast demand. By leveraging tools that scrape product data from Amazon, Flipkart, Ajio, Meesho & Myntra, stakeholders can extract product information, pricing updates, reviews, and inventory levels efficiently. This structured data allows businesses to identify top-selling products, evaluate promotions, and make strategic decisions about inventory management and pricing.
Ajio, in particular, has emerged as a fast-growing fashion e-commerce platform in India. Using the Ajio Scraping API, researchers can extract structured product details, pricing, and customer reviews to analyze performance at a granular level. This report provides a detailed competitive analysis, pricing strategy insights, and cross-platform comparisons across the top five e-commerce platforms in India. Combining multi-site data extraction with analytics enables businesses to optimize product launches, refine pricing strategies, and craft data-backed marketing campaigns to remain competitive in this dynamic landscape.
Flipkart Market Dynamics
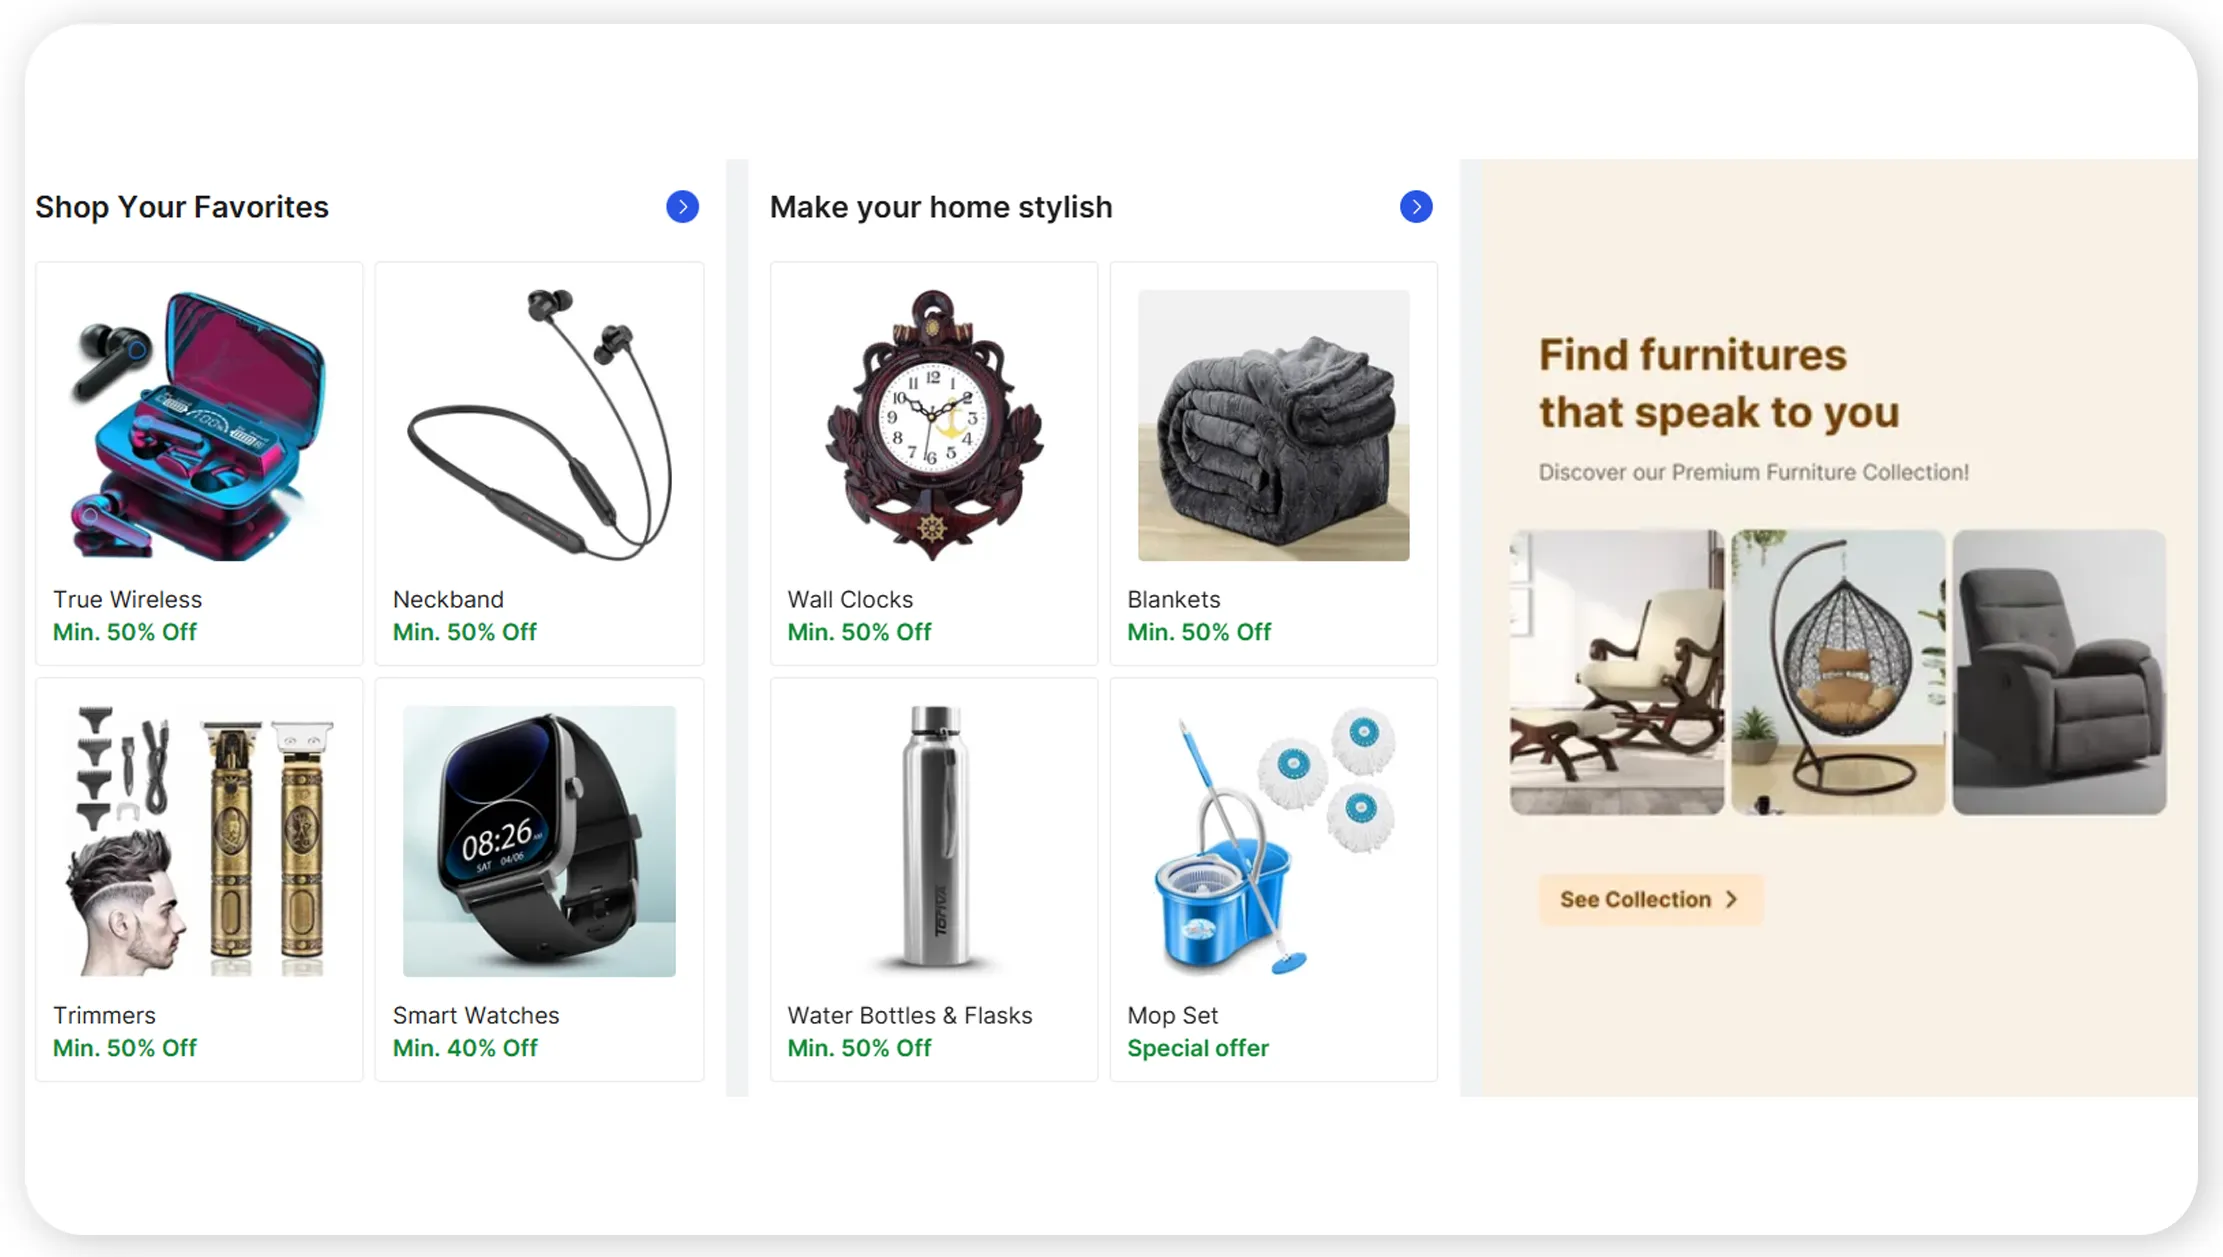
Using the Flipkart data extractor and Flipkart Product and Review Datasets, businesses can gain detailed insights into product performance and customer sentiment. Flipkart has continually expanded its catalog between 2020 and 2025, offering insights into product trends, category growth, and regional adoption.
| Year | Active Listings | Electronics Orders (%) | Avg. Rating | Key Highlights |
|---|---|---|---|---|
| 2020 | 40M | 35% | 4.2 | Core electronics & fashion growth |
| 2021 | 45M | 36% | 4.3 | Flipkart Plus launched; engagement +15% |
| 2022 | 50M | 37% | 4.3 | Tier-2/3 city expansion; reviews +25% |
| 2023 | 55M | 38% | 4.4 | AI-driven recommendations; repeat purchases +18% |
| 2024 | 60M | 40% | 4.4 | Seasonal campaigns boosted sales +20% |
| 2025 | 65M | 45% | 4.5 | Mobile & electronics market share 45% |
Structured datasets allow businesses to benchmark performance across categories, identify top-performing products, and forecast demand. Flipkart's review data provides insights into consumer preferences and pain points, enabling proactive product and service improvements.
Amazon Product Insights
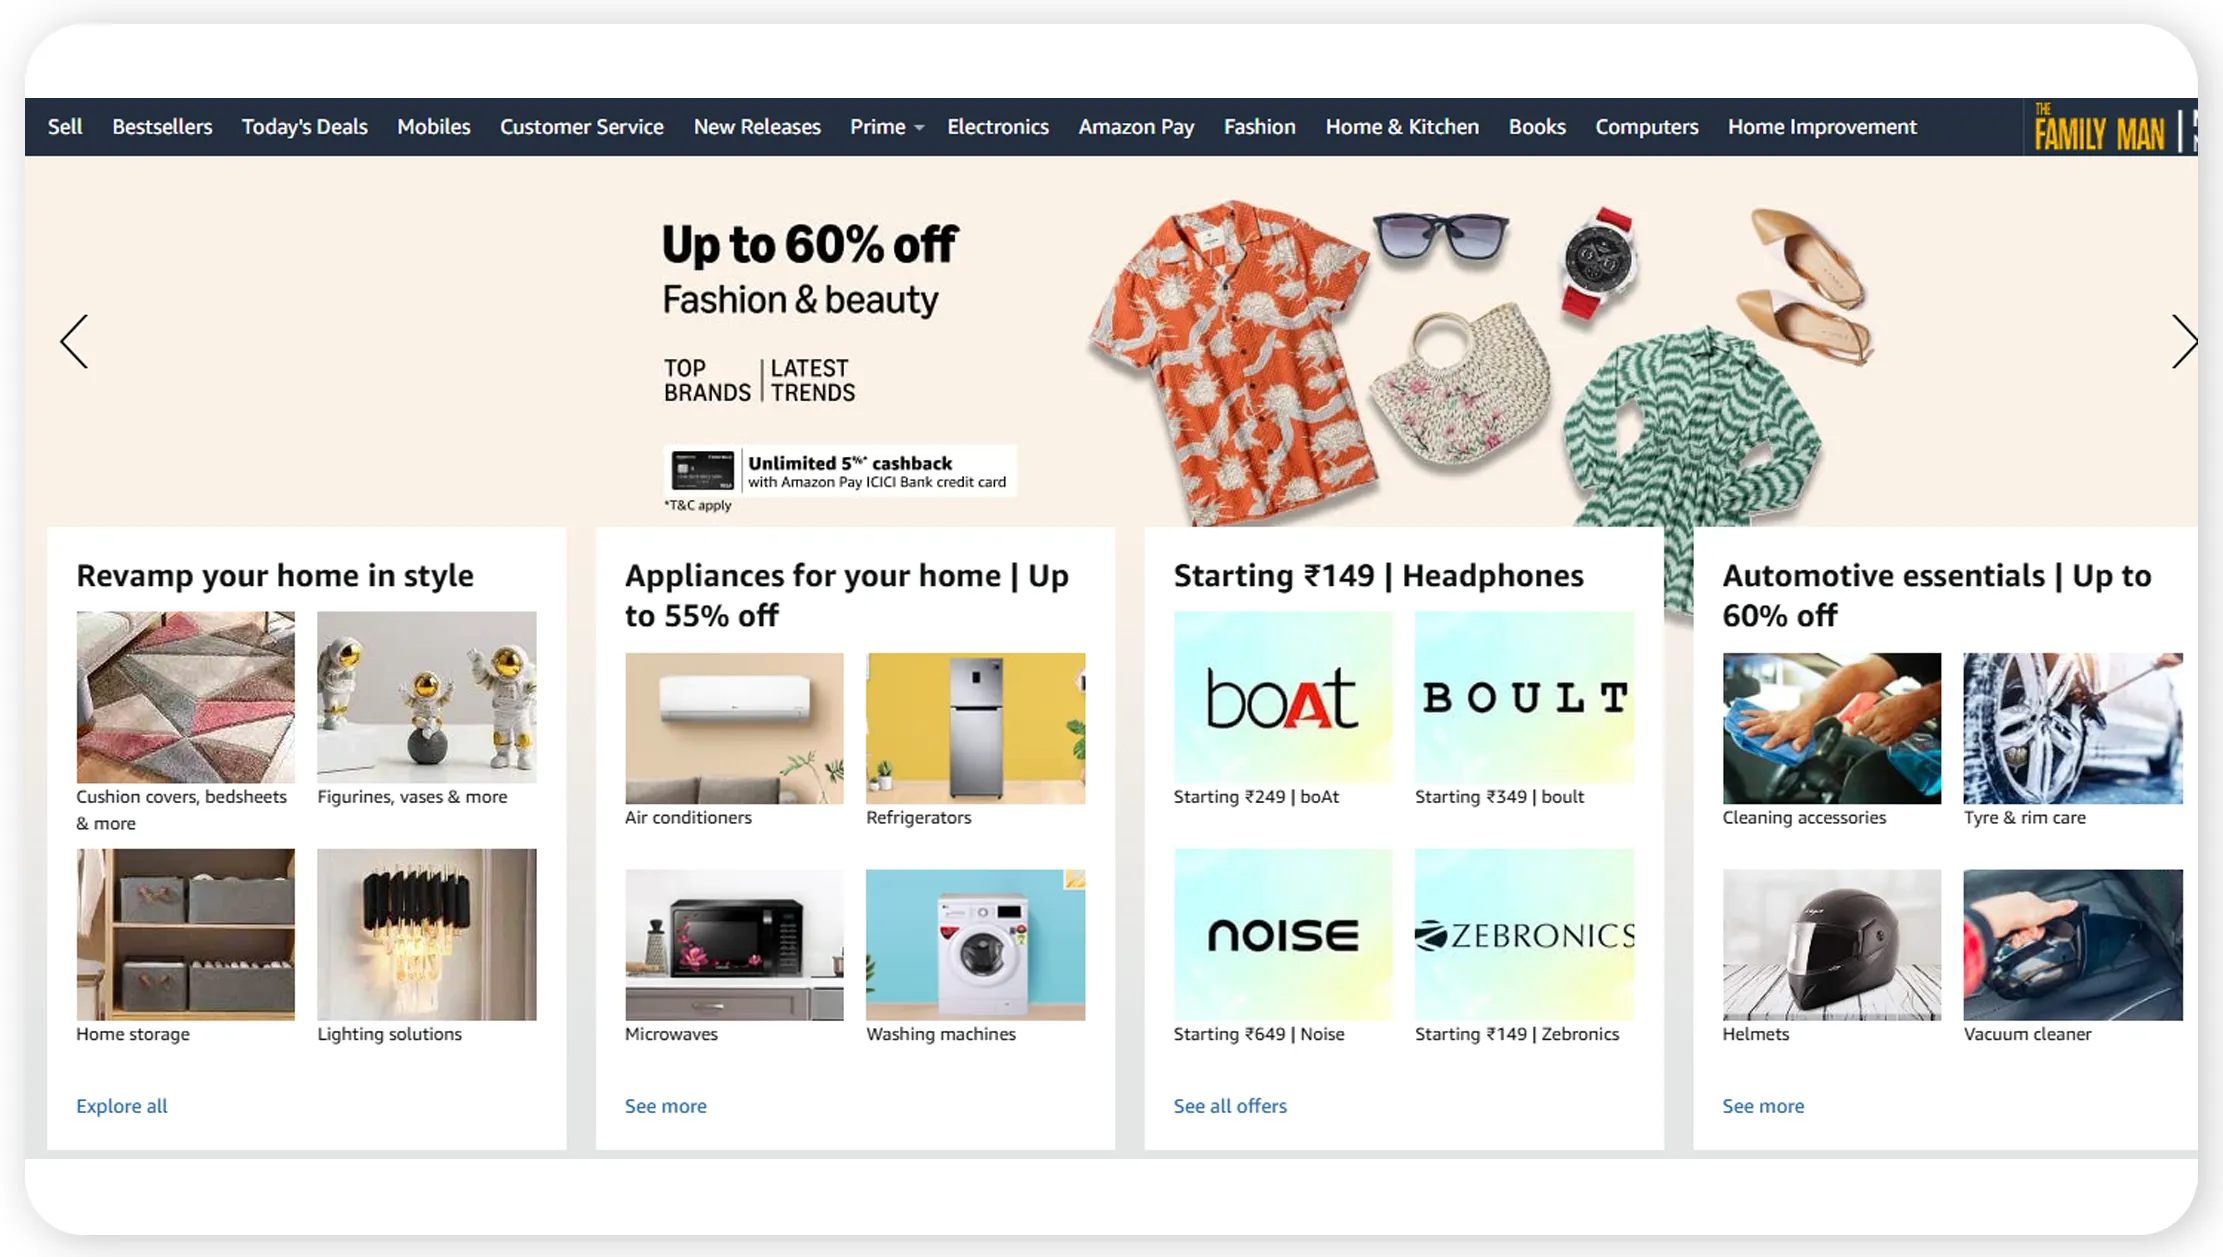
With the Amazon API Scraper, companies can extract product pricing, availability, and customer ratings at scale. Between 2020 and 2025, Amazon India expanded significantly, particularly in electronics, fashion, and FMCG segments.
| Year | Active Products | Avg. Price (€) | Orders Growth (%) | Key Highlights |
|---|---|---|---|---|
| 2020 | 35M | 150 | 20% | Electronics dominance |
| 2021 | 40M | 155 | 25% | Amazon Pantry launched |
| 2022 | 45M | 160 | 30% | Prime Day campaigns |
| 2023 | 50M | 165 | 20% | Regional language & hyperlocal delivery |
| 2024 | 55M | 170 | 18% | Dynamic pricing algorithms |
| 2025 | 60M | 175 | 22% | Avg delivery time reduced 2.5 days |
Amazon's structured data enables pricing optimization, competitive benchmarking, and analysis of demand patterns. Detailed review extraction allows businesses to evaluate customer sentiment and refine product strategies to improve conversions and repeat purchase rates.
Meesho Product Trends
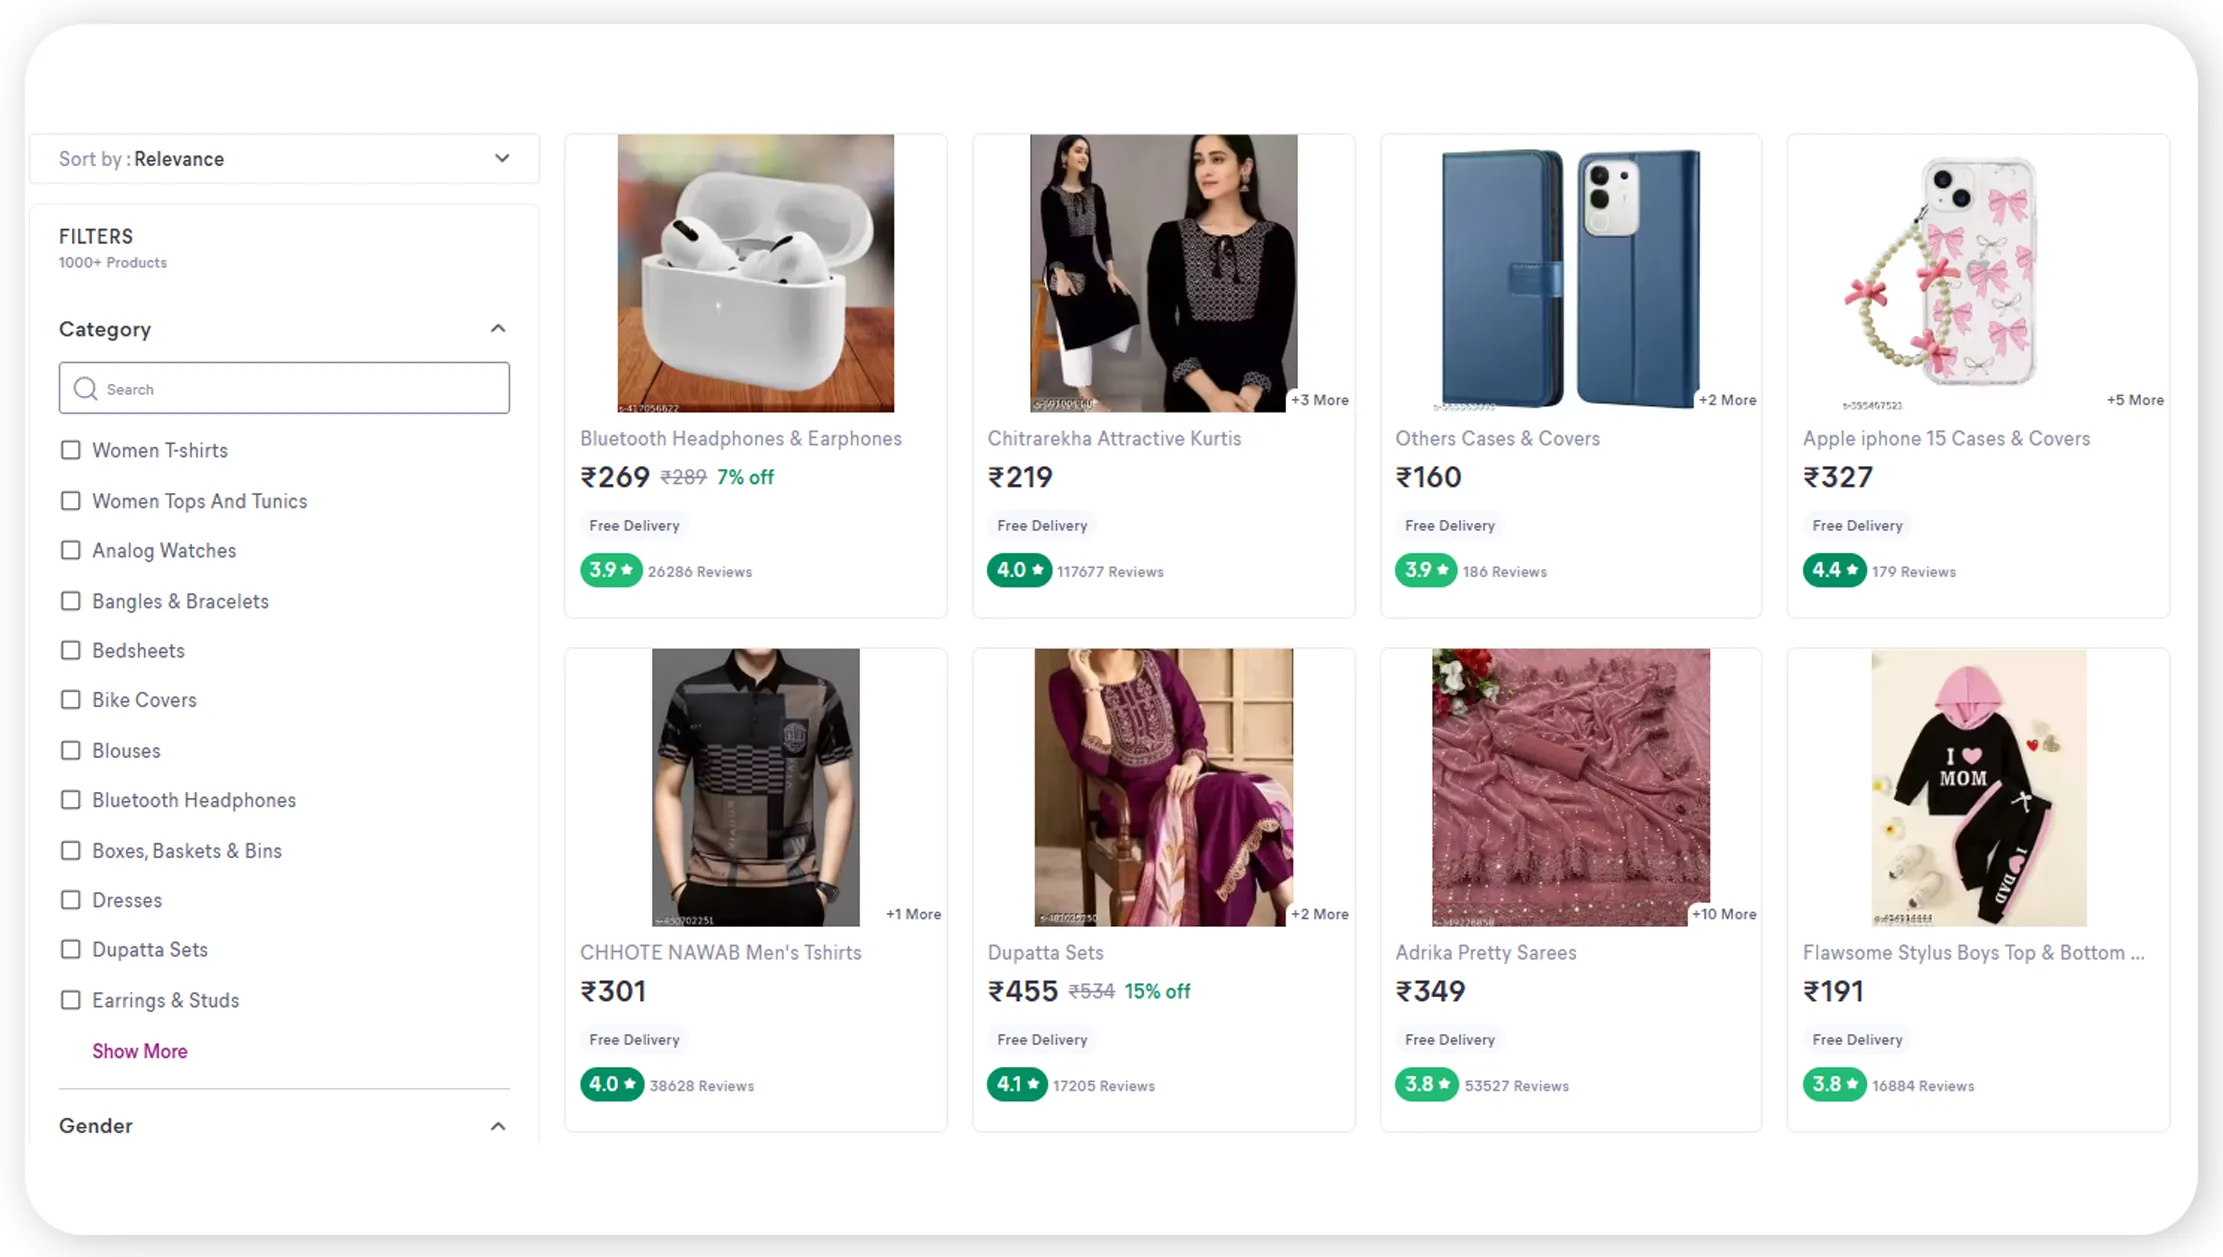
Using Meesho product insights, businesses can analyze seller performance, regional adoption, and product trends in India's social commerce ecosystem. From 2020 to 2025, Meesho grew exponentially, particularly in apparel, accessories, and beauty segments.
| Year | Active Sellers | Avg Order Value (₹) | Repeat Customers (%) | Key Highlights |
|---|---|---|---|---|
| 2020 | 5M | 500 | 20% | Small-scale & women entrepreneurs dominate |
| 2021 | 6M | 520 | 22% | Meesho supply chain tools increased delivery efficiency +18% |
| 2022 | 7M | 540 | 25% | Regional fashion demand +35% |
| 2023 | 8M | 550 | 28% | Social selling campaigns; repeat customers +25% |
| 2024 | 9M | 560 | 30% | Tier-2 adoption rose 40% |
| 2025 | 10M | 580 | 32% | Analytics dashboard integration improves inventory & pricing |
Analyzing Meesho data allows businesses to identify emerging sellers, forecast popular products, and adapt pricing strategies to optimize revenue and customer reach.
Ajio Product Pricing
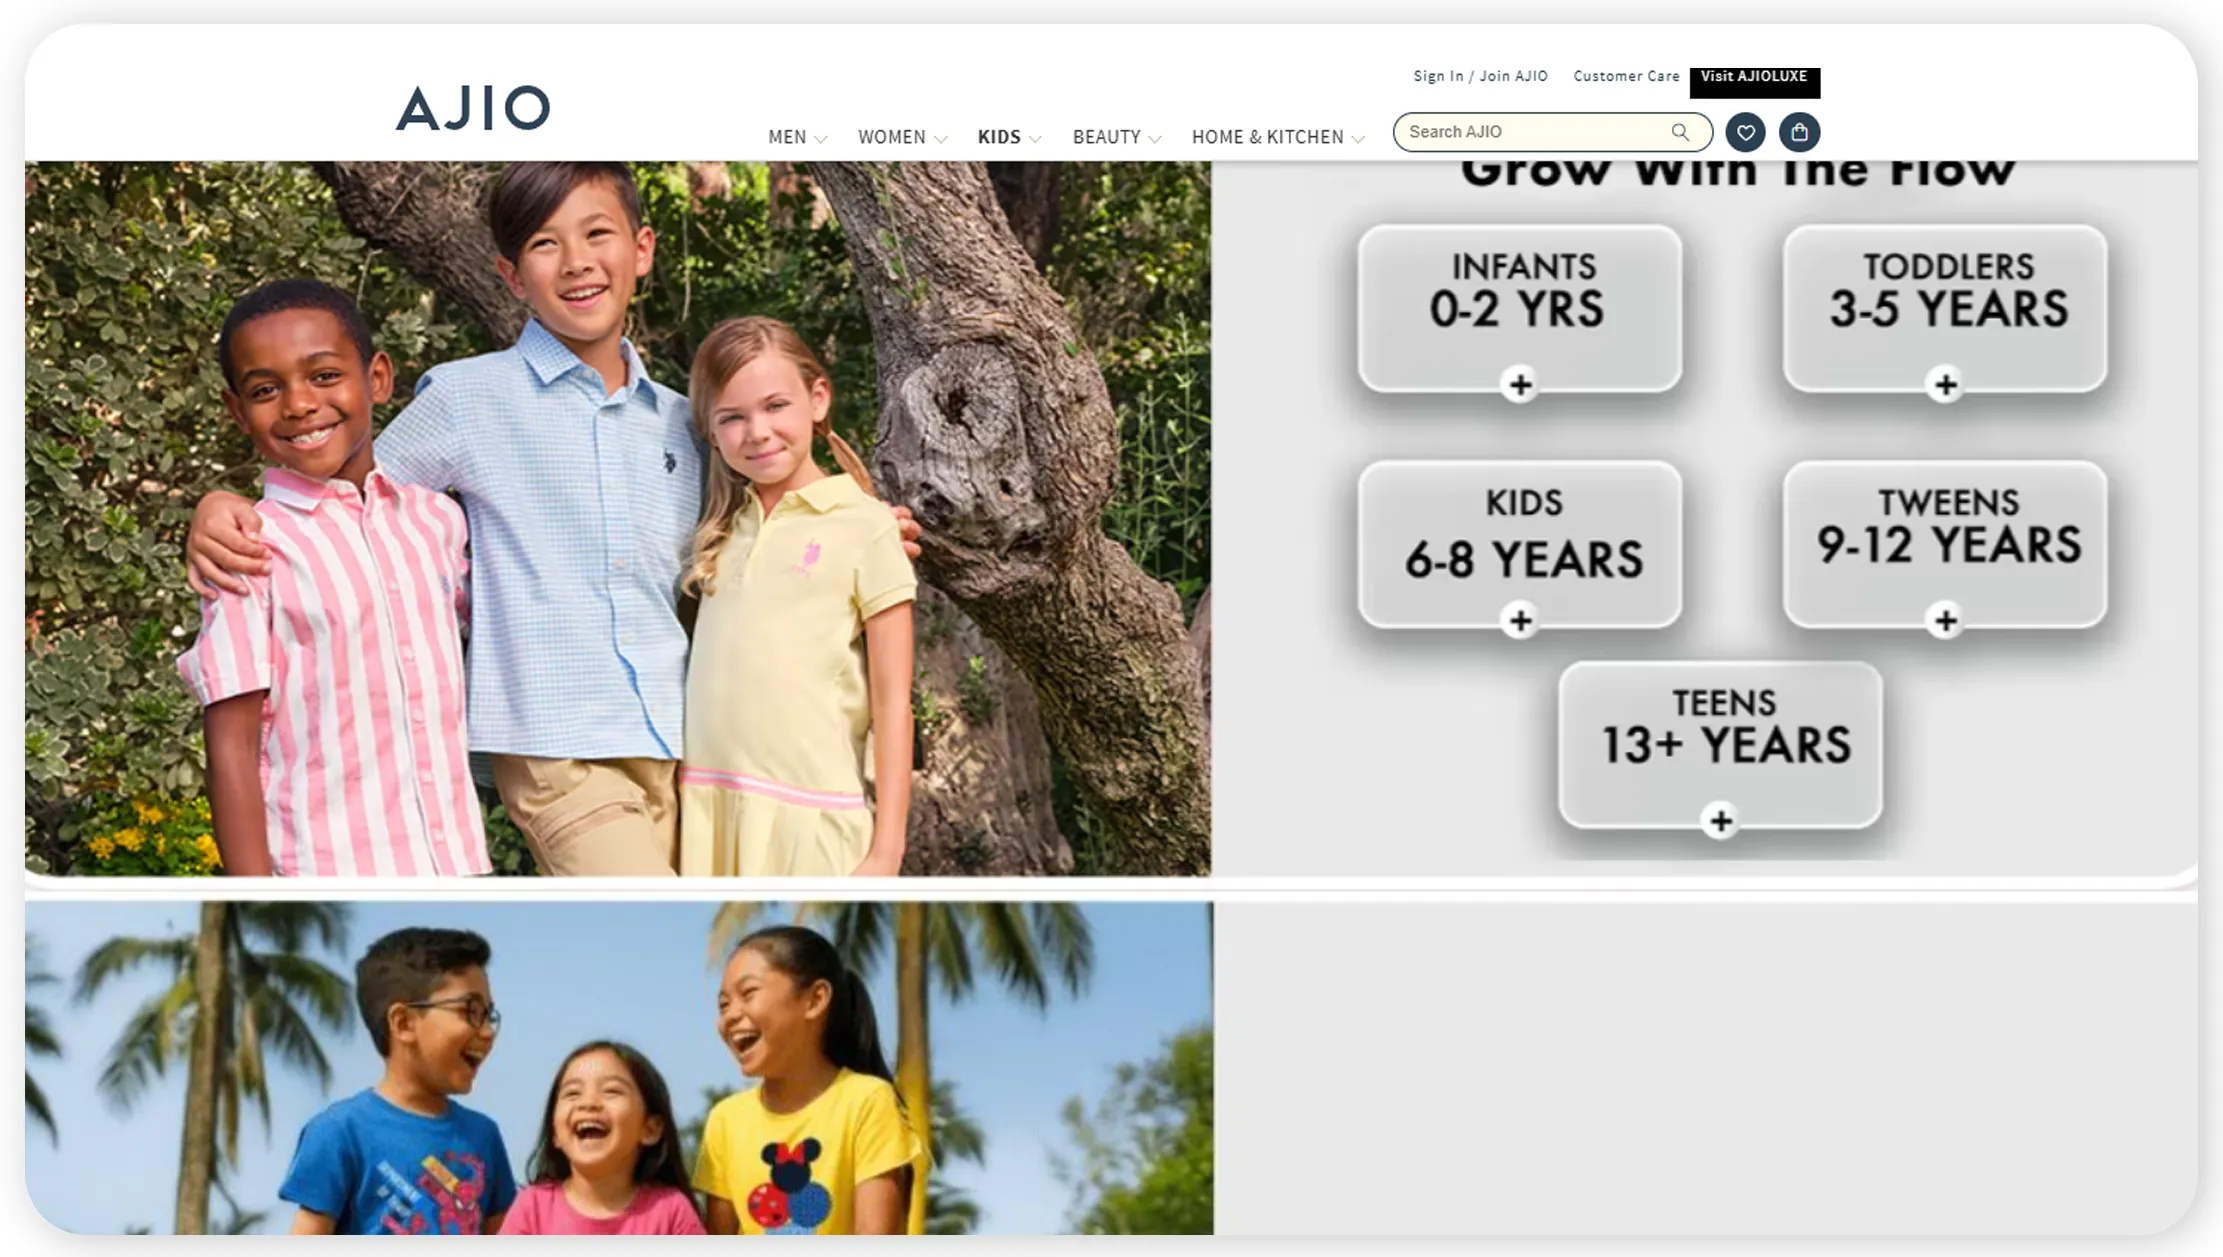
With Web Scraping Ajio product pricing data, businesses can monitor fashion trends, seasonal collections, and pricing strategies across regions.
| Year | SKU Count | Avg Apparel Price (₹) | Discount Rate (%) | Key Highlights |
|---|---|---|---|---|
| 2020 | 200K | 1200 | 15% | Core apparel & footwear catalog |
| 2021 | 220K | 1250 | 16% | Curated collections introduced; engagement +15% |
| 2022 | 250K | 1300 | 17% | Regional collections; Tier-2 city sales +25% |
| 2023 | 280K | 1325 | 18% | Seasonal promotions account for 20% of revenue |
| 2024 | 320K | 1350 | 18% | Premium & sustainable fashion introduced |
| 2025 | 350K | 1380 | 18% | SKU expansion & optimized discount rates |
Structured Ajio data helps businesses analyze competitiveness, identify pricing gaps, and forecast demand for fashion categories effectively.
Multi-Site Analysis
The Multi-site eCommerce scraping research report integrates insights from Amazon, Flipkart, Ajio, Meesho, and Myntra to provide a holistic view of the Indian online retail market.
| Category | Amazon (%) | Flipkart (%) | Ajio (%) | Meesho (%) | Myntra (%) |
|---|---|---|---|---|---|
| Electronics | 35 | 30 | 5 | 5 | 5 |
| Fashion | 10 | 10 | 15 | 5 | 20 |
| FMCG/Other | 5 | 5 | 5 | 10 | 5 |
| Regional Sales | 15 | 10 | 5 | 10 | 5 |
Cross-platform insights allow businesses to benchmark competitors, evaluate top categories, and make informed decisions regarding product assortment, pricing, and marketing campaigns.
Cross-Platform Product & Price Analysis
Using Cross-platform product and price analysis in India, businesses can monitor pricing, SKU performance, and revenue contributions across platforms.
| Year | Electronics Price Variation (%) | Fashion Price Variation (%) | Top SKU Revenue Contribution (%) | Key Highlights |
|---|---|---|---|---|
| 2020 | 10 | 12 | 60% | Electronics dominate |
| 2021 | 12 | 15 | 62% | Seasonal pricing adjustments |
| 2022 | 13 | 16 | 63% | Multi-platform sales monitoring |
| 2023 | 10 | 15 | 61% | Dynamic pricing for fashion |
| 2024 | 11 | 17 | 64% | Top SKUs drive majority revenue |
| 2025 | 10 | 15 | 65% | Cross-platform analytics improve decision-making |
These insights optimize pricing, inventory management, and marketing strategies to ensure businesses stay competitive across multiple platforms.
Real Data API provides scalable, accurate, and structured solutions for multi-platform e-commerce analysis. Using the Meesho Scraping API, businesses can:
- Extract product, pricing, and review data efficiently
- Benchmark offerings and monitor competitors
- Forecast demand and optimize product launches
- Integrate insights into dashboards for real-time decision-making
Product Data Scrape reduces manual effort and accelerates market research, providing reliable insights for strategic decision-making across India's top e-commerce platforms.
Conclusion
Accurate, structured, and real-time data is essential for competitive analysis in e-commerce. Using Amazon Scraper and tools that scrape product data from Amazon, Flipkart, Ajio, Meesho & Myntra, businesses can monitor pricing strategies, product trends, and regional preferences. Multi-site scraping enables cross-platform insights, operational efficiency, and data-driven decisions, ensuring businesses maintain a competitive edge.
Leverage Real Data API today to extract actionable product insights and optimize pricing and competitive strategies across India's top e-commerce platforms.


