Introduction
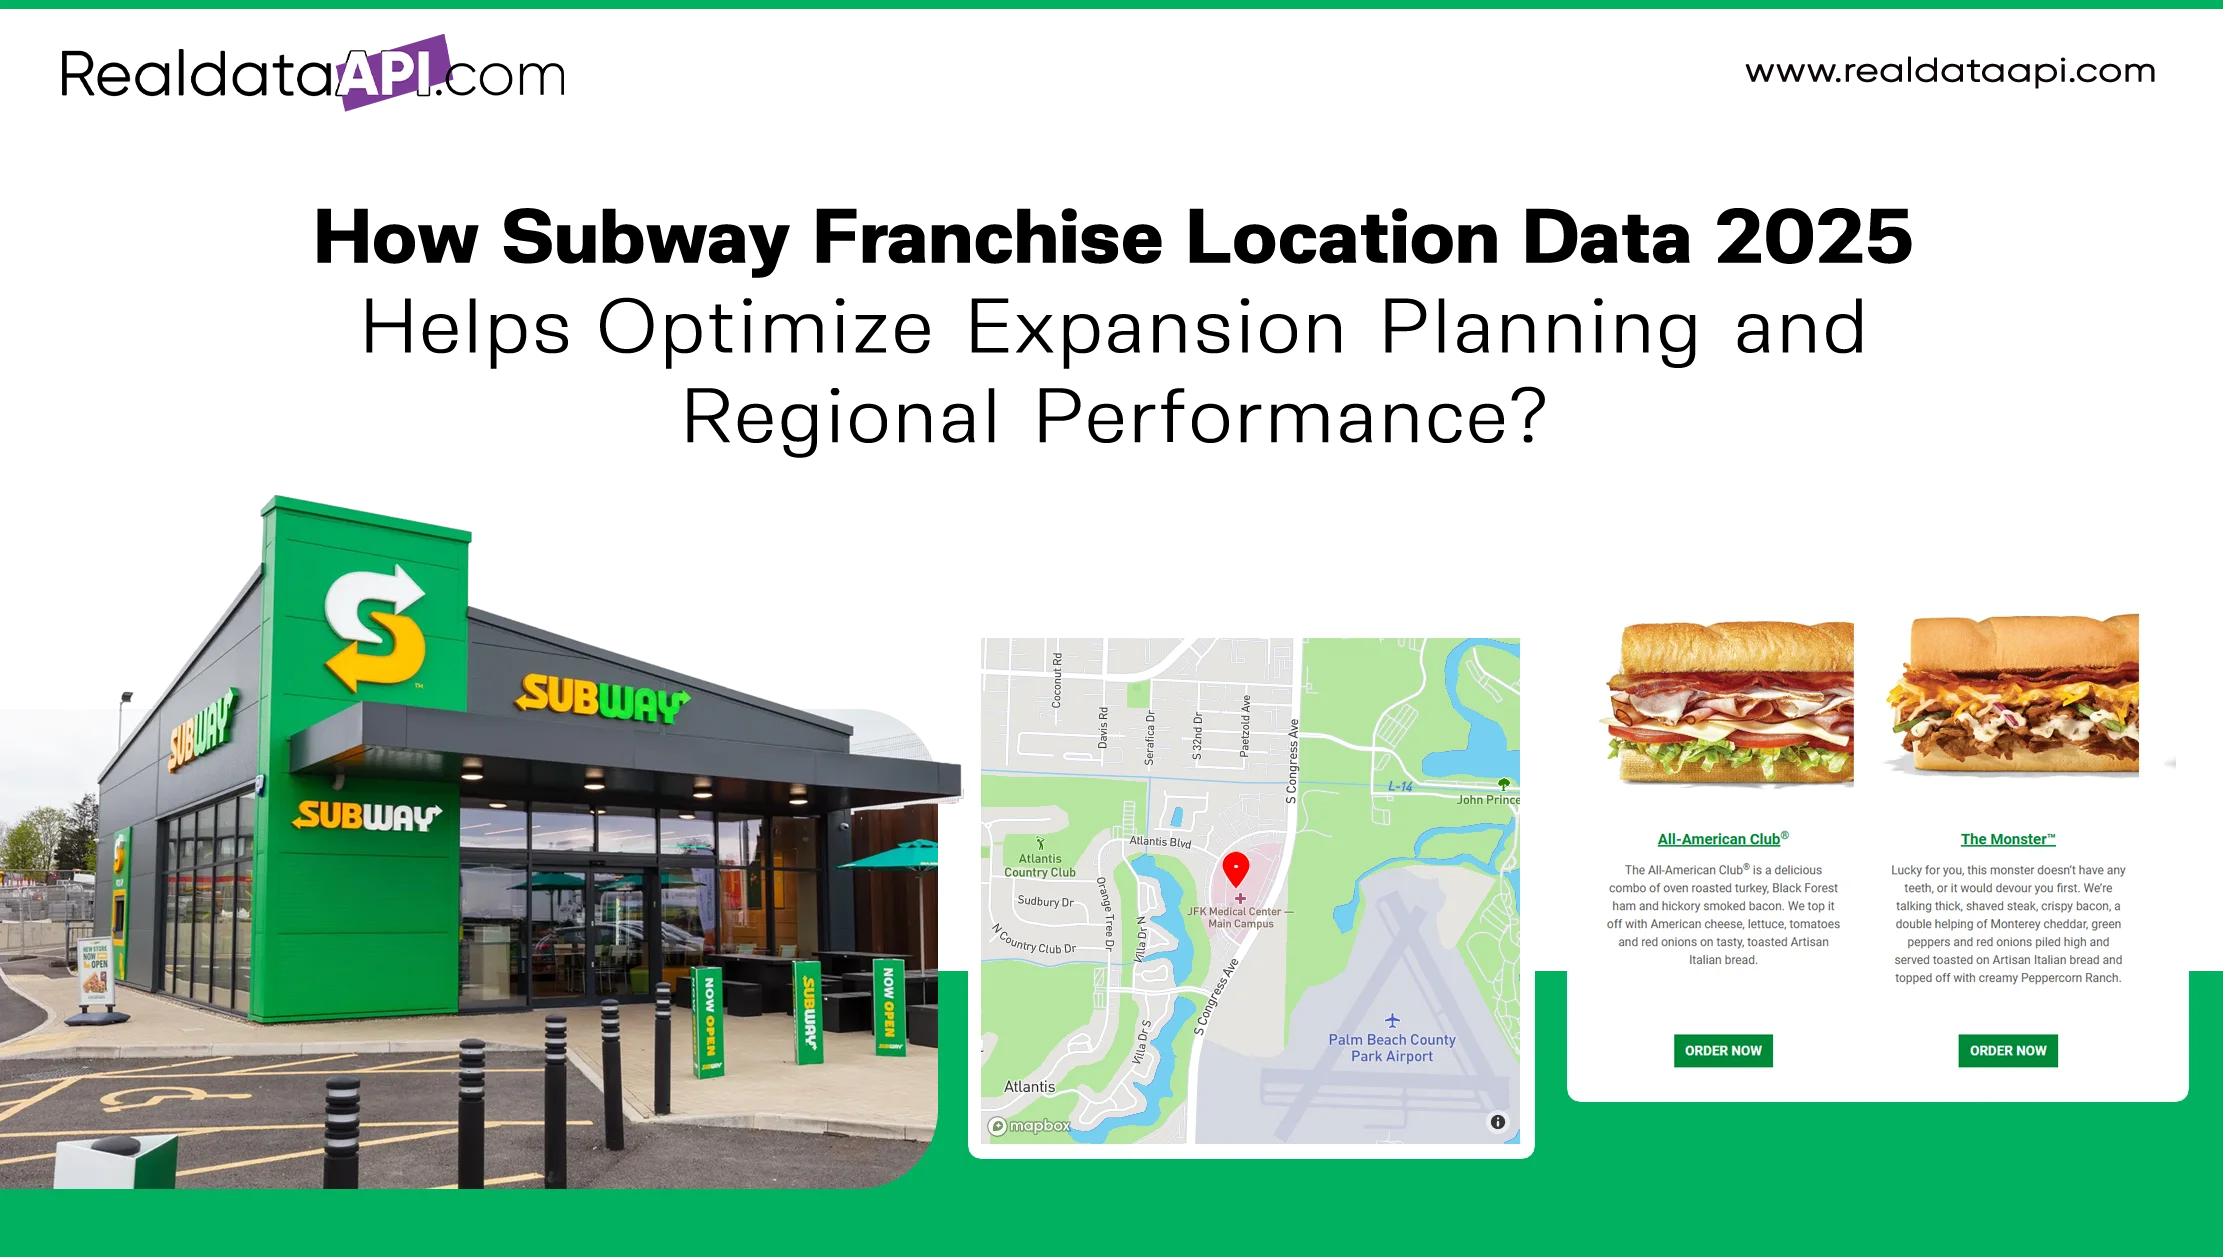
In the ever-evolving landscape of quick-service restaurants (QSRs), strategic expansion decisions are only as strong as the data behind them. For brands and investors looking to enter or scale within the U.S. QSR market, Subway franchise location data 2025 offers unparalleled insight into territory saturation, ZIP-code level gaps, and high-performing micro-markets. Real Data API enables businesses to scrape Subway store locations USA, providing clean, structured, and ready-to-integrate data for analytical models.
With over 20,000 outlets in the United States alone, Subway remains one of the most expansive and accessible food chains. Yet, growth today demands precision. Using Subway store locator data scraping, brands can extract key metrics like operational radius, delivery zones, urban vs. suburban density, and proximity to other fast-food competitors. From Subway GPS coordinates scraping to extract Subway outlet addresses by ZIP code or region, access to accurate spatial intelligence can make the difference between a high-ROI launch or a miscalculated market entry.
This blog explores how leveraging Subway franchise location data 2025 through Real Data API helps optimize site selection, monitor store overlap, and support regional expansion in competitive territories.
Understanding Regional Density with Subway Franchise Location Data

To identify underserved areas or oversaturated regions, investors rely on Subway ZIP code outlet data and historical distribution patterns. Between 2020 and 2025, Subway saw a 6% drop in total U.S. outlets, shrinking from 23,801 stores in 2020 to approximately 22,300 by 2025. However, regional growth persisted in suburban Midwest zones and fast-developing Southern urban hubs. By using Subway franchise location data 2025, clients can map density, analyze competitor adjacency, and pinpoint ZIPs with favorable demographics.
For example, ZIP code 75070 in McKinney, Texas, saw a 12% uptick in foot traffic after Subway introduced a third outlet in 2023—validated via Subway USA store address database and POS overlays. Businesses can use this level of data to test cannibalization risks and benchmark store saturation levels.
Extracting Location Intelligence with Subway Store Map Data Extraction

Mapping tools and Subway store map data extraction help visualize proximity analytics. Brands often compare locations against drive-time thresholds, public transport access, and pedestrian traffic. From 2020 to 2025, areas with a Subway store located within a 3-minute walk from public transit hubs had 18% higher lunch-hour footfall than stores outside this radius.
With Real Data API, users can access geocoded formats for every Subway outlet, updated quarterly. This includes Subway GPS coordinates scraping that supports geospatial dashboards and AI-based expansion modeling. Whether your focus is urban high-density clusters or suburban commuter belts, precise mapping data can aid in visualizing market feasibility and investment returns.
Unlock regional growth insights—use Subway store map data extraction to optimize location planning, boost visibility, and drive smarter expansion decisions.
Get Insights Now!Subway POS Data for Delivery Zone Optimization

Delivery performance is becoming a core KPI for QSR success. By integrating Subway POS data for delivery zones, brands can understand operational reach and evaluate demand elasticity across ZIP codes. Between 2021 and 2025, delivery volumes for Subway outlets within 5-mile zones increased by 26%, while those beyond 8 miles saw diminishing returns.
Delivery-focused investors can use this insight to identify delivery blind spots, align staffing needs, and reduce logistical overhead. By combining this with Subway business directory scraping and localized menu variations, brands can forecast delivery loads more effectively and plan for dark kitchen setups where gaps exist.
Leveraging Subway Chain Outlet Data Extraction for Franchise Planning

Through Subway chain outlet data extraction, Real Data API clients can build a complete franchise database—complete with outlet age, area served, and menu SKU history. From 2020–2025, newer Subway locations (opened post-2022) showed a 15% higher monthly revenue on average, often owing to better placement and modernized interiors.
Potential franchisees and investors can analyze store longevity, performance by establishment date, and proximity to educational institutions, business parks, and major intersections. This level of precision aids not just in selecting a site but in forecasting ROI based on historically verified patterns.
Extract Subway Restaurant and Menu Data for Regional Customization

Data-led menu planning drives regional success. Real Data API enables clients to Extract Subway Restaurant and Menu Data to study localized offerings, price point variations, and regional taste adaptations. For example, from 2020 to 2025, Subway locations in California showed a 22% higher sale volume for vegan SKUs, prompting other regions to test-launch plant-based menus.
Using web scraping for QSR locations tied to menu data allows marketing teams to align promotions with regional preferences. Pricing elasticity can also be tested with menu scraping tied to ZIP-level demand data. Whether you're a franchisee or food delivery aggregator, extracting this intelligence gives an edge.
Customize your offerings—extract Subway restaurant and menu data to tailor regional menus, improve customer satisfaction, and drive localized sales growth.
Get Insights Now!Subway Location Data API and Real-Time Monitoring

The Subway location data API by Real Data API offers programmatic access to updated outlet listings, metadata tags, and geospatial formats. Clients can integrate it into GIS dashboards, CRM tools, or market planning portals.
The API supports multiple formats—JSON, CSV, XML—and fetches new records as soon as they're updated on official portals. This ensures your expansion planning tools or retail mapping models stay current. It also syncs with Subway business directory scraping and Extract Nykaa E-Commerce Product Data for broader eCommerce-to-location strategy alignment.
Why Choose Real Data API?

Real Data API isn’t just a scraper—it’s a scalable data delivery partner built for enterprise-grade expansion needs. Whether you're targeting multi-location QSR chains or niche food franchises, our tools deliver Subway franchise location data 2025 in real-time and in usable formats. We specialize in retail spatial analytics, helping investors uncover what competitors are doing, where saturation lies, and how to model success based on real outcomes.
Our capabilities range from scrape fast food location data to delivering enriched records that include ratings, reviews, hours of operation, and delivery performance overlays. With a proven track record in building datasets for over 50 food chains—including coffee, pizza, burger, and health food verticals—Real Data API is the gold standard for reliable QSR data extraction.
Conclusion
Expansion is no longer about gut instinct—it’s about data precision. Real Data API empowers businesses to act decisively with access to Subway franchise location data 2025, integrated delivery zone analytics, and custom insights into store density and market readiness. Whether you want to extract Subway outlet addresses, visualize market white spaces, or scrape performance indicators, our platform provides it all.
With Subway location data API, clients gain 24/7 access to the most recent US outlet data, backed by historical insights from 2020–2025. Ready to outpace competitors in the QSR game? Partner with Real Data API to redefine location intelligence for the fast-food industry. Let’s map your next move—one dataset at a time.
Latest posts
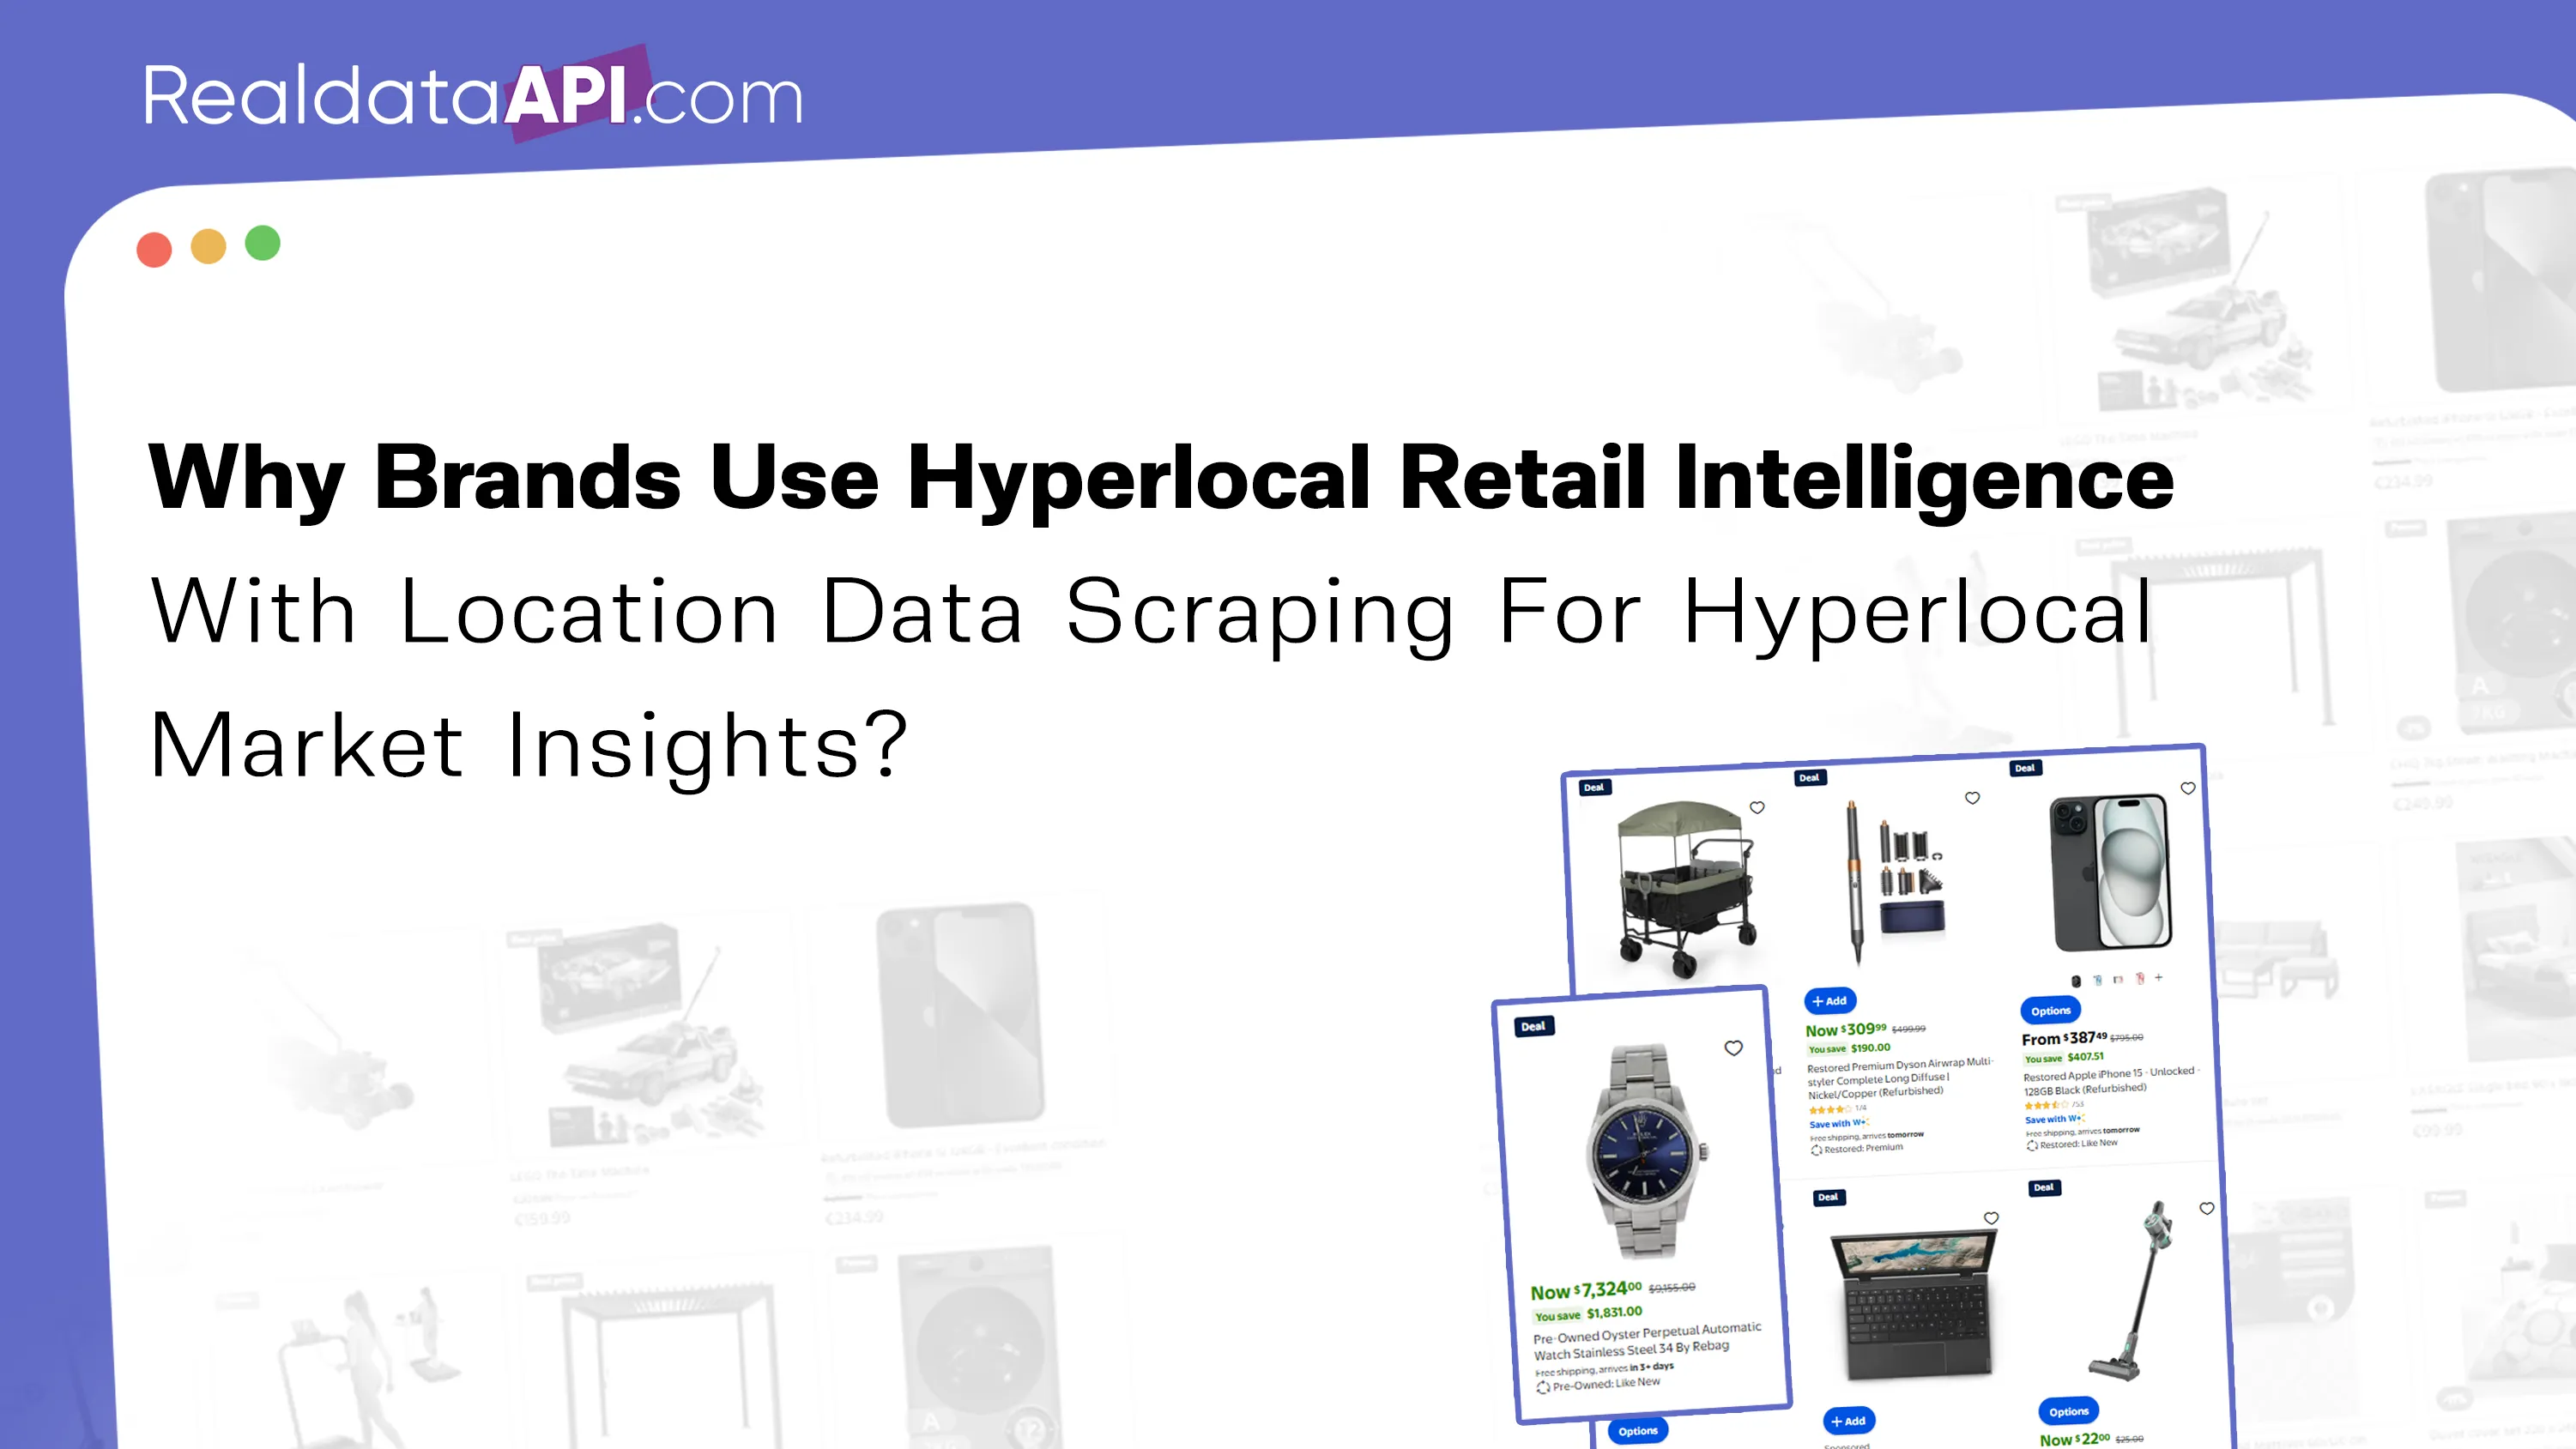
Why Brands Use Hyperlocal Retail Intelligence With Location Data Scraping For Hyperlocal Market Insights?

How To Scrape Product Availability Data For Modern Trade Brands For Better Stock Monitoring And Retail Execution?

How Businesses Can Reduce Lost Sales via Stock-Out Risk Detection Using Retail Data Scraping?
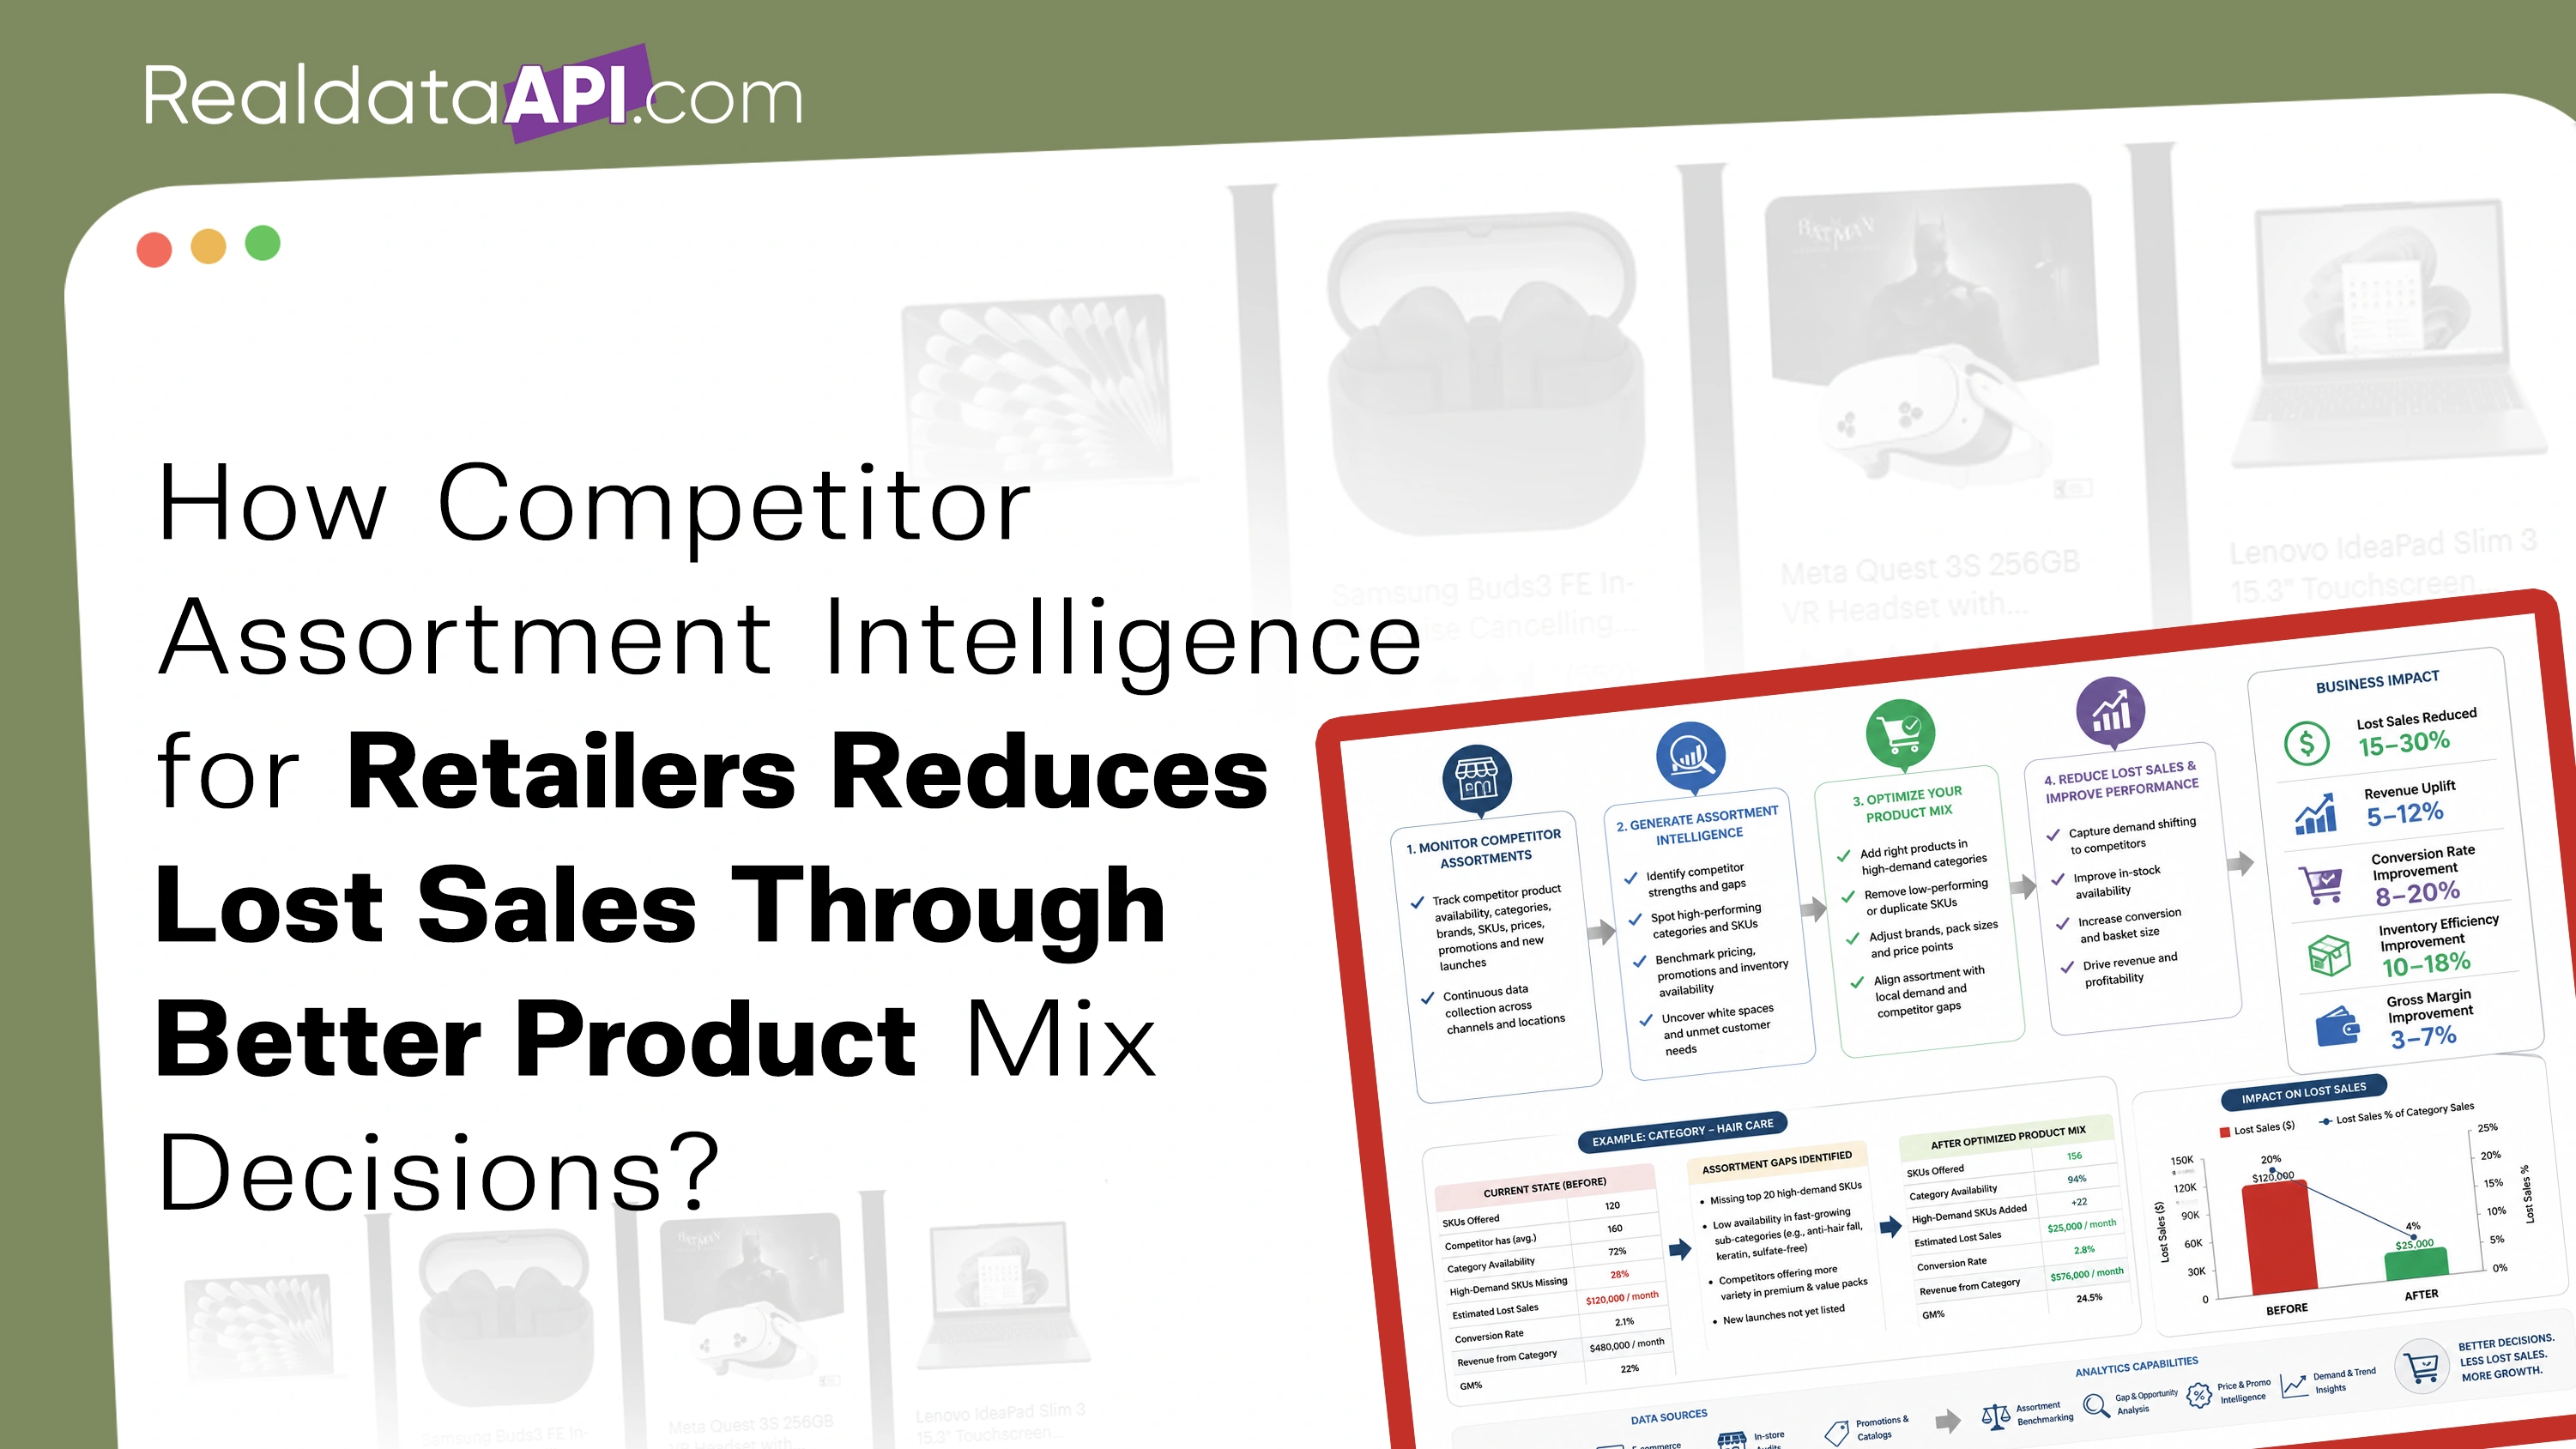
How Competitor Assortment Intelligence for Retailers Reduces Lost Sales Through Better Product Mix Decisions?
Real Data API stands out as one of the premier global companies specializing in web data Scraping and web extraction.


Rating 4.7
Rating 4.7
Rating 4.5
Rating 4.7
Rating 4.7


Disclaimer : RealData API functions solely as an independent data infrastructure and technology solutions provider. We build customized automation workflows designed to collect publicly accessible web data based exclusively on client instructions. RealData API neither owns proprietary datasets nor engages in the sale or redistribution of extracted information. Our operations are limited strictly to lawful public web data processing and never involve unauthorized access to restricted systems or private networks. Any company names, trademarks, logos, or brand references displayed on this website are used purely for demonstrative and illustrative purposes to showcase our technical capabilities and do not imply endorsement, partnership, or affiliation. Use of our platform and services remains subject to our Terms of Service.