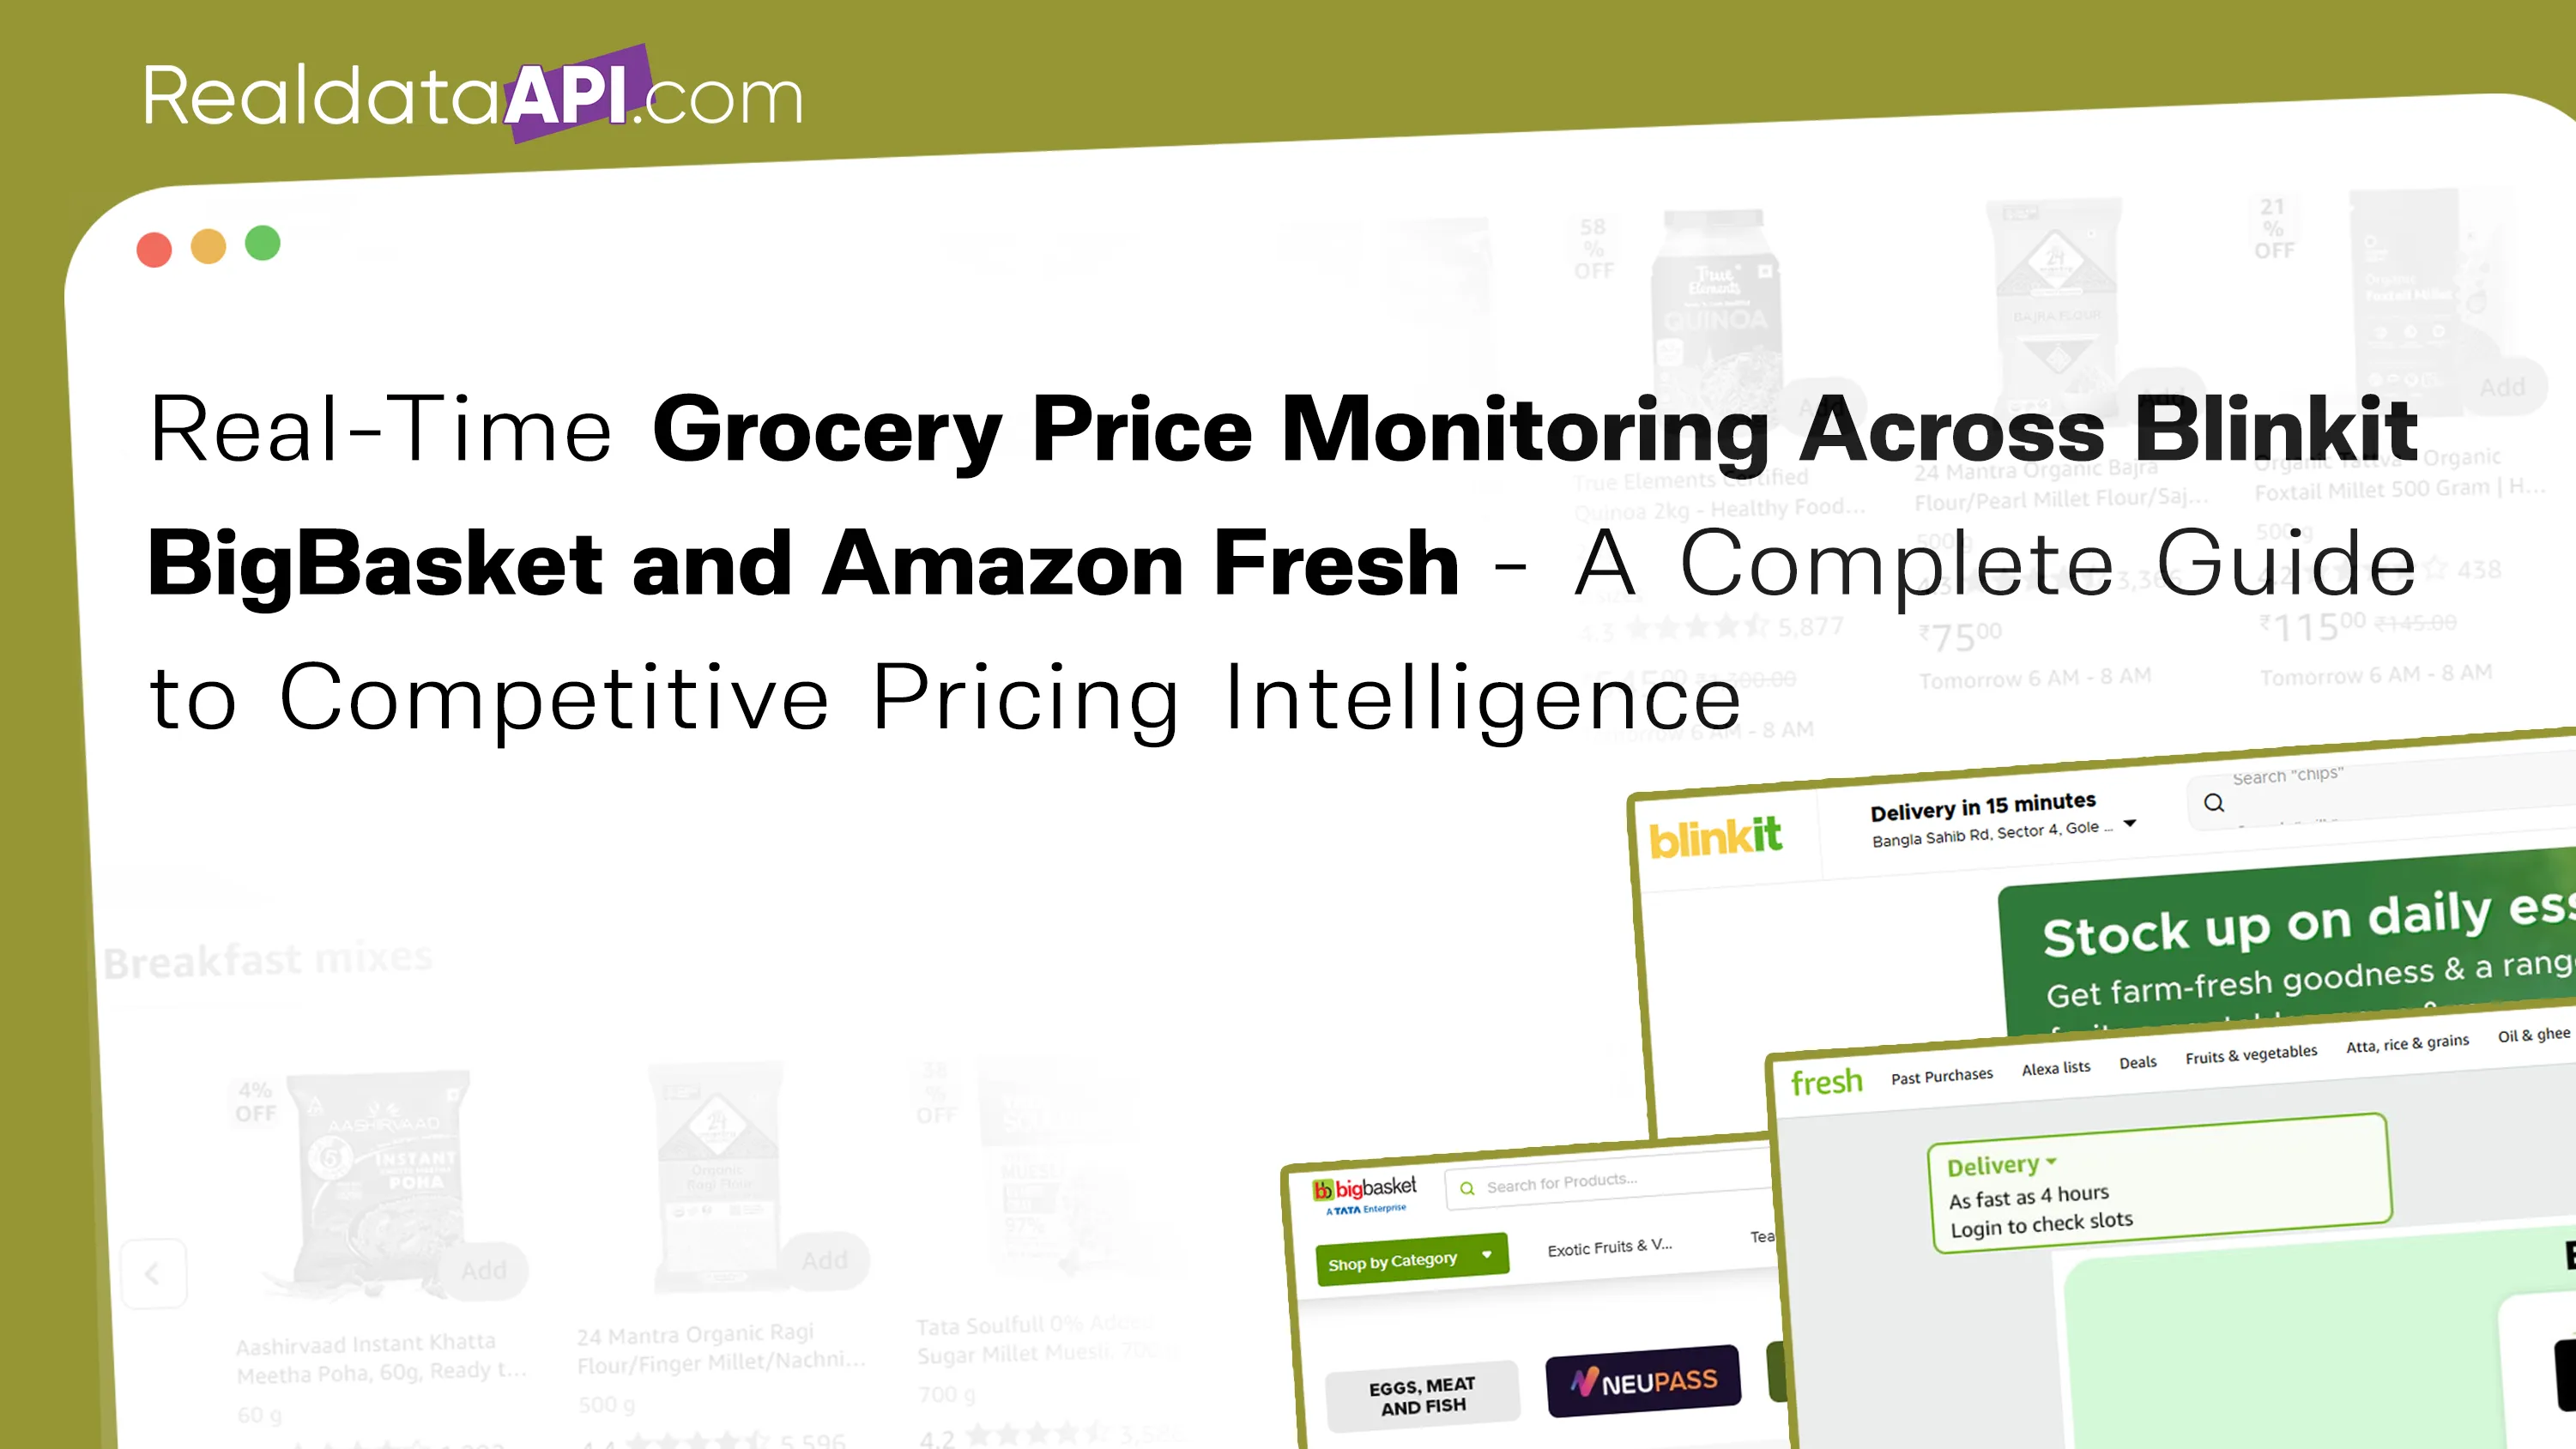
Introduction
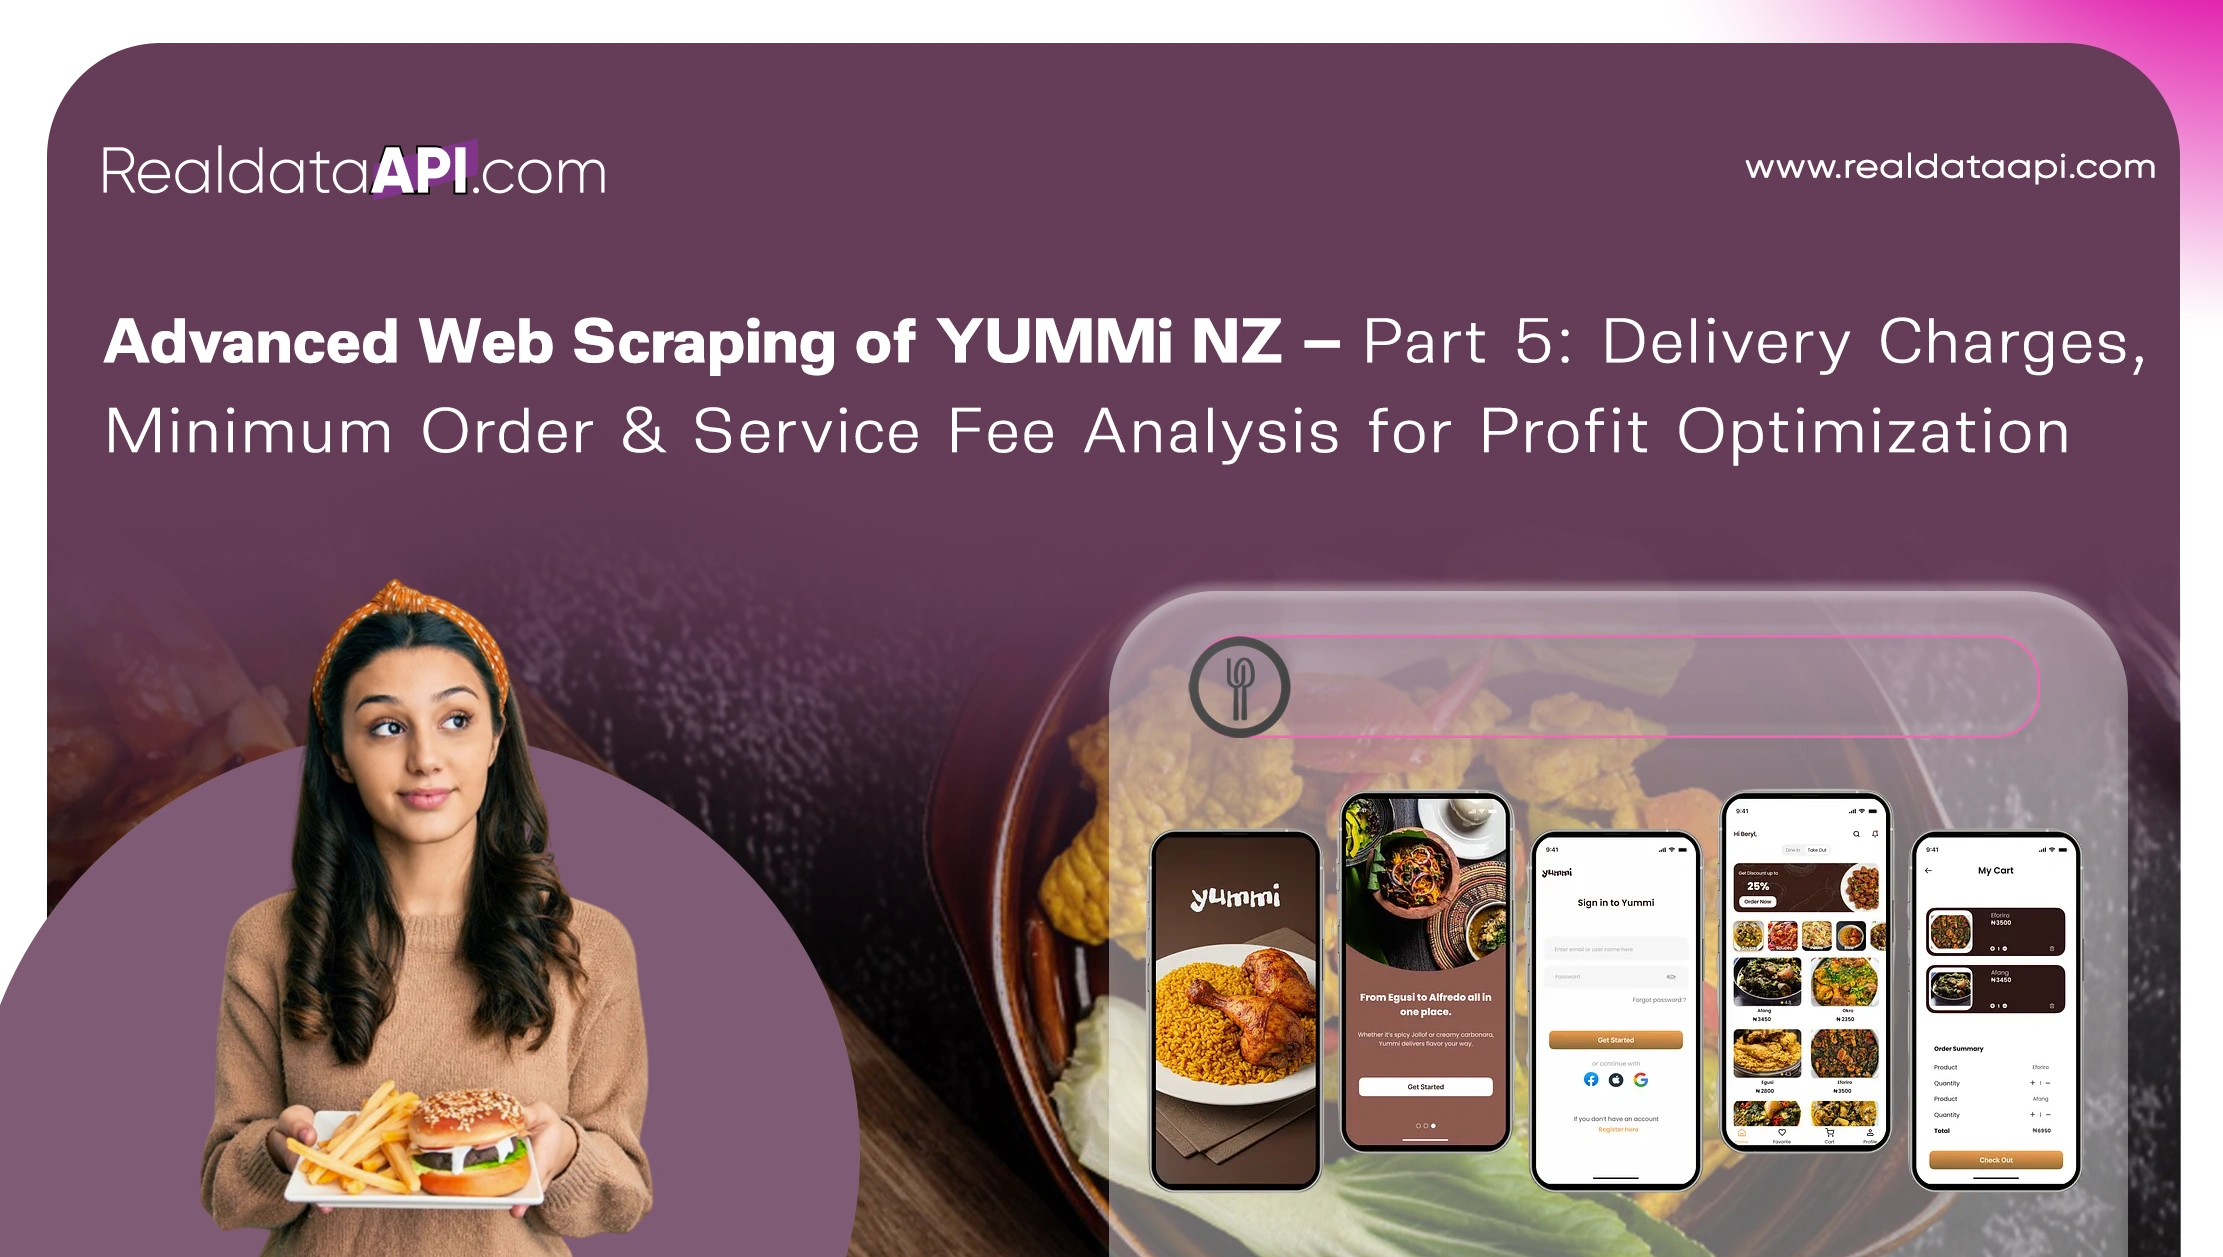
We've reached the final chapter of our 5-part deep dive into advanced Web Scraping Services and food delivery intelligence.
- Part 1: Building the core restaurant and menu dataset
- Part 2: Discount tracking & promotional campaign analysis
- Part 3: Competitive benchmarking using restaurant & menu data
- Part 4: Location-based scraping for city-wise insights
Now in Part 5, we focus on one of the most revenue-critical layers of food delivery analytics:
Delivery Charges, Minimum Order Thresholds & Service Fee Intelligence for Profit Optimization
While menu prices attract customers, fees determine margins.
Delivery charges, service fees, and minimum order requirements are powerful levers that impact:
- Conversion rate
- Average order value (AOV)
- Customer retention
- Competitive positioning
- Platform profitability
Through structured scraping and analytics — powered naturally by scalable infrastructure like Real Data API — businesses can turn fee data into actionable profit strategy.
Let's break it down.
Why Fee Intelligence Matters More Than Menu Pricing
Most businesses obsess over:
- Menu price comparison
- Discount percentages
- Rating benchmarks
But customers see something else at checkout:
- Delivery fee
- Service fee
- Small order fee
- Minimum spend requirement
Two restaurants may offer identical burger pricing — but if one has a lower delivery fee or minimum order threshold, it will likely convert better.
From a business standpoint, fee optimization influences:
- Margin per order
- Order frequency
- Basket size
- Competitive edge
This is why delivery fee scraping is not just operational data — it's profit intelligence.
Understanding Fee Components on YUMMi NZ

Publicly visible delivery platforms typically display:
- Delivery Fee
- Minimum Order Requirement
- Service Fee (if applicable)
- Small Order Surcharge
- Free Delivery Threshold
- Estimated Delivery Time
On YUMMi Delivery API, these components may vary based on:
- Restaurant
- Location
- Distance
- Promotional campaign
- Time of day
To build profit models, scraping systems must capture these variables systematically.
Structuring a Delivery Fee Data Model
To analyze fees effectively, your Food Dataset must be standardized.
| Field | Description |
|---|---|
| restaurant_id | Unique identifier |
| city | Location |
| suburb | Delivery area |
| delivery_fee | Standard delivery charge |
| min_order_value | Minimum order threshold |
| service_fee | Platform fee (if visible) |
| small_order_fee | Extra charge under threshold |
| free_delivery_flag | Boolean indicator |
| delivery_time_estimate | ETA |
| timestamp | Data capture time |
By structuring fee data consistently, businesses can build margin and elasticity models.
With Real Data API pipelines, this dataset can refresh daily or weekly, enabling historical trend analysis.
Delivery Fee Benchmarking by City

Delivery charges often vary geographically due to:
- Distance logistics
- Traffic conditions
- Demand density
- Competitive intensity
City-wise analysis helps answer:
- Which city has the highest average delivery fee?
- Are premium cities charging more consistently?
- Do suburban zones have higher logistical costs?
- Where is free delivery most common?
For example:
- Central urban areas may have lower fees due to density.
- Outer suburbs may show higher delivery surcharges.
- High-competition zones may push fees downward.
Geo-tagged fee scraping (as discussed in Part 4) enhances this benchmarking layer significantly.
Minimum Order Threshold Analysis

Minimum order requirements directly influence Average Order Value (AOV).
Restaurants use thresholds to:
- Increase basket size
- Offset logistics cost
- Improve per-order margin
Scraped insights allow you to calculate:
- Average minimum order per cuisine
- Minimum order by city
- Correlation between threshold and delivery fee
- Threshold variance among competitors
Example questions:
- Do sushi restaurants require higher minimum orders?
- Are burger chains lowering thresholds to increase frequency?
- Does high minimum order reduce promotional reliance?
When combined with promotion data (Part 2), you can detect whether restaurants compensate high minimum orders with discounts.
Service Fee & Hidden Cost Monitoring

Service fees are subtle but powerful.
Even small percentage-based platform fees affect:
- Final cart value
- Customer perception
- Platform margin
Tracking service fee trends allows:
- Transparency benchmarking
- Fee inflation detection
- Platform comparison strategy
With automated scraping infrastructure like Real Data API, changes in fee structures can trigger alerts — especially useful when platforms update pricing logic.
Free Delivery Strategy Mapping

Free delivery is one of the strongest conversion drivers in Food Data Scraping API.
Scraped metrics can measure:
- Percentage of restaurants offering free delivery
- Free delivery threshold amount
- City-wise free delivery penetration
- Time-limited free delivery campaigns
Competitive insight example:
- If 60% of restaurants in Auckland offer free delivery, new entrants may need to match it.
- If only 20% offer it in smaller cities, margin opportunity exists.
Free delivery tracking also connects directly to profitability modeling.
Fee Elasticity & Conversion Impact Modeling

Once delivery fee data is structured, advanced analytics can begin.
Delivery Fee Elasticity
Measure:
- Impact of delivery fee increase on rating trends
- Impact on promotion frequency
- Impact on free delivery campaigns
Minimum Order vs Discount Dependency
Identify whether:
- High minimum order restaurants rely more on discounts
- Low threshold restaurants use delivery fee adjustments instead
Delivery Fee vs Delivery Time Correlation
Are restaurants charging higher fees delivering faster?
These models transform scraped data into executive-level intelligence.
Historical Fee Tracking & Inflation Monitoring
Delivery fees evolve.
Monitoring historical snapshots enables:
- Fee inflation analysis
- Seasonal adjustments
- Post-promotion normalization
- Surge pricing detection
For example:
- Did delivery fees increase during peak seasons?
- Are minimum orders rising annually?
- Are small order fees becoming more common?
Continuous Price Monitoring — automated through Real Data API — ensures no structural shift goes unnoticed.
Profit Optimization Framework Using Scraped Data

Once fee intelligence is available, businesses can apply structured optimization frameworks.
Step 1: Competitive Baseline
Calculate:
- Average delivery fee in city
- Average minimum order
- Average service fee
Step 2: Positioning Strategy
Decide whether to:
- Undercut fees for acquisition
- Maintain parity for margin protection
- Offer dynamic fee structures
- Introduce threshold-based free delivery
Step 3: Margin Simulation
Using scraped benchmarks, simulate:
- Revenue per order
- Fee contribution percentage
- Discount impact on net margin
- Threshold optimization scenarios
With structured API pipelines from Real Data API, these simulations can update in real time.
Identifying Margin Risk Zones
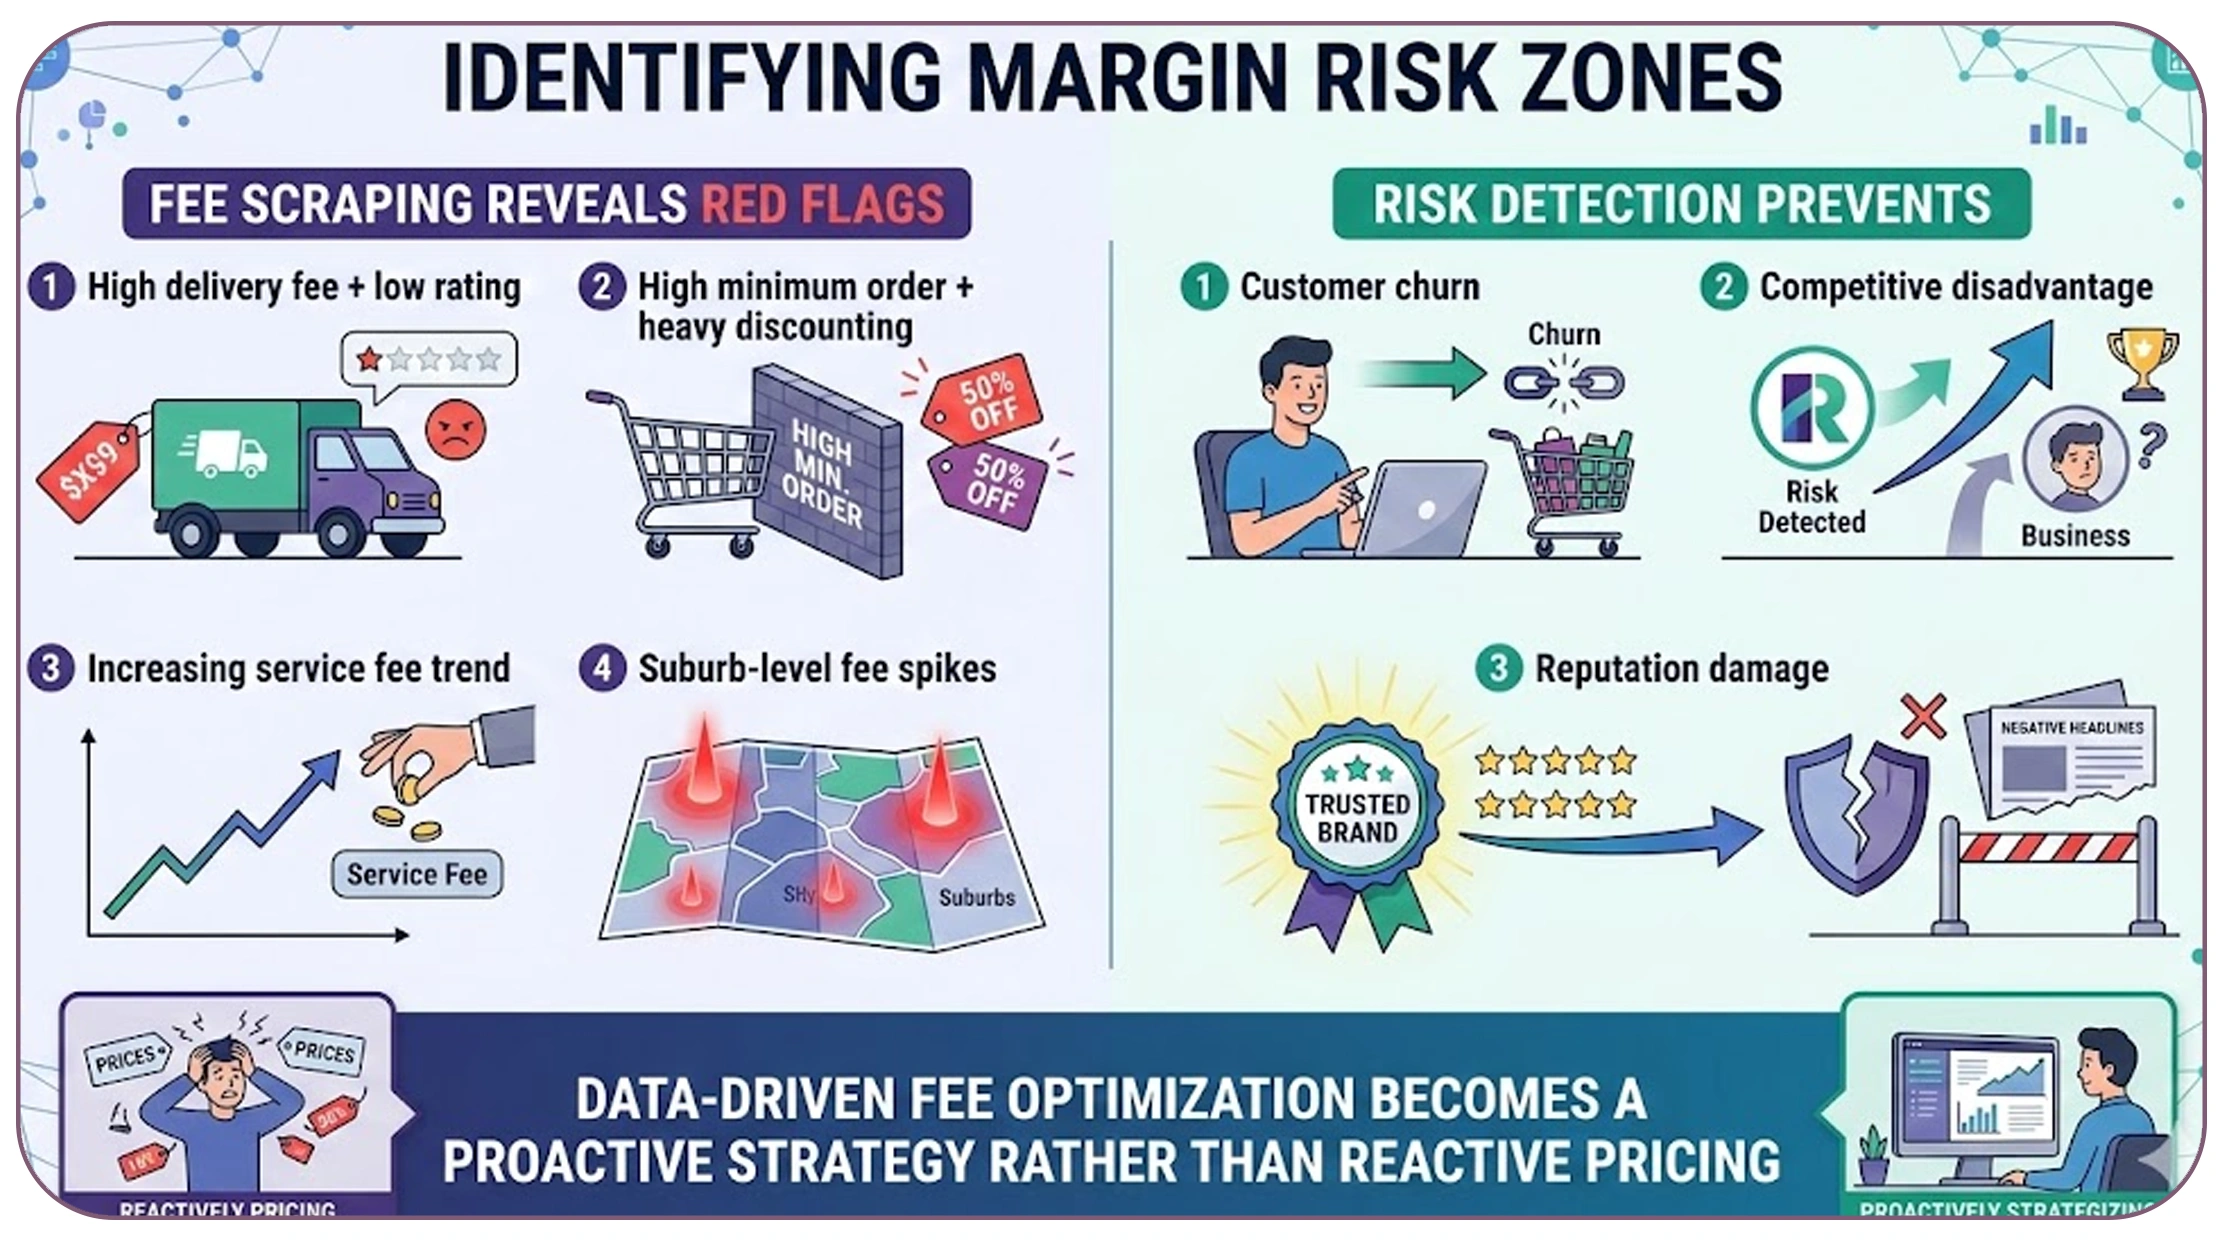
Fee scraping also reveals red flags:
- High delivery fee + low rating
- High minimum order + heavy discounting
- Increasing service fee trend
- Suburb-level fee spikes
Risk detection prevents:
- Customer churn
- Competitive disadvantage
- Reputation damage
Data-driven fee optimization becomes a proactive strategy rather than reactive pricing.
Multi-Dimensional Fee Dashboard

An executive dashboard should include:
- City-wise delivery fee averages
- Minimum order heatmaps
- Free delivery penetration charts
- Service fee trend graphs
- Historical fee change tracker
- Correlation charts (fee vs rating, fee vs promotion frequency)
When powered by Real Data API, dashboards can:
- Auto-refresh
- Trigger alerts
- Compare multiple cities
- Track competitor changes
- Support board-level reporting
Strategic Use Cases of Fee Intelligence
- Restaurant Chains Optimize threshold and delivery fee strategy by city.
- Food Delivery Startups Design competitive onboarding pricing.
- Investors Measure margin sustainability in specific regions.
- Consultants Advise restaurants on profitability improvement.
- Aggregators Detect market-wide fee inflation trends.
Fee intelligence is not just operational data — it is strategic leverage.
Technical Considerations for Fee Scraping
Extracting delivery charges reliably requires:
- Address-based session handling
- Location switching
- Dynamic page parsing
- Anti-bot resilience
- Structured JSON extraction (if available)
- Regular validation checks
Because fees may change based on:
- Time of day
- Distance
- Promotion
- Session state
Scalable infrastructure like Real Data API ensures:
- Clean structured output
- Geo-aware scraping
- Timestamped records
- Reliable historical tracking
- Seamless integration with BI tools
Responsible Data Usage
When collecting fee data:
- Use only publicly accessible information
- Avoid excessive load
- Respect technical constraints
- Maintain compliance with applicable regulations
- Use insights ethically
Responsible scraping supports long-term monitoring stability.
Final Thoughts: Turning Fee Data into Profit Strategy with Real Data API
Throughout this 5-part series, we have transformed public restaurant data into structured competitive intelligence:
- Core dataset extraction
- Promotion tracking
- Competitive benchmarking
- Location-based insights
- Fee and threshold optimization
Part 5 completes the strategic framework.
By systematically scraping delivery charges, minimum order thresholds, and service fees from YUMMi NZ, businesses can:
- Benchmark fee competitiveness
- Detect pricing inflation
- Optimize AOV strategy
- Reduce churn risk
- Improve margin forecasting
- Design smarter free delivery campaigns
However, manual tracking is inefficient and unreliable.
To maintain competitive advantage, businesses need:
- Automated scraping pipelines
- Geo-aware session management
- Historical data storage
- Real-time fee monitoring
- Structured API-ready outputs
This is where Real Data API becomes a critical infrastructure layer.
By integrating Real Data API into your food delivery analytics workflow, you can:
- Continuously monitor fee changes
- Capture city-wise fee variations
- Track threshold adjustments
- Detect emerging competitive shifts
- Feed clean data into analytics dashboards
Real Data API transforms static scraping into scalable, production-grade data intelligence.
Latest posts

How Quick Commerce Data Scraping for Digital Shelf Intelligence Helps Brands Win Shelf Space in 2026
Scrape Zepto Data for new Product Launch for CPG brands - Track Availability, Pricing, and Consumer Trends
How Brands Optimize Pricing, Inventory, and Market Analysis with Quick Commerce Data APIs for Retail Brand Needs

How FMCG Brands Use FMCG Pricing Analytics Data Scraper for Nestlé Maggi and Pepsi Pricing Intelligence
Real Data API stands out as one of the premier global companies specializing in web data Scraping and web extraction.


Rating 4.7
Rating 4.7
Rating 4.5
Rating 4.7
Rating 4.7


Disclaimer : RealData API functions solely as an independent data infrastructure and technology solutions provider. We build customized automation workflows designed to collect publicly accessible web data based exclusively on client instructions. RealData API neither owns proprietary datasets nor engages in the sale or redistribution of extracted information. Our operations are limited strictly to lawful public web data processing and never involve unauthorized access to restricted systems or private networks. Any company names, trademarks, logos, or brand references displayed on this website are used purely for demonstrative and illustrative purposes to showcase our technical capabilities and do not imply endorsement, partnership, or affiliation. Use of our platform and services remains subject to our Terms of Service.