

Introduction
In today's hyper-competitive digital retail landscape, data accuracy and speed define success. Brands, sellers, and analysts rely on real-time intelligence to react to rapid price fluctuations, inventory shifts, and consumer demand changes. This is where Amazon API for product pricing and inventory analysis becomes a game changer, enabling automated access to structured, decision-ready insights. Combined with a robust Amazon Scraper, businesses can move beyond manual tracking and fragmented reports. Instead, they gain continuous visibility into pricing movements, stock availability, and listing performance—helping them optimize strategies, reduce risks, and stay competitive in a fast-evolving e-commerce ecosystem.
The Evolution of Competitive Price Intelligence

Between 2020 and 2026, e-commerce pricing dynamics have changed dramatically. Pandemic-driven online demand accelerated automation, while inflation and supply chain volatility made static pricing models obsolete. Retailers increasingly turned to automated systems to monitor competitors and adjust strategies in near real time.
The adoption of Amazon pricing and inventory scraping has grown steadily as companies realized the value of granular visibility into stock levels and pricing behavior. According to industry estimates, automated price monitoring adoption rose from 35% in 2020 to a projected 78% by 2026.
Global Adoption of Automated Pricing Intelligence (2020–2026)
.webp)
| Year | Adoption Rate (%) | YoY Growth |
|---|---|---|
| 2020 | 35 | – |
| 2021 | 42 | +20% |
| 2022 | 51 | +21% |
| 2023 | 60 | +18% |
| 2024 | 68 | +13% |
| 2025 | 73 | +7% |
| 2026 | 78 | +7% |
With consistent monitoring, businesses can identify out-of-stock competitors, detect price wars early, and react before margins erode—turning data into a strategic advantage rather than a reactive measure.
Turning Raw Listings into Retail Intelligence
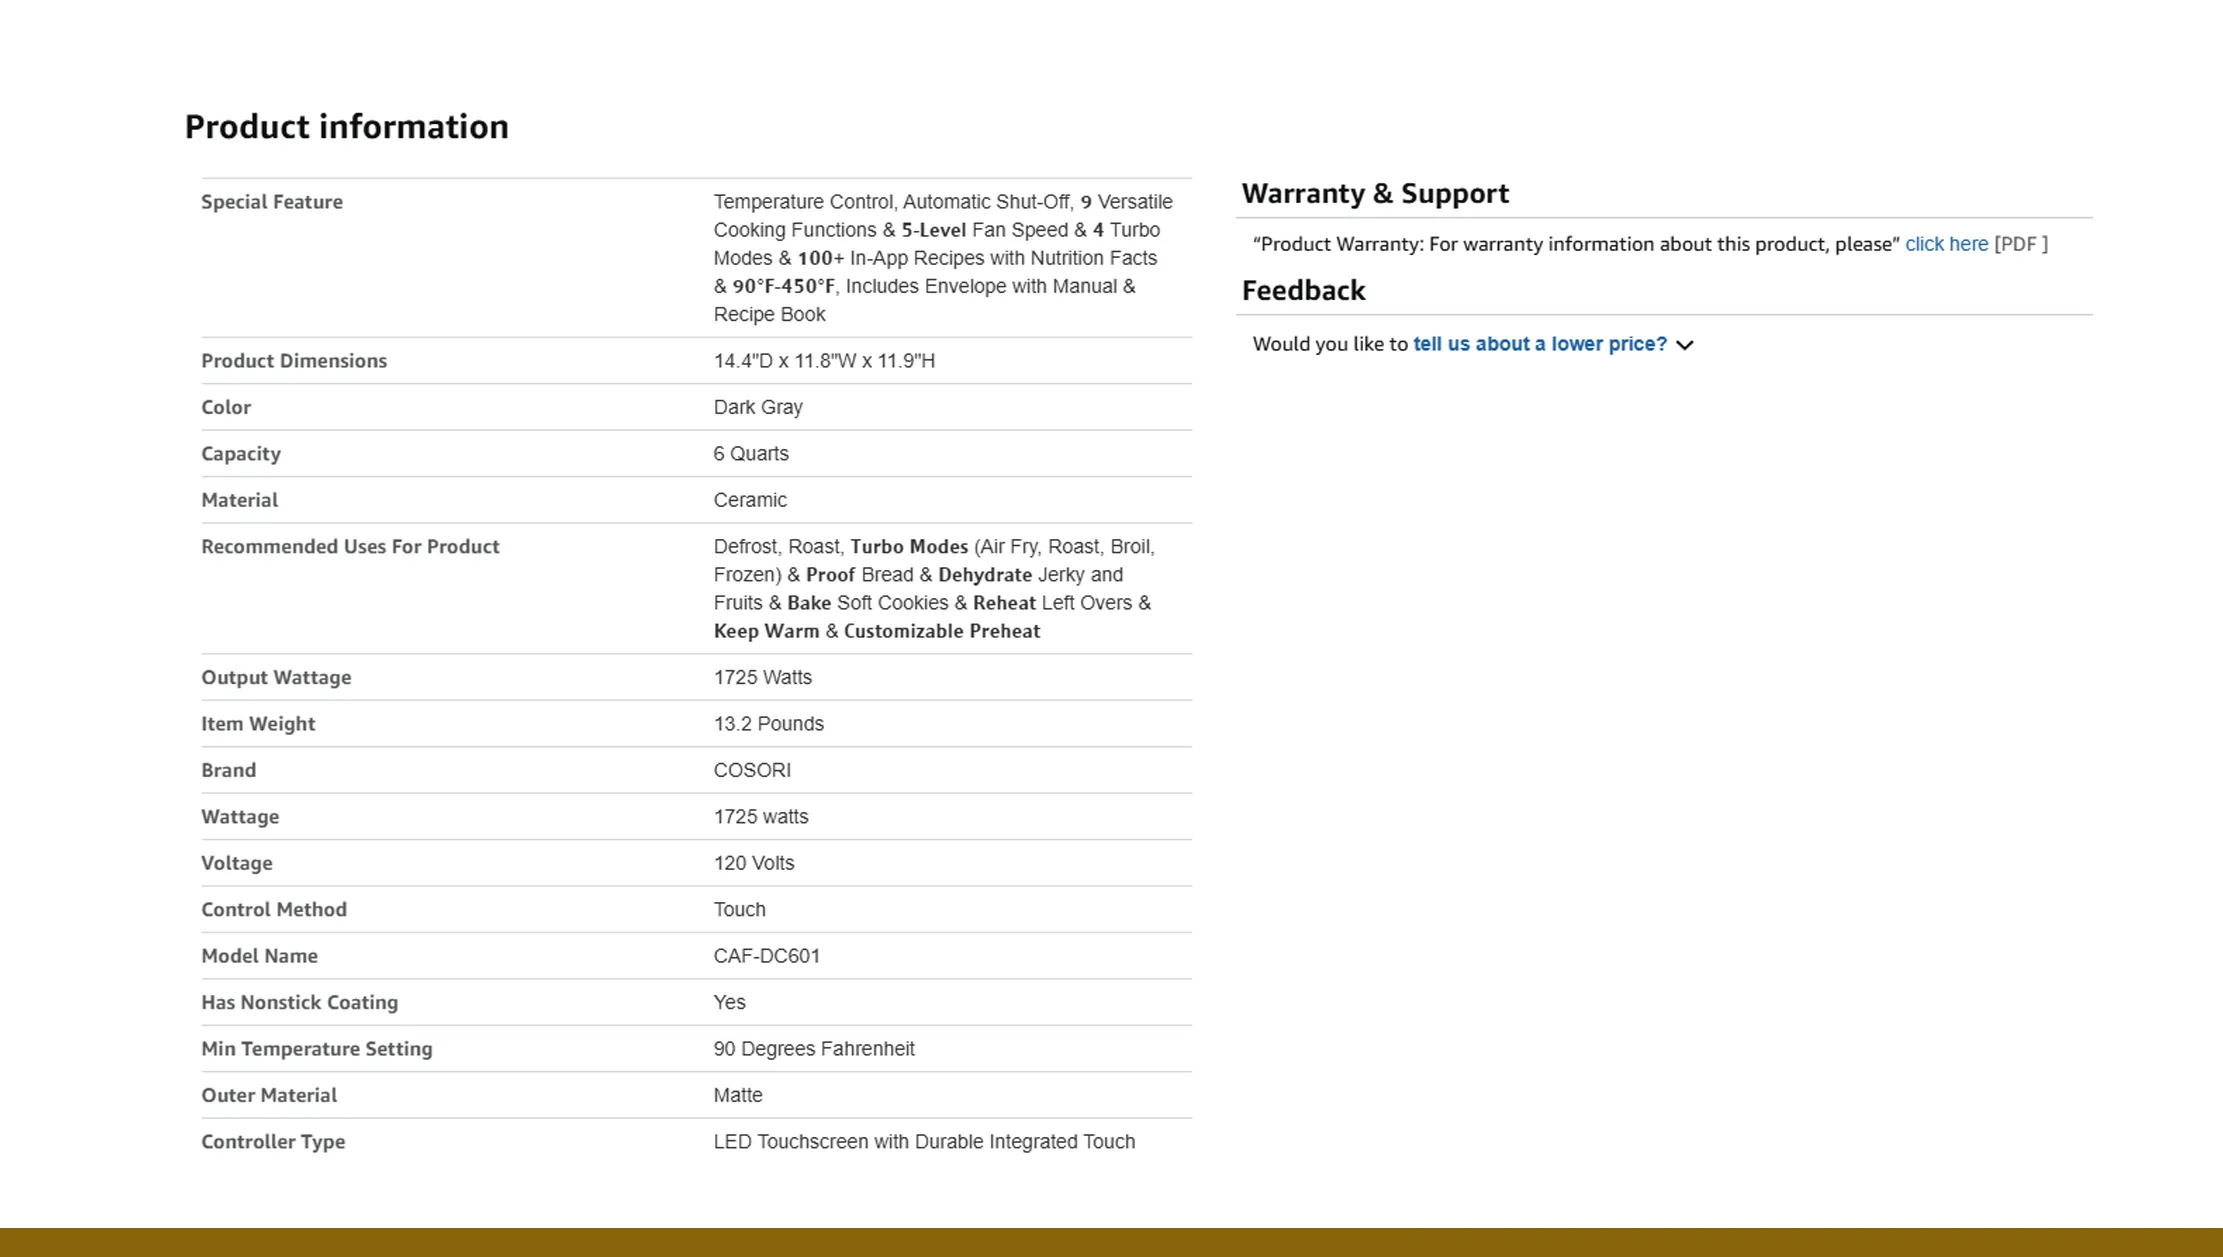
Raw marketplace data has little value unless it is structured, contextualized, and analyzed. Modern retailers increasingly rely on automated pipelines for extracting Amazon product data for retail analytics, allowing them to translate listings into actionable metrics.
From 2020 to 2026, the focus shifted from simple price checks to holistic analytics that include historical pricing, inventory velocity, seller count changes, and fulfillment types. This deeper analysis enables brands to forecast demand, optimize replenishment cycles, and identify underperforming SKUs.
Retail Analytics Maturity Growth (2020–2026)
| Metric Tracked | 2020 | 2026 (Projected) |
|---|---|---|
| Price History | 55% | 92% |
| Inventory Trends | 40% | 85% |
| Seller Competition | 33% | 80% |
| Buy Box Analytics | 28% | 76% |
By structuring product-level data into dashboards and models, companies gain foresight instead of hindsight—leading to smarter merchandising and pricing decisions across regions and categories.
Understanding Listing-Level Market Signals
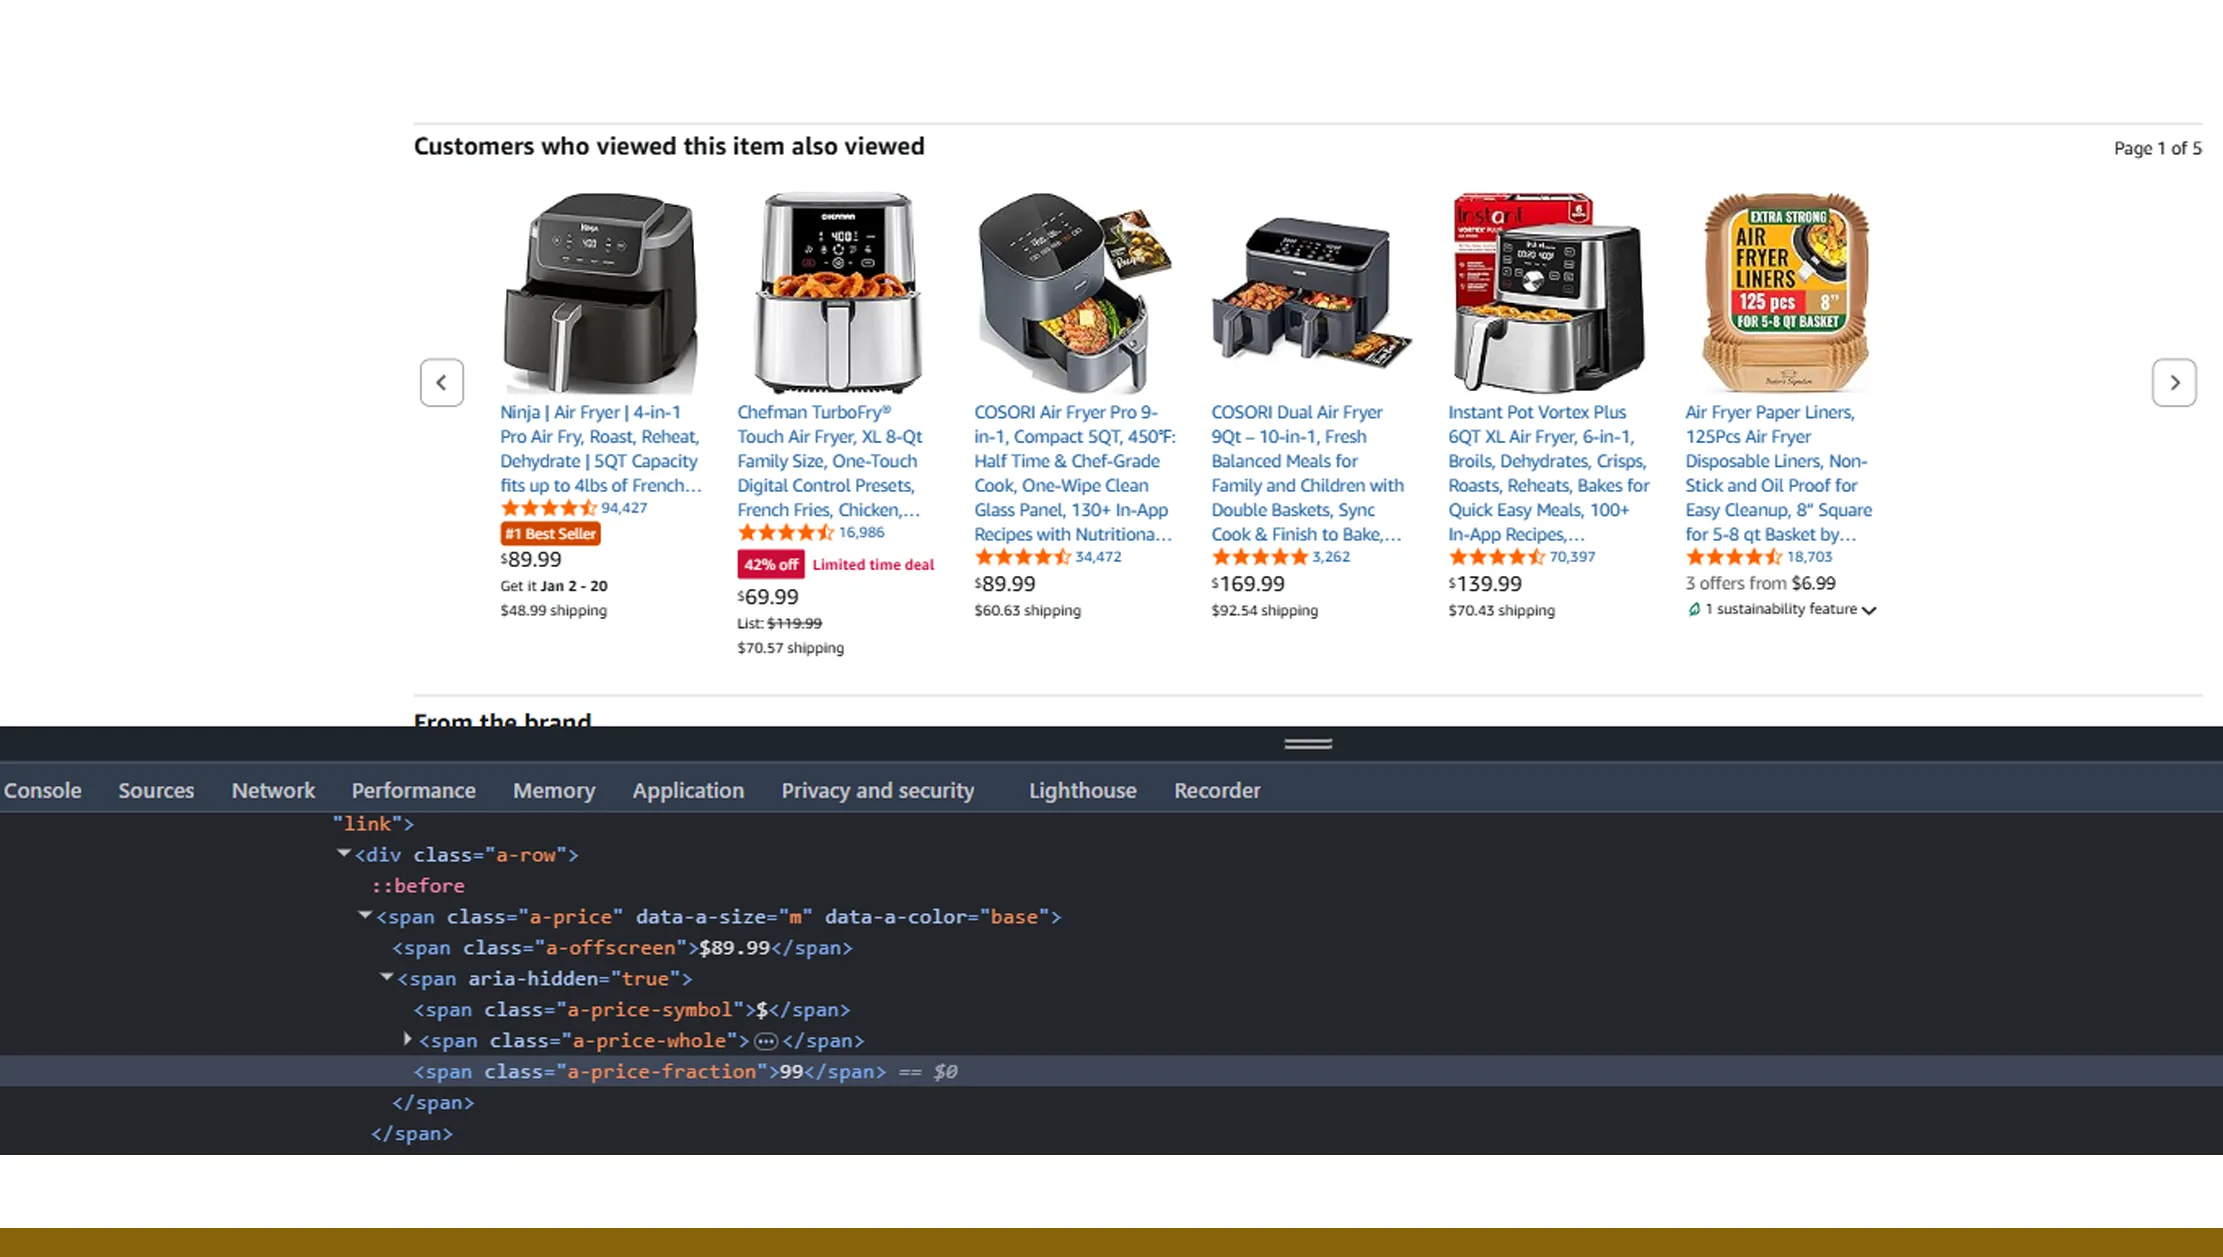
Product listings are dynamic entities that reflect real-time market behavior. Each change in title, price, availability, or seller count sends a signal about competition and demand. Businesses that Scrape Amazon product listings data gain early access to these signals.
Between 2020 and 2026, listing volatility increased by over 60%, driven by third-party sellers, dynamic repricing tools, and frequent stock fluctuations. Monitoring these changes allows sellers to identify seasonal demand spikes, detect unauthorized sellers, and benchmark performance across categories.
Average Monthly Listing Changes per Product (2020–2026)
| Year | Avg. Price Changes | Avg. Stock Status Changes |
|---|---|---|
| 2020 | 4 | 2 |
| 2021 | 6 | 3 |
| 2022 | 7 | 4 |
| 2023 | 9 | 5 |
| 2024 | 11 | 6 |
| 2025 | 12 | 7 |
| 2026 | 14 | 8 |
This granular visibility transforms listings from static pages into strategic data points that inform pricing, promotions, and inventory planning.
Building Scalable Data Pipelines
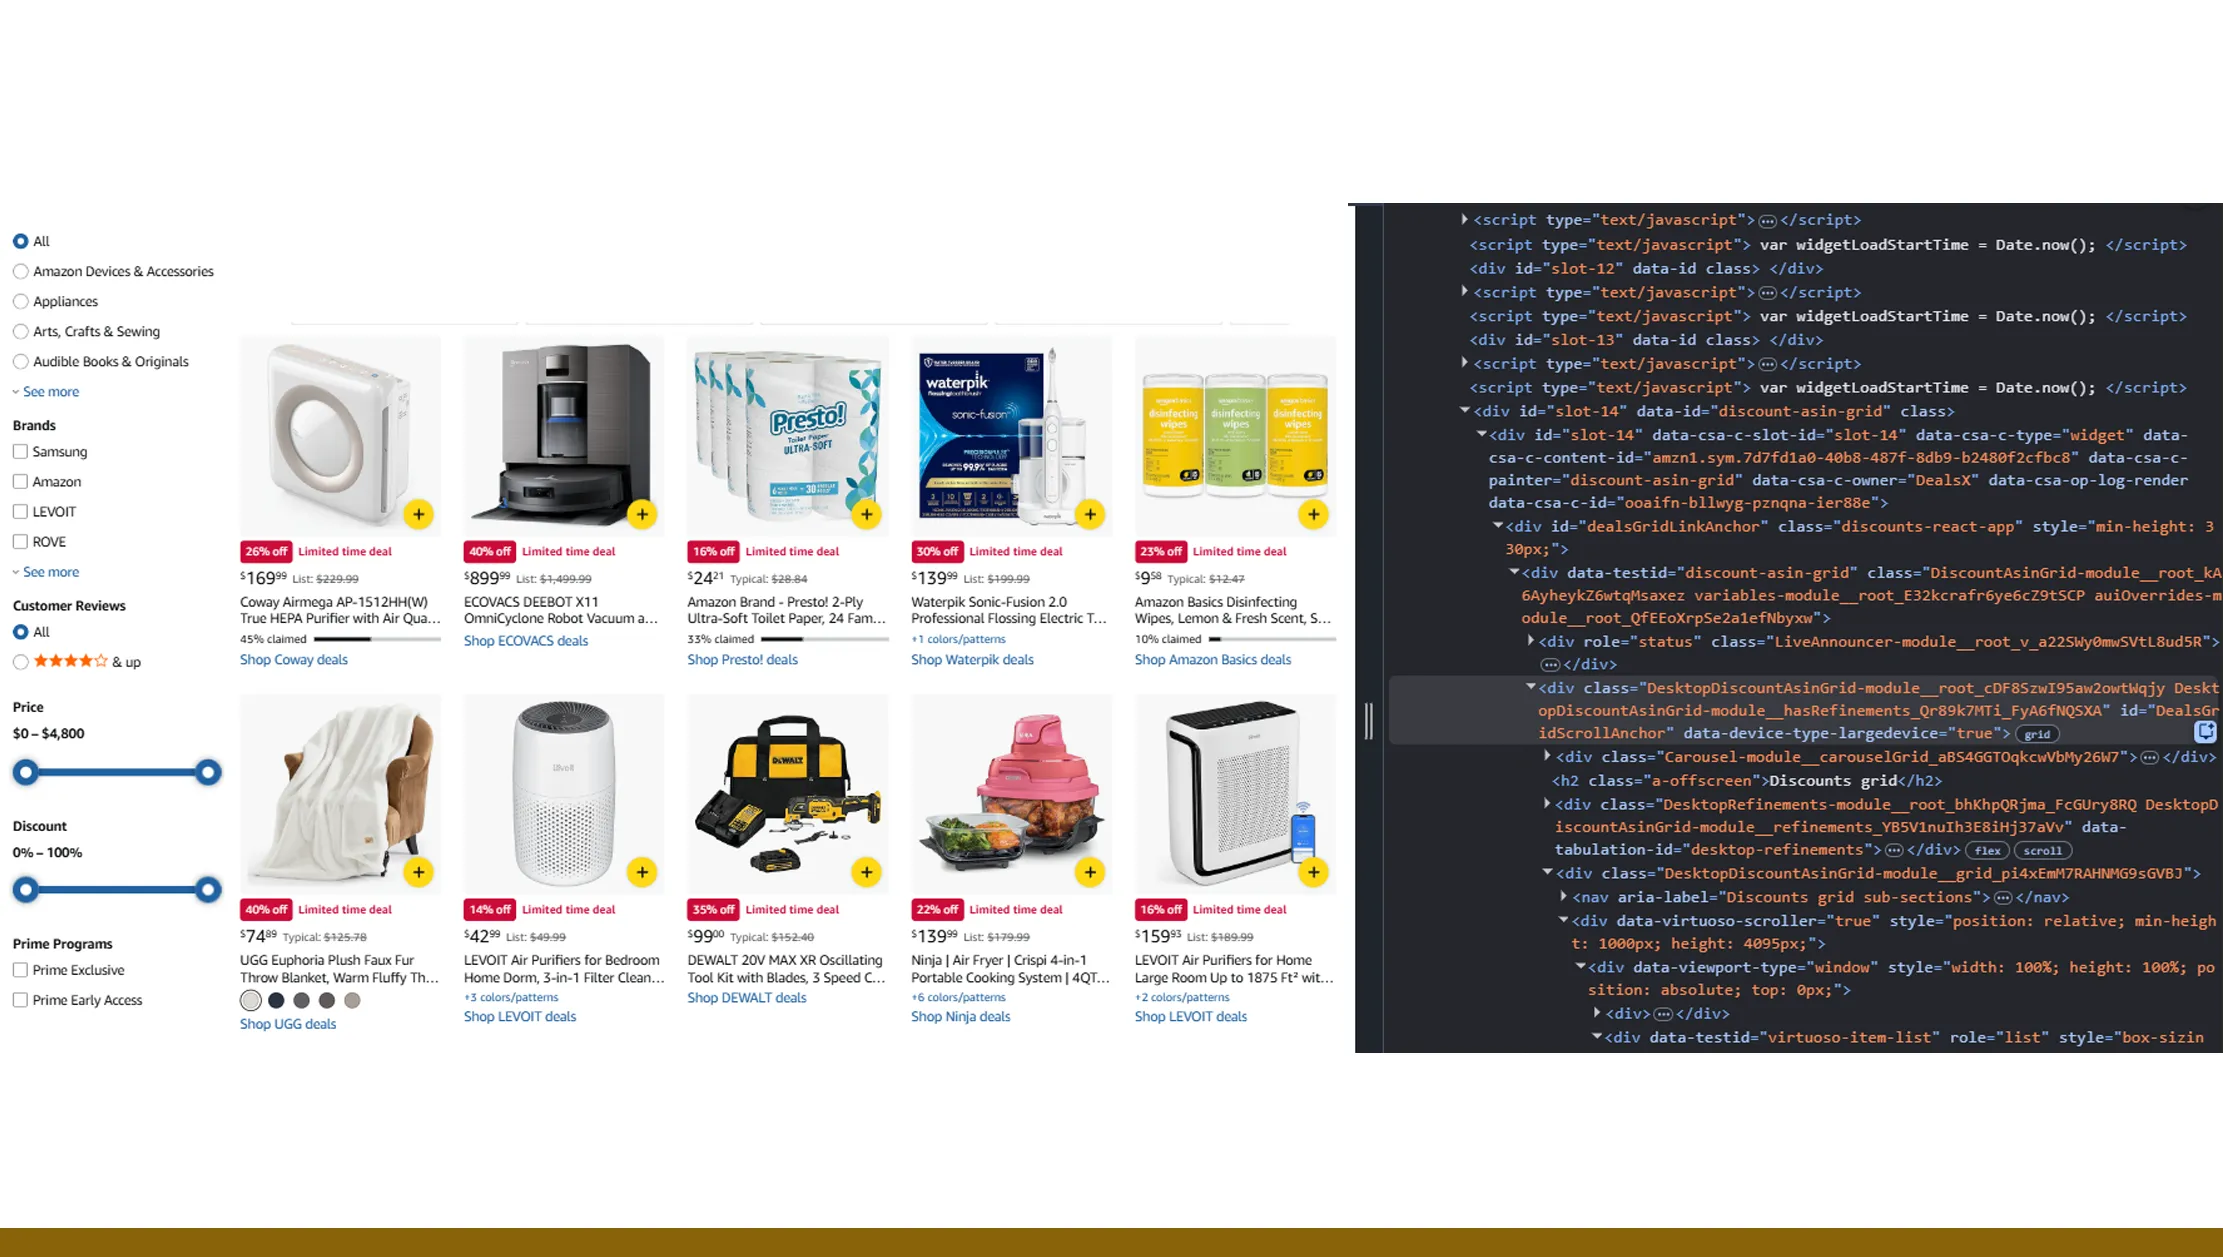
Manual data collection simply cannot scale with the size and complexity of modern marketplaces. Automated pipelines powered by Amazon API data collection provide structured, reliable, and repeatable access to marketplace intelligence.
From 2020 onward, enterprises increasingly migrated from custom scripts to API-driven solutions that support scheduling, error handling, and standardized outputs. By 2026, over 70% of mid-to-large retailers are expected to rely on API-based data ingestion for competitive intelligence.
Shift Toward API-Driven Collection (2020–2026)
| Year | Script-Based (%) | API-Based (%) |
|---|---|---|
| 2020 | 65 | 35 |
| 2022 | 52 | 48 |
| 2024 | 38 | 62 |
| 2026 | 29 | 71 |
API-driven collection ensures data consistency, minimizes maintenance overhead, and integrates seamlessly with analytics platforms, making it the backbone of modern e-commerce intelligence systems.
From Data to Strategic Market Insight
Collecting data is only the first step; transforming it into strategy is where value is created. Companies that Extract Amazon data for e-commerce market intelligence can analyze competitive positioning, pricing elasticity, and inventory risks across categories and geographies.
From 2020 to 2026, market intelligence use cases expanded from competitor tracking to predictive modeling and scenario planning. Businesses now use historical data to simulate pricing outcomes, forecast stock shortages, and evaluate market entry opportunities.
Top Market Intelligence Use Cases (2020 vs 2026)
| Use Case | 2020 Usage | 2026 Usage |
|---|---|---|
| Competitor Pricing | 70% | 95% |
| Demand Forecasting | 32% | 78% |
| Market Entry Analysis | 25% | 66% |
| Promotion Effectiveness | 18% | 61% |
These insights empower decision-makers to move proactively, reducing uncertainty and improving profitability in volatile markets.
Leveraging Structured Data Assets
As data volumes grow, structured datasets become essential for long-term analysis and AI-driven insights. Businesses increasingly rely on Amazon API Datasets to fuel dashboards, machine learning models, and historical trend analysis.
Between 2020 and 2026, the average enterprise e-commerce dataset grew nearly fivefold, driven by higher data frequency and expanded coverage. Structured datasets ensure consistency across teams, enabling collaboration between pricing, supply chain, and marketing functions.
Average Dataset Size Growth (2020–2026)
| Year | Avg. Dataset Size (GB) |
|---|---|
| 2020 | 120 |
| 2022 | 210 |
| 2024 | 380 |
| 2026 | 560 |
With reliable datasets, organizations can unlock advanced analytics, predictive insights, and long-term strategic planning.
Why Choose Real Data API?
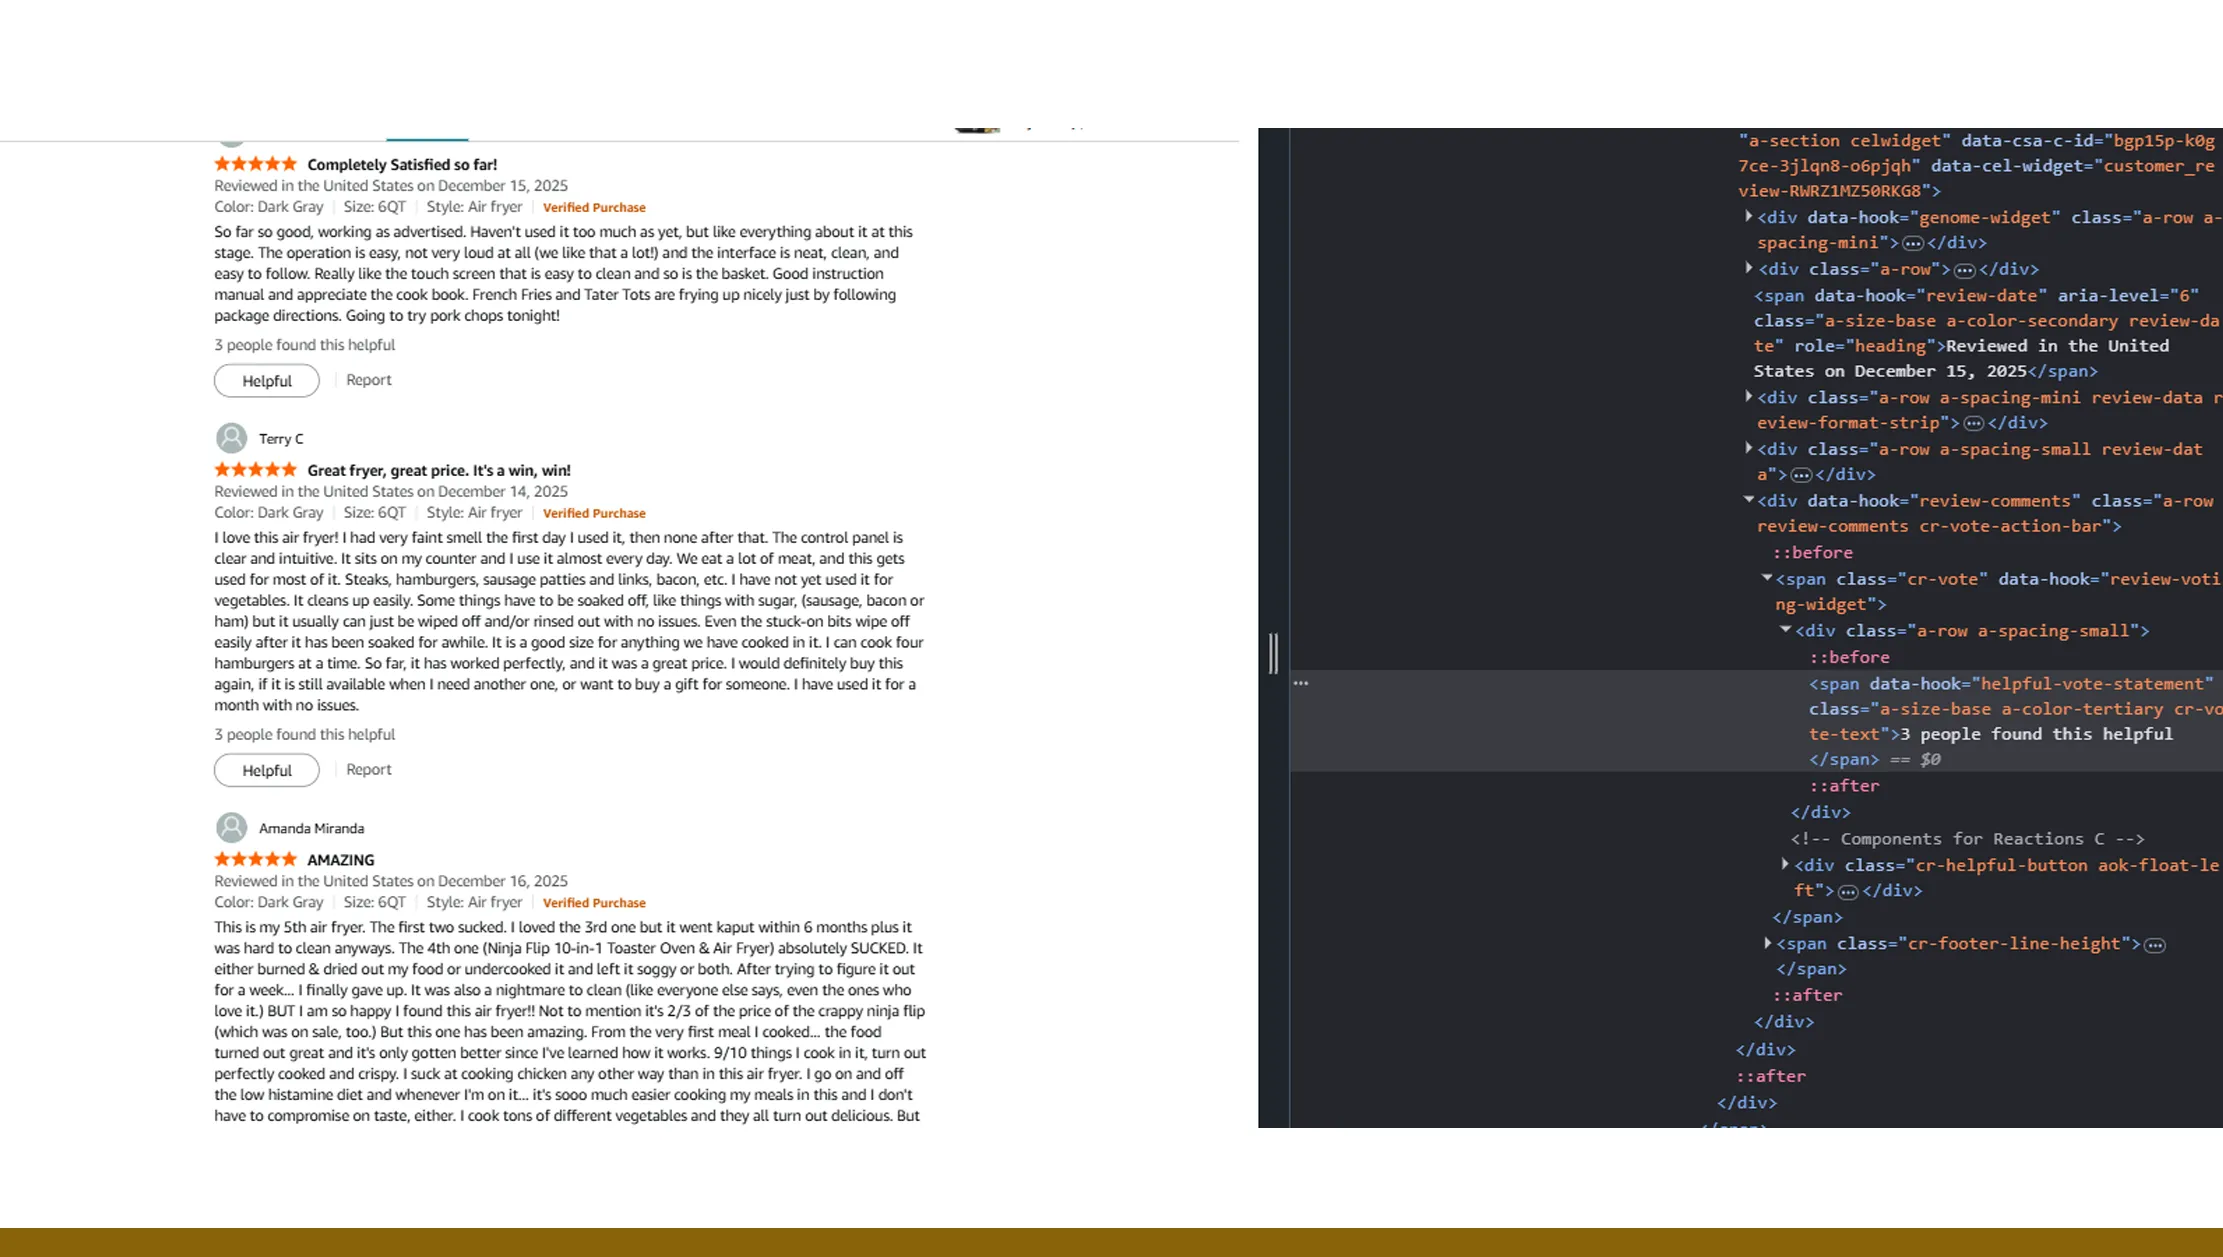
Real Data API is designed for scalability, accuracy, and enterprise-grade performance. It delivers clean, structured access to Amazon marketplace intelligence without the complexity of infrastructure management. With comprehensive coverage, businesses gain access to Amazon Product and Review Datasets that support pricing analysis, sentiment tracking, and competitive benchmarking. Built for reliability, the platform ensures consistent updates and seamless integration, making Amazon API for product pricing and inventory analysis accessible to teams of all sizes—from startups to global enterprises.
Conclusion
Smarter e-commerce decisions start with better data. By automating collection and analysis through a powerful Amazon Scraping API, businesses can eliminate guesswork, respond faster to market changes, and build resilient pricing and inventory strategies. With Amazon API for product pricing and inventory analysis, Real Data API empowers brands to transform raw marketplace data into actionable intelligence.
Ready to future-proof your e-commerce strategy? Get started with Real Data API today and turn Amazon data into your competitive advantage.
Latest posts

Why Brands Use Competitive Data Intelligence to Increase Market Share in Highly Competitive Markets?

How To Scrape Competitor Data To Support Market Entry Strategy And Expansion Planning For Data-Driven Business Growth?

How Hotel Occupancy Intelligence Through Public Data Sources Is Reshaping Revenue Management

The ZIP Code Advantage: How Hyper-Local Amazon Product Data Collection Is Redefining Retail Intelligence
Real Data API stands out as one of the premier global companies specializing in web data Scraping and web extraction.


Rating 4.7
Rating 4.7
Rating 4.5
Rating 4.7
Rating 4.7


Disclaimer : RealData API functions solely as an independent data infrastructure and technology solutions provider. We build customized automation workflows designed to collect publicly accessible web data based exclusively on client instructions. RealData API neither owns proprietary datasets nor engages in the sale or redistribution of extracted information. Our operations are limited strictly to lawful public web data processing and never involve unauthorized access to restricted systems or private networks. Any company names, trademarks, logos, or brand references displayed on this website are used purely for demonstrative and illustrative purposes to showcase our technical capabilities and do not imply endorsement, partnership, or affiliation. Use of our platform and services remains subject to our Terms of Service.