
Introduction
Modern organizations increasingly rely on live analytics systems to monitor operations, customer behavior, competitor activity, and market trends in real time. Businesses across retail, finance, healthcare, logistics, and eCommerce require scalable infrastructures capable of collecting and visualizing continuously changing information. Companies that successfully create real-time dashboards using web scraping data gain faster insights, improved operational visibility, and stronger decision-making capabilities.
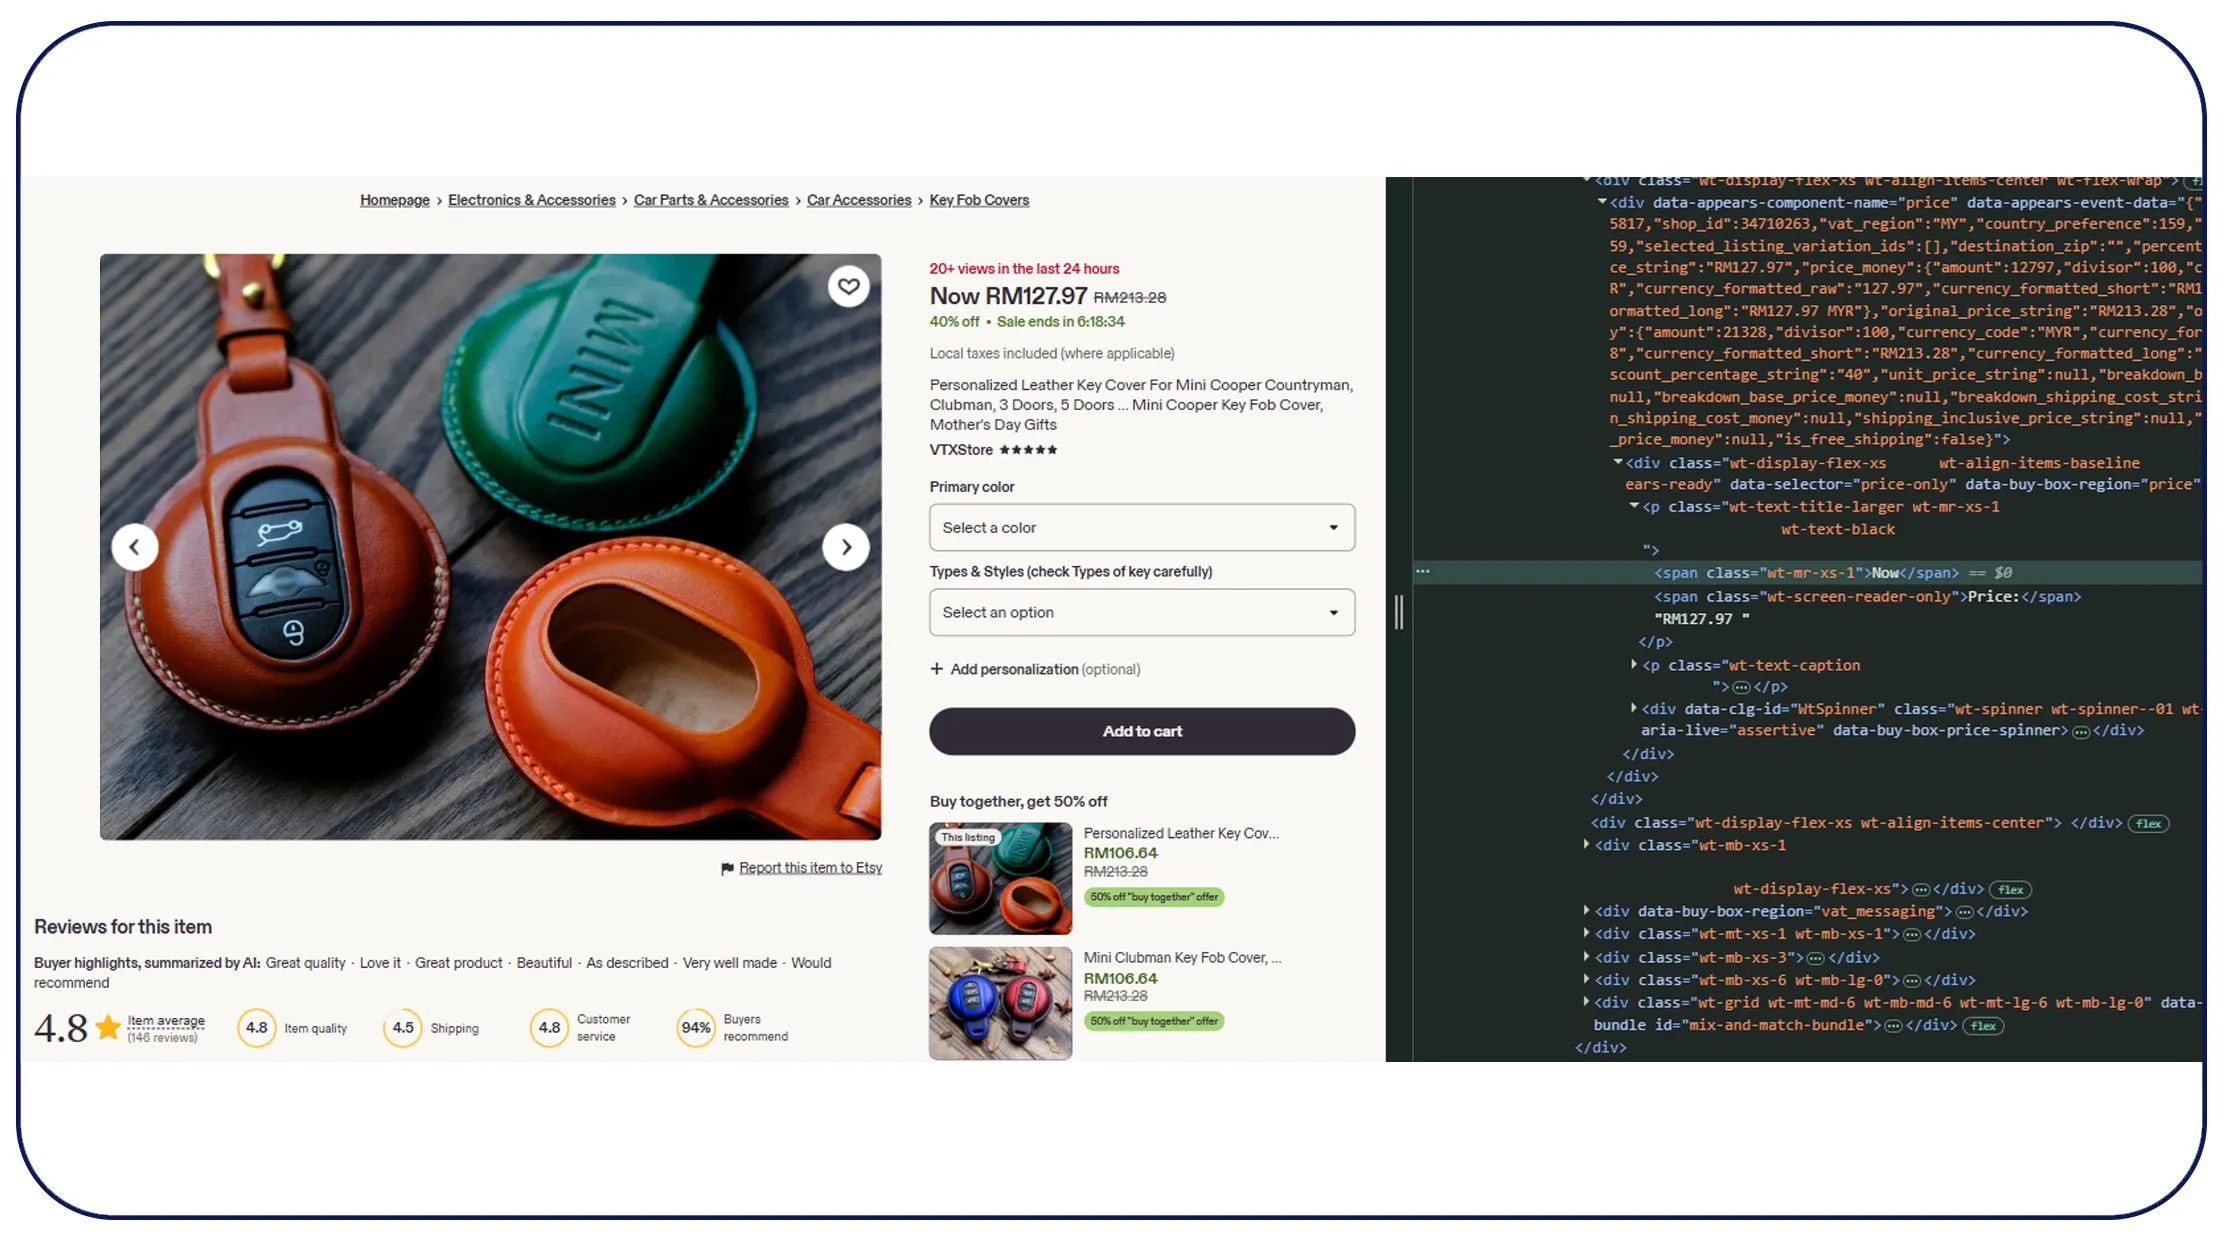
Real-time dashboards transform raw web data into actionable intelligence by integrating automated extraction pipelines, cloud storage, analytics platforms, and visualization tools. These systems help businesses monitor pricing fluctuations, inventory levels, social sentiment, and industry trends instantly.
A scalable Web Scraping API enables organizations to automate data collection from websites, marketplaces, and digital platforms while maintaining continuous synchronization with dashboard environments. APIs simplify integrations and improve the reliability of live analytics systems.
Between 2020 and 2026, global investment in business intelligence platforms, AI analytics, and cloud-native monitoring infrastructures has grown rapidly. Enterprises increasingly prioritize low-latency dashboards capable of supporting predictive analytics and automated decision-making workflows.
As digital ecosystems continue expanding, real-time dashboard infrastructures are becoming essential for maintaining competitiveness, improving operational efficiency, and supporting data-driven growth strategies.
Turning Raw Information into Actionable Insights
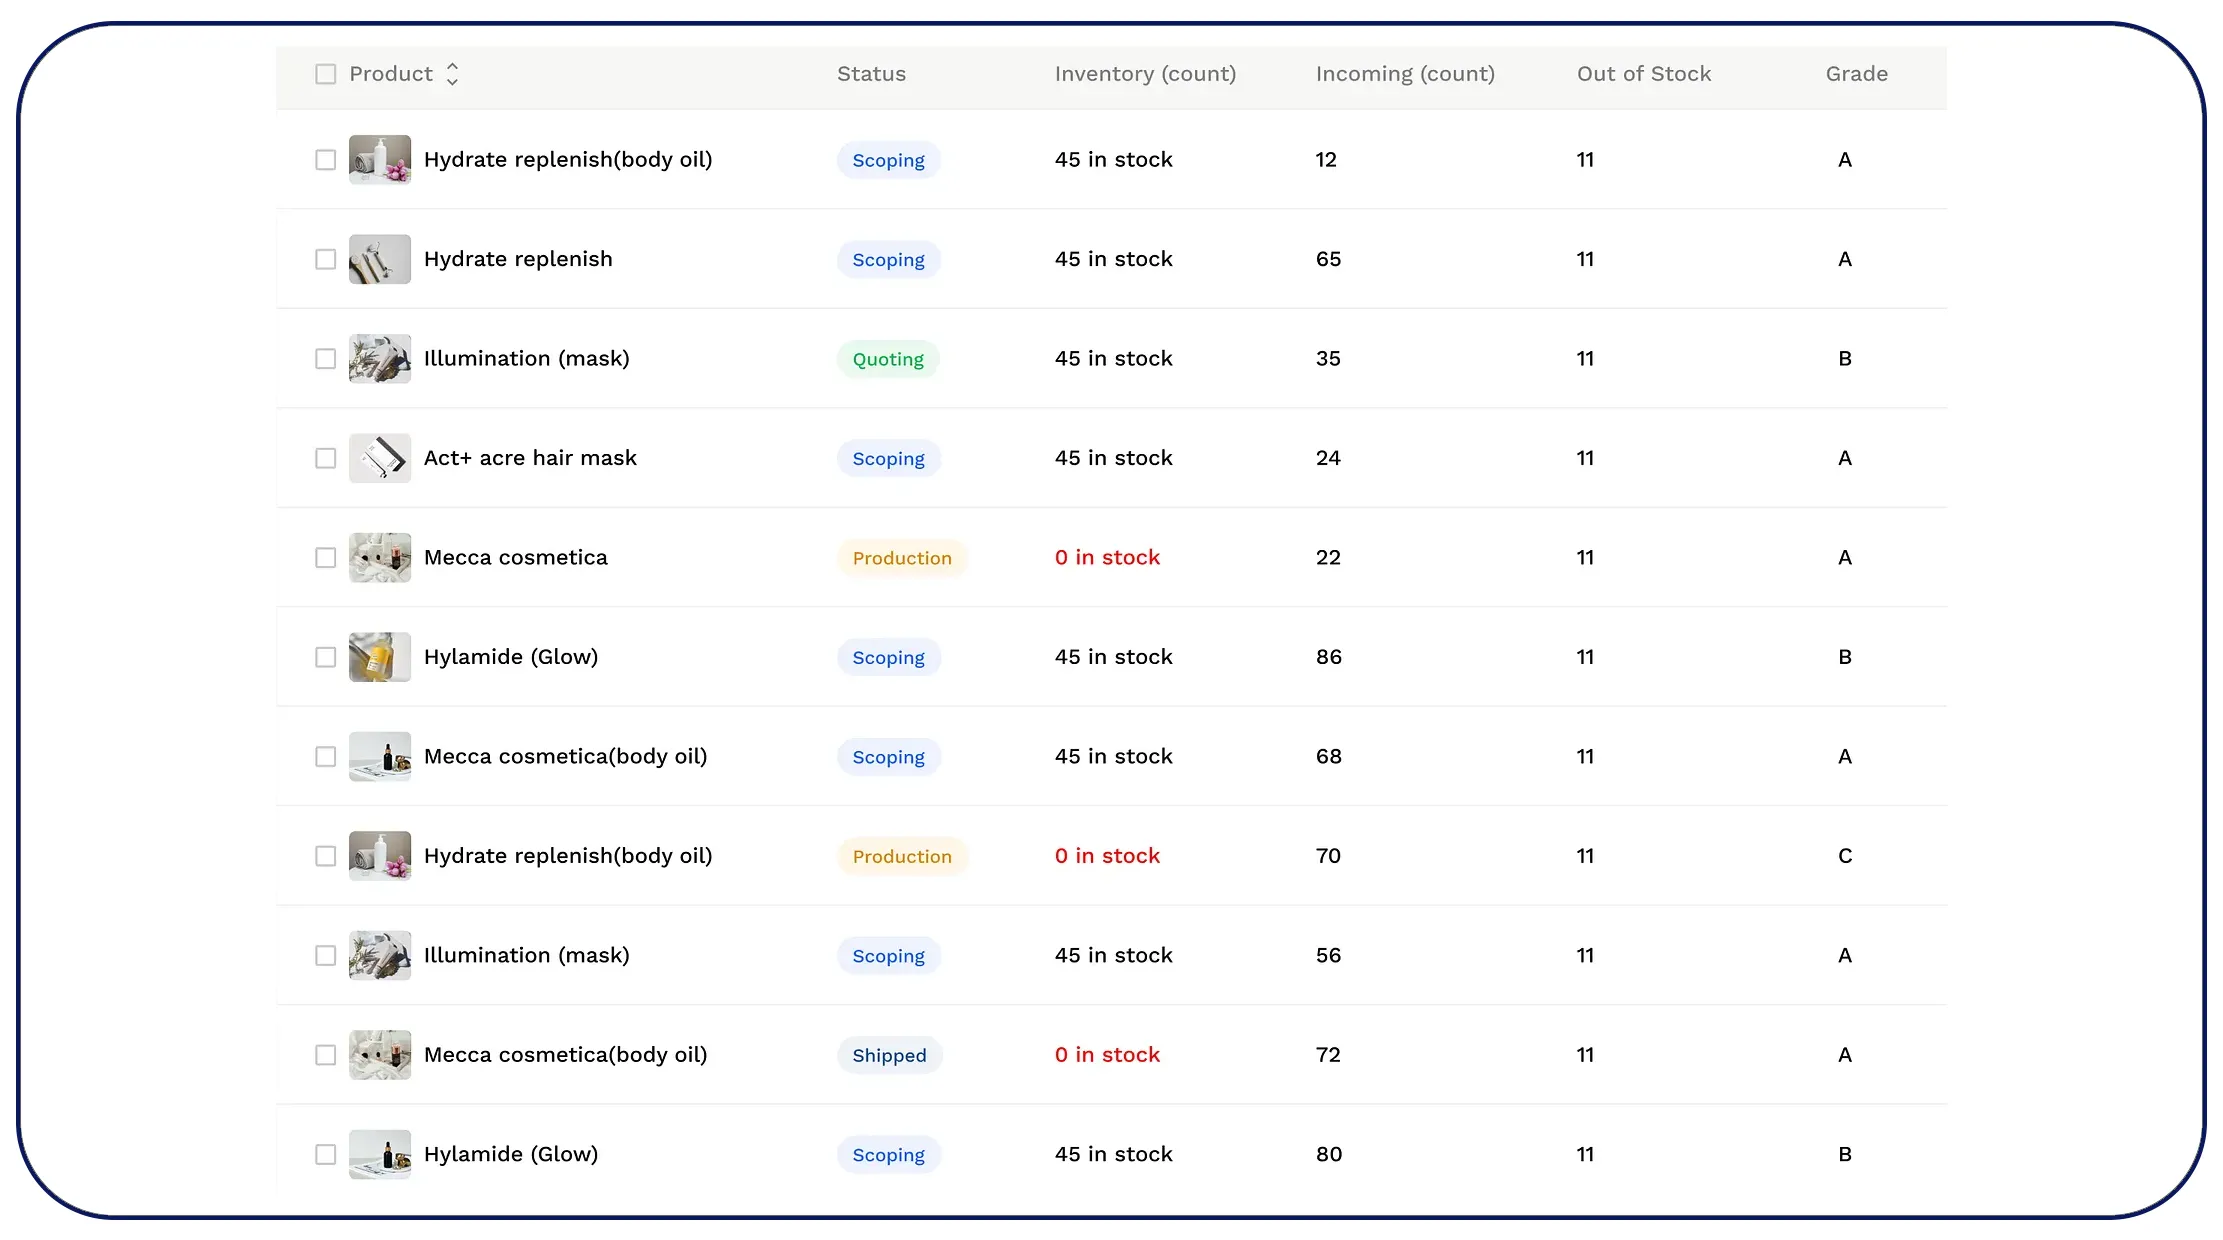
Modern businesses collect massive volumes of online data daily, but the true value comes from transforming that information into meaningful visual intelligence. Dashboards help organizations identify trends, anomalies, and opportunities instantly.
Organizations increasingly build interactive dashboards from scraped data to improve visibility across operations, customer engagement, and market intelligence systems. These dashboards provide centralized monitoring environments capable of displaying live metrics from multiple sources simultaneously.
Global Business Intelligence Dashboard Market (2020–2026)
| Year | Market Size ($ Billion) |
|---|---|
| 2020 | 22.5 |
| 2021 | 25.9 |
| 2022 | 30.1 |
| 2023 | 35.4 |
| 2024 | 41.2 |
| 2025 | 47.9 |
| 2026 | 55.6 |
Businesses commonly monitor:
- Competitor pricing trends
- Customer sentiment analysis
- Inventory availability
- Product performance metrics
- Website traffic behavior
- Regional demand fluctuations
Interactive dashboards frequently include:
- Live charts and visualizations
- Real-time KPI tracking
- Automated alert systems
- Multi-source analytics integrations
- Role-based reporting views
Retailers use dashboard systems to track competitor pricing and promotional campaigns continuously. Financial firms monitor market fluctuations and trading indicators in real time.
The growing adoption of AI-driven analytics is further enhancing dashboard capabilities by enabling predictive forecasting and automated anomaly detection.
Interactive dashboards help businesses reduce response times, improve operational transparency, and support faster strategic decision-making across digital ecosystems.
Connecting APIs with Visualization Platforms
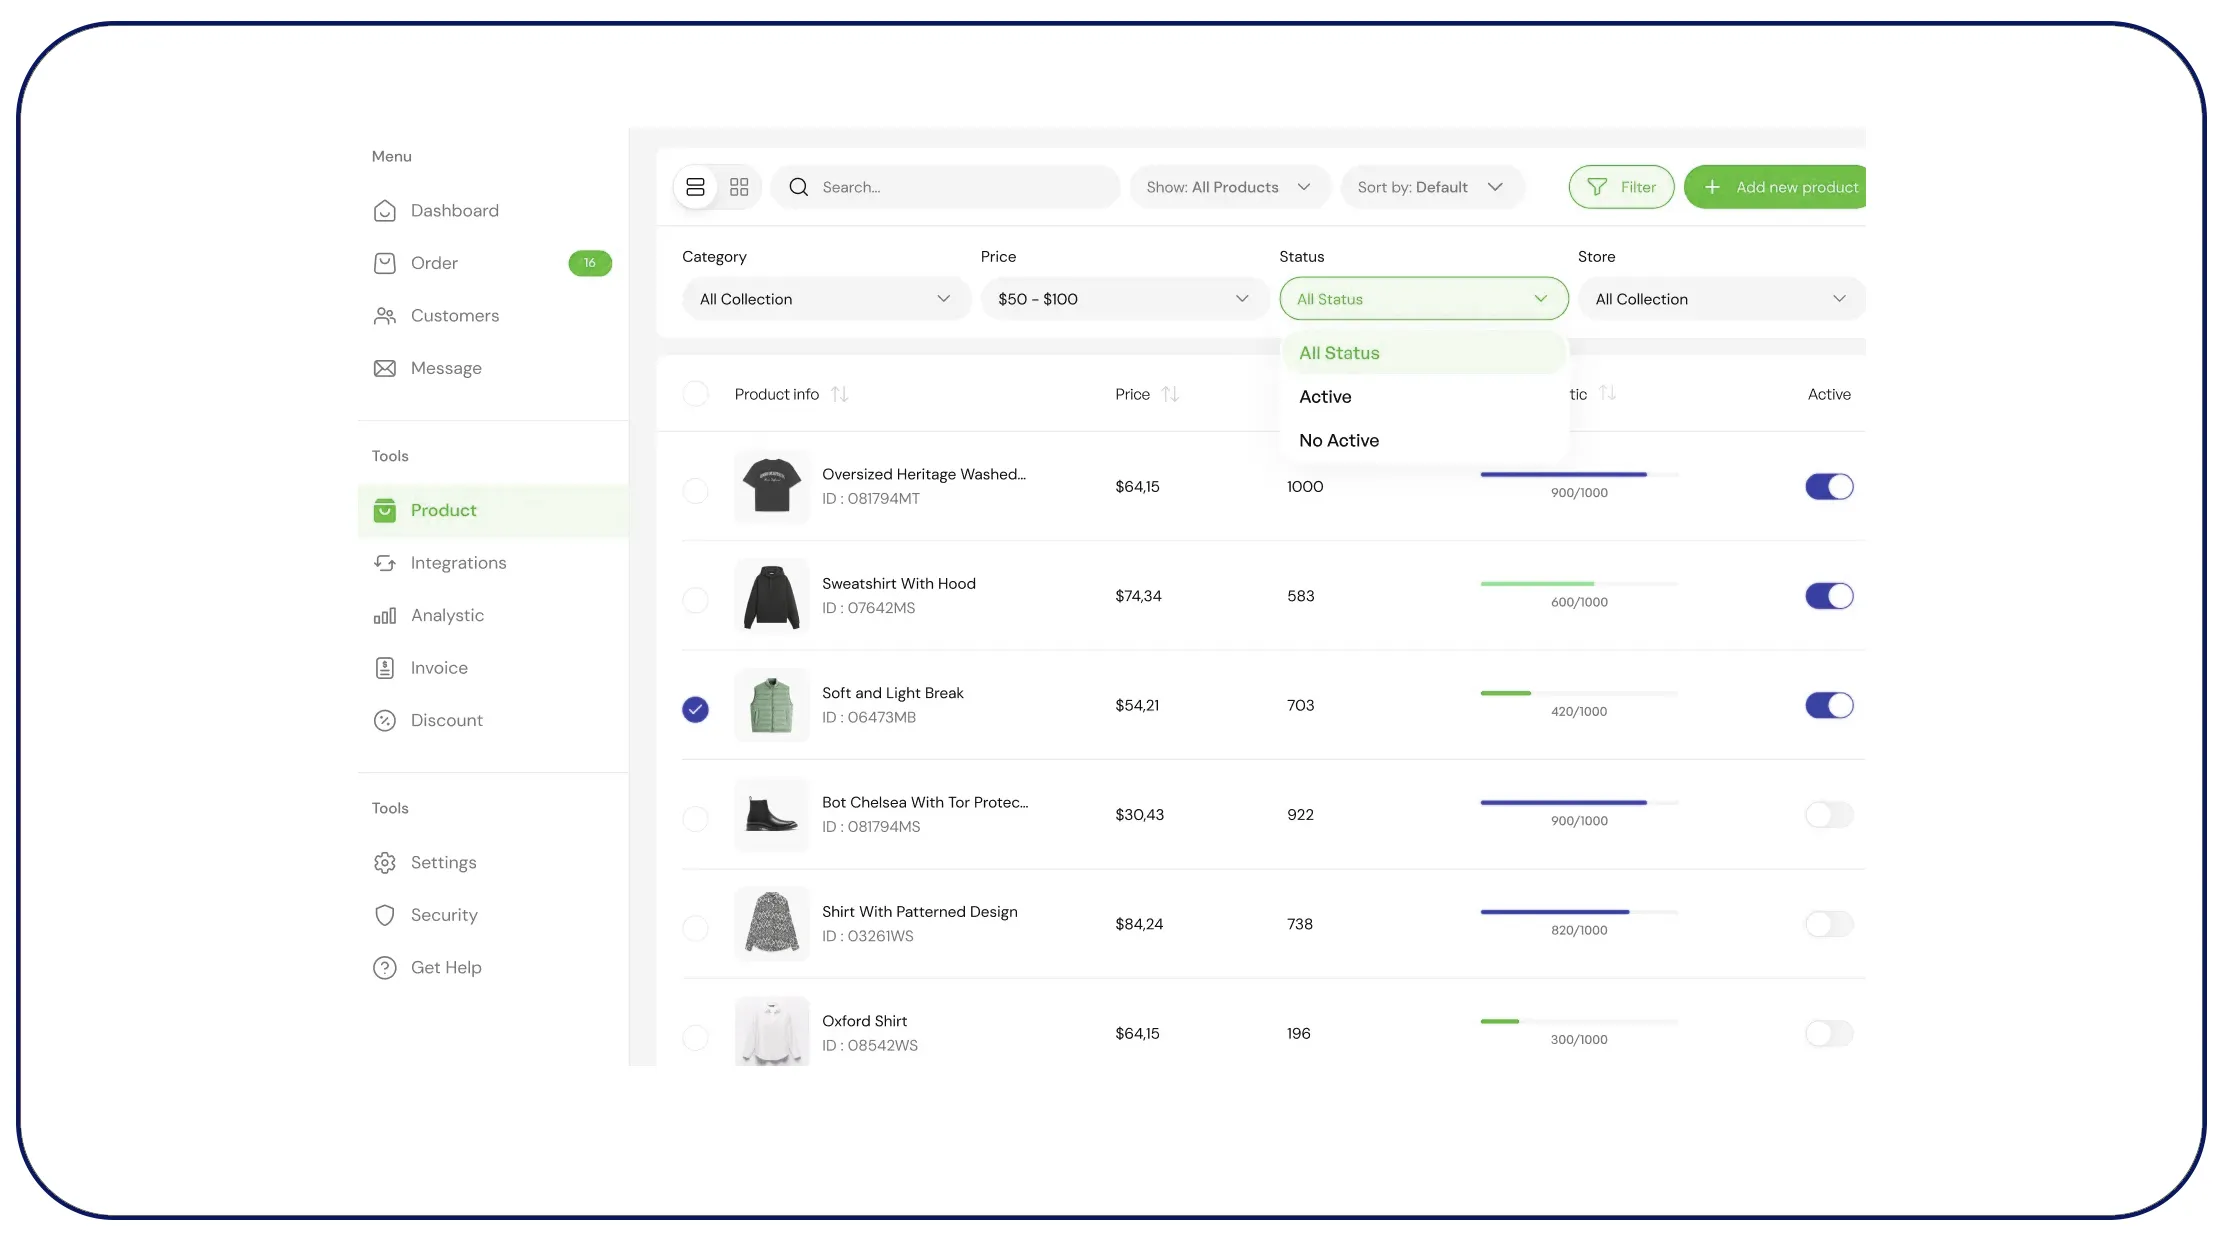
Scalable dashboard systems require reliable data delivery infrastructures capable of continuously transferring structured information from extraction pipelines into analytics environments. APIs play a crucial role in enabling seamless data movement.
Organizations increasingly transform scraped data into interactive dashboards via API to maintain synchronized and automated reporting systems. APIs allow businesses to distribute structured information directly into Power BI, Tableau, Looker, Grafana, and custom analytics platforms.
API-Driven Analytics Adoption (2020–2026)
| Year | Enterprises Using API-Based Dashboards |
|---|---|
| 2020 | 38% |
| 2021 | 45% |
| 2022 | 53% |
| 2023 | 61% |
| 2024 | 69% |
| 2025 | 76% |
| 2026 | 84% |
Modern dashboard architectures commonly include:
- REST and GraphQL APIs
- Real-time event streaming
- Cloud-based data warehouses
- Automated synchronization systems
- Authentication and security layers
Retail organizations integrate APIs into pricing intelligence systems to monitor SKU-level changes continuously. Logistics companies use APIs to display shipment tracking, delivery metrics, and fleet performance in real time.
API-driven dashboards improve scalability by enabling multiple systems to access structured information simultaneously. These infrastructures also support automated reporting workflows and cross-platform analytics integrations.
Cloud-native API ecosystems are expected to become even more important between 2024 and 2026 as businesses continue expanding real-time monitoring and automation initiatives.
Reliable API infrastructures remain essential for maintaining dashboard accuracy, responsiveness, and operational consistency.
Structuring Efficient Dashboard Development Workflows
Building successful real-time dashboards requires careful planning, scalable architecture design, and efficient workflow automation. Organizations must ensure data consistency, visualization accuracy, and low-latency processing throughout the pipeline.
Many enterprises follow a step-by-step guide to dashboard creation using data scraping to simplify deployment and improve long-term maintainability. Structured workflows help businesses standardize extraction, transformation, storage, and visualization processes.
Enterprise Dashboard Deployment Priorities
| Priority Area | Importance Level |
|---|---|
| Real-Time Data Accuracy | High |
| Dashboard Scalability | High |
| Visualization Performance | High |
| User Accessibility | Medium |
| API Reliability | High |
| Security & Compliance | High |
Typical dashboard development stages include:
- Data source identification
- Automated extraction setup
- Data cleaning and normalization
- API integration and synchronization
- Visualization design
- Real-time monitoring and optimization
Organizations often use cloud-native storage systems and distributed processing frameworks to improve dashboard scalability. AI-driven analytics tools further enhance dashboards by automating forecasting and trend detection.
Security also plays a major role in dashboard development. Enterprises implement authentication layers, encryption protocols, and role-based access controls to protect sensitive information.
As business intelligence requirements continue evolving, structured deployment methodologies help organizations maintain reliable and scalable dashboard ecosystems.
Expanding Real-Time Intelligence Through Automation

Businesses increasingly require automated infrastructures capable of supporting continuous extraction, synchronization, and reporting operations without extensive manual intervention. Managed automation systems improve operational efficiency and scalability.
Professional Web Scraping Services help organizations simplify large-scale extraction and dashboard integration workflows. These services provide managed infrastructures capable of collecting structured data continuously from multiple online sources.
Managed Extraction Services Market Growth (2020–2026)
| Year | Market Size ($ Billion) |
|---|---|
| 2020 | 5.1 |
| 2021 | 6.4 |
| 2022 | 8.0 |
| 2023 | 10.1 |
| 2024 | 12.7 |
| 2025 | 15.8 |
| 2026 | 19.5 |
Managed service providers commonly offer:
- Automated extraction pipelines
- Real-time API integrations
- Proxy rotation systems
- Browser rendering support
- Data normalization frameworks
- Dashboard synchronization services
Retailers frequently use managed services to monitor competitor pricing and product availability continuously. Travel companies analyze airfare and hotel pricing trends using automated extraction infrastructures.
Managed services reduce operational overhead while improving extraction stability and scalability. These systems also help organizations maintain continuous dashboard accuracy despite changing website structures and anti-bot protections.
As enterprises increasingly adopt AI-driven analytics, managed extraction infrastructures are becoming critical for supporting scalable business intelligence operations.
Monitoring Large-Scale Digital Ecosystems
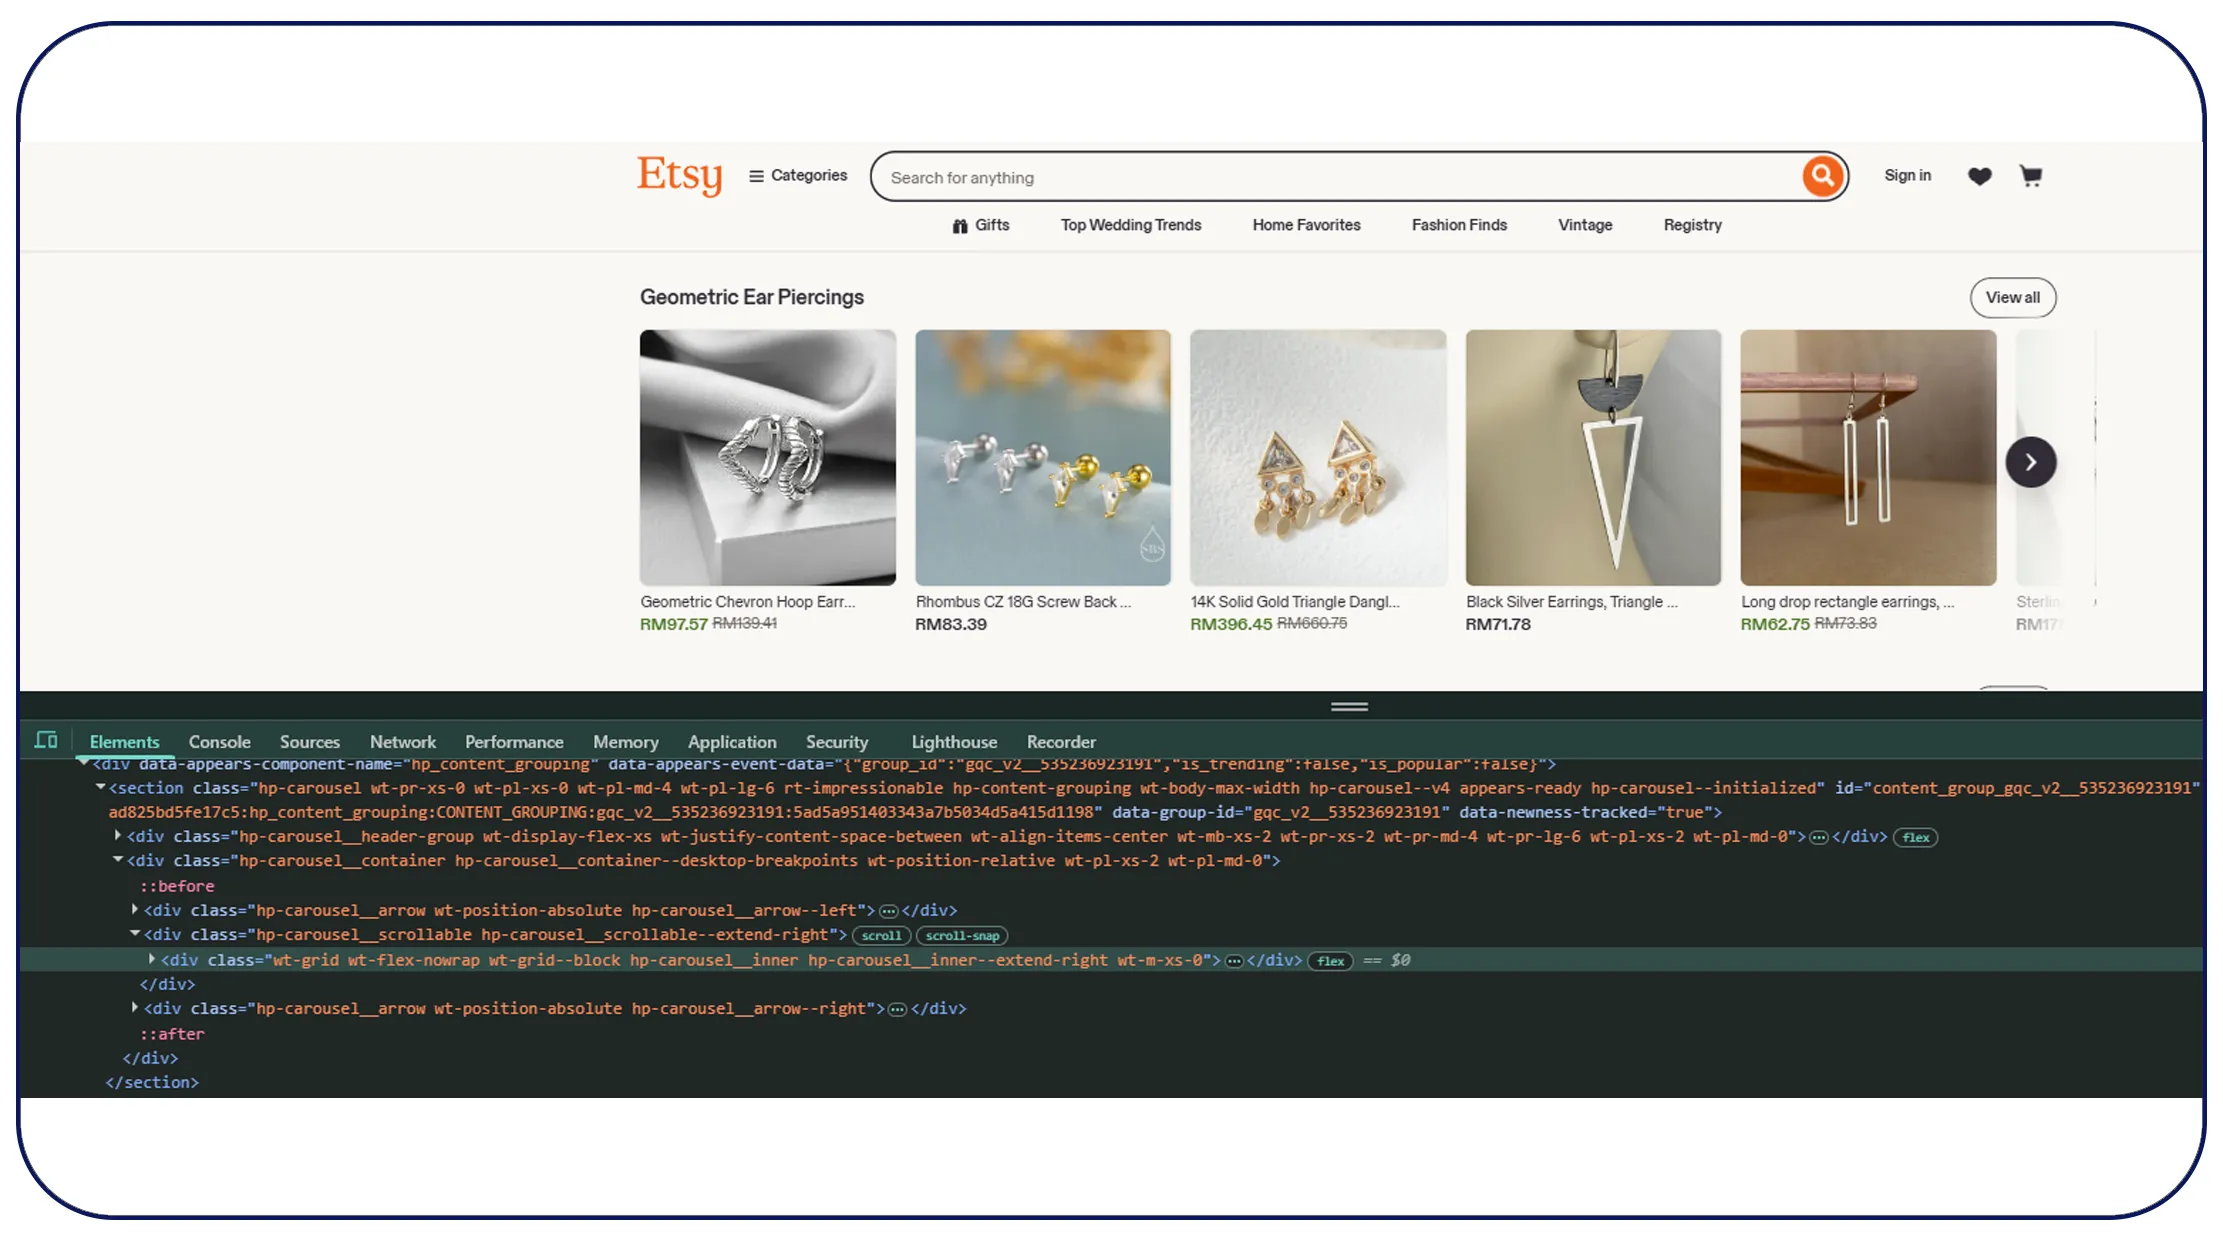
Real-time dashboards often depend on large-scale crawling infrastructures capable of discovering and monitoring millions of pages across dynamic digital environments. Continuous crawling ensures that dashboards remain updated with the latest information.
Advanced Enterprise Web Crawling systems support large-scale discovery, indexing, and monitoring operations for analytics platforms, search engines, and intelligence systems.
Enterprise Crawling Adoption Trends (2020–2026)

| Year | Enterprises Using Large-Scale Crawlers |
|---|---|
| 2020 | 36% |
| 2021 | 44% |
| 2022 | 52% |
| 2023 | 60% |
| 2024 | 67% |
| 2025 | 74% |
| 2026 | 82% |
Enterprise crawling platforms commonly include:
- Distributed crawling agents
- Dynamic rendering engines
- AI-based prioritization systems
- URL scheduling frameworks
- Real-time indexing mechanisms
Retail companies use enterprise crawlers to monitor competitor catalogs, pricing changes, and stock availability across global marketplaces.
Financial institutions crawl economic reports, market updates, and investment news to support predictive analytics and trading systems.
AI-enhanced crawling technologies improve efficiency by identifying relevant content automatically and optimizing crawl prioritization strategies.
As digital ecosystems continue growing, enterprise crawling systems will remain foundational for supporting large-scale analytics and dashboard intelligence infrastructures.
Powering Predictive Analytics with Structured Information
Real-time dashboards become significantly more valuable when supported by high-quality structured datasets. Businesses increasingly depend on continuously updated datasets to power forecasting, automation, and AI-driven analytics.
Reliable Web Scraping Datasets help organizations train machine learning models, optimize reporting systems, and improve predictive intelligence capabilities. Structured datasets enable businesses to analyze historical trends while supporting real-time operational monitoring.
Global Analytics Dataset Market (2020–2026)
| Year | Market Size ($ Billion) |
|---|---|
| 2020 | 2.4 |
| 2021 | 3.1 |
| 2022 | 4.0 |
| 2023 | 5.3 |
| 2024 | 6.8 |
| 2025 | 8.5 |
| 2026 | 10.6 |
Businesses commonly use datasets for:
- Demand forecasting
- Competitor benchmarking
- Customer sentiment analysis
- Product recommendation systems
- Operational analytics
Retailers combine real-time dashboards with structured datasets to improve inventory planning and dynamic pricing strategies. Financial organizations use datasets for risk analysis and predictive market modeling.
Data quality remains essential for dashboard accuracy and AI performance. Organizations therefore implement validation, normalization, and deduplication systems to maintain consistency across large-scale datasets.
The rapid growth of generative AI and predictive analytics platforms is expected to further increase demand for continuously updated datasets between 2024 and 2026.
Why Choose Real Data API?
Real Data API provides enterprise-grade solutions designed to help organizations create real-time dashboards using web scraping data efficiently and at scale. Businesses require reliable extraction infrastructures, scalable APIs, and structured delivery systems to support modern analytics environments.
The platform offers automated extraction pipelines, cloud-based delivery systems, scalable crawling infrastructures, and high-quality analytics integrations for enterprise intelligence operations.
Key advantages include:
- Real-time data extraction and delivery
- Scalable dashboard integrations
- Automated API synchronization
- Structured analytics-ready datasets
- Enterprise crawling capabilities
- Advanced proxy and anti-block management
- Cloud-native scalability
Real Data API helps businesses transform raw web information into actionable intelligence while improving operational efficiency, scalability, and decision-making accuracy.
Conclusion
Modern enterprises increasingly rely on real-time intelligence systems to monitor operations, customer behavior, and competitive market activity continuously. Businesses that successfully create real-time dashboards using web scraping data gain faster insights, stronger visibility, and improved strategic agility.
Between 2020 and 2026, rapid growth in cloud analytics, AI-driven automation, and digital commerce continues driving demand for scalable dashboard infrastructures. Organizations now require highly responsive systems capable of supporting continuous extraction, API-driven integrations, and live analytics environments.
From enterprise crawling to structured datasets and automated extraction services, real-time dashboards are becoming a foundational component of modern business intelligence strategies.
Ready to build scalable live analytics systems for your business? Connect with Real Data API today and create intelligent, real-time dashboards powered by high-performance web scraping and data automation solutions!
Latest posts

Why Brands Use Competitive Data Intelligence to Increase Market Share in Highly Competitive Markets?

How To Scrape Competitor Data To Support Market Entry Strategy And Expansion Planning For Data-Driven Business Growth?

How Hotel Occupancy Intelligence Through Public Data Sources Is Reshaping Revenue Management

The ZIP Code Advantage: How Hyper-Local Amazon Product Data Collection Is Redefining Retail Intelligence
Real Data API stands out as one of the premier global companies specializing in web data Scraping and web extraction.


Rating 4.7
Rating 4.7
Rating 4.5
Rating 4.7
Rating 4.7


Disclaimer : RealData API functions solely as an independent data infrastructure and technology solutions provider. We build customized automation workflows designed to collect publicly accessible web data based exclusively on client instructions. RealData API neither owns proprietary datasets nor engages in the sale or redistribution of extracted information. Our operations are limited strictly to lawful public web data processing and never involve unauthorized access to restricted systems or private networks. Any company names, trademarks, logos, or brand references displayed on this website are used purely for demonstrative and illustrative purposes to showcase our technical capabilities and do not imply endorsement, partnership, or affiliation. Use of our platform and services remains subject to our Terms of Service.