
Introduction
India's FMCG market is projected to cross $220 billion by 2026, driven by urban consumption, private labels, and aggressive retail expansion. In this fast-moving environment, pricing changes weekly—sometimes daily—making manual tracking nearly impossible. Brands, distributors, and analytics teams need structured, automated systems to monitor fluctuations across categories like packaged foods, personal care, beverages, and household essentials.
To build an intelligent benchmarking framework, businesses must Scrape DMart data to track FMCG pricing across SKUs, pack sizes, and promotional cycles. Additionally, Web Scraping city-wise DMart pricing data helps uncover regional price variations, discount intensity, and localized assortment strategies. With organized historical datasets from 2020–2026, companies can detect pricing patterns, optimize margins, and forecast demand more accurately.
This blog explains how structured data extraction empowers smarter FMCG benchmarking and how Real Data API simplifies the entire process with scalable automation solutions.
Building Structured Retail Intelligence Systems
Retail pricing in India has experienced dynamic shifts since 2020. Pandemic disruptions, inflation, and supply chain volatility have significantly influenced pricing strategies.
| Year | Avg FMCG Price Inflation % | Discount Depth % | Private Label Growth % |
|---|---|---|---|
| 2020 | 4.2% | 12% | 8% |
| 2021 | 5.8% | 15% | 11% |
| 2022 | 7.1% | 18% | 14% |
| 2023 | 6.4% | 16% | 16% |
| 2024 | 5.9% | 14% | 18% |
| 2025* | 5.3% | 13% | 20% |
| 2026* | 4.8% | 12% | 22% |
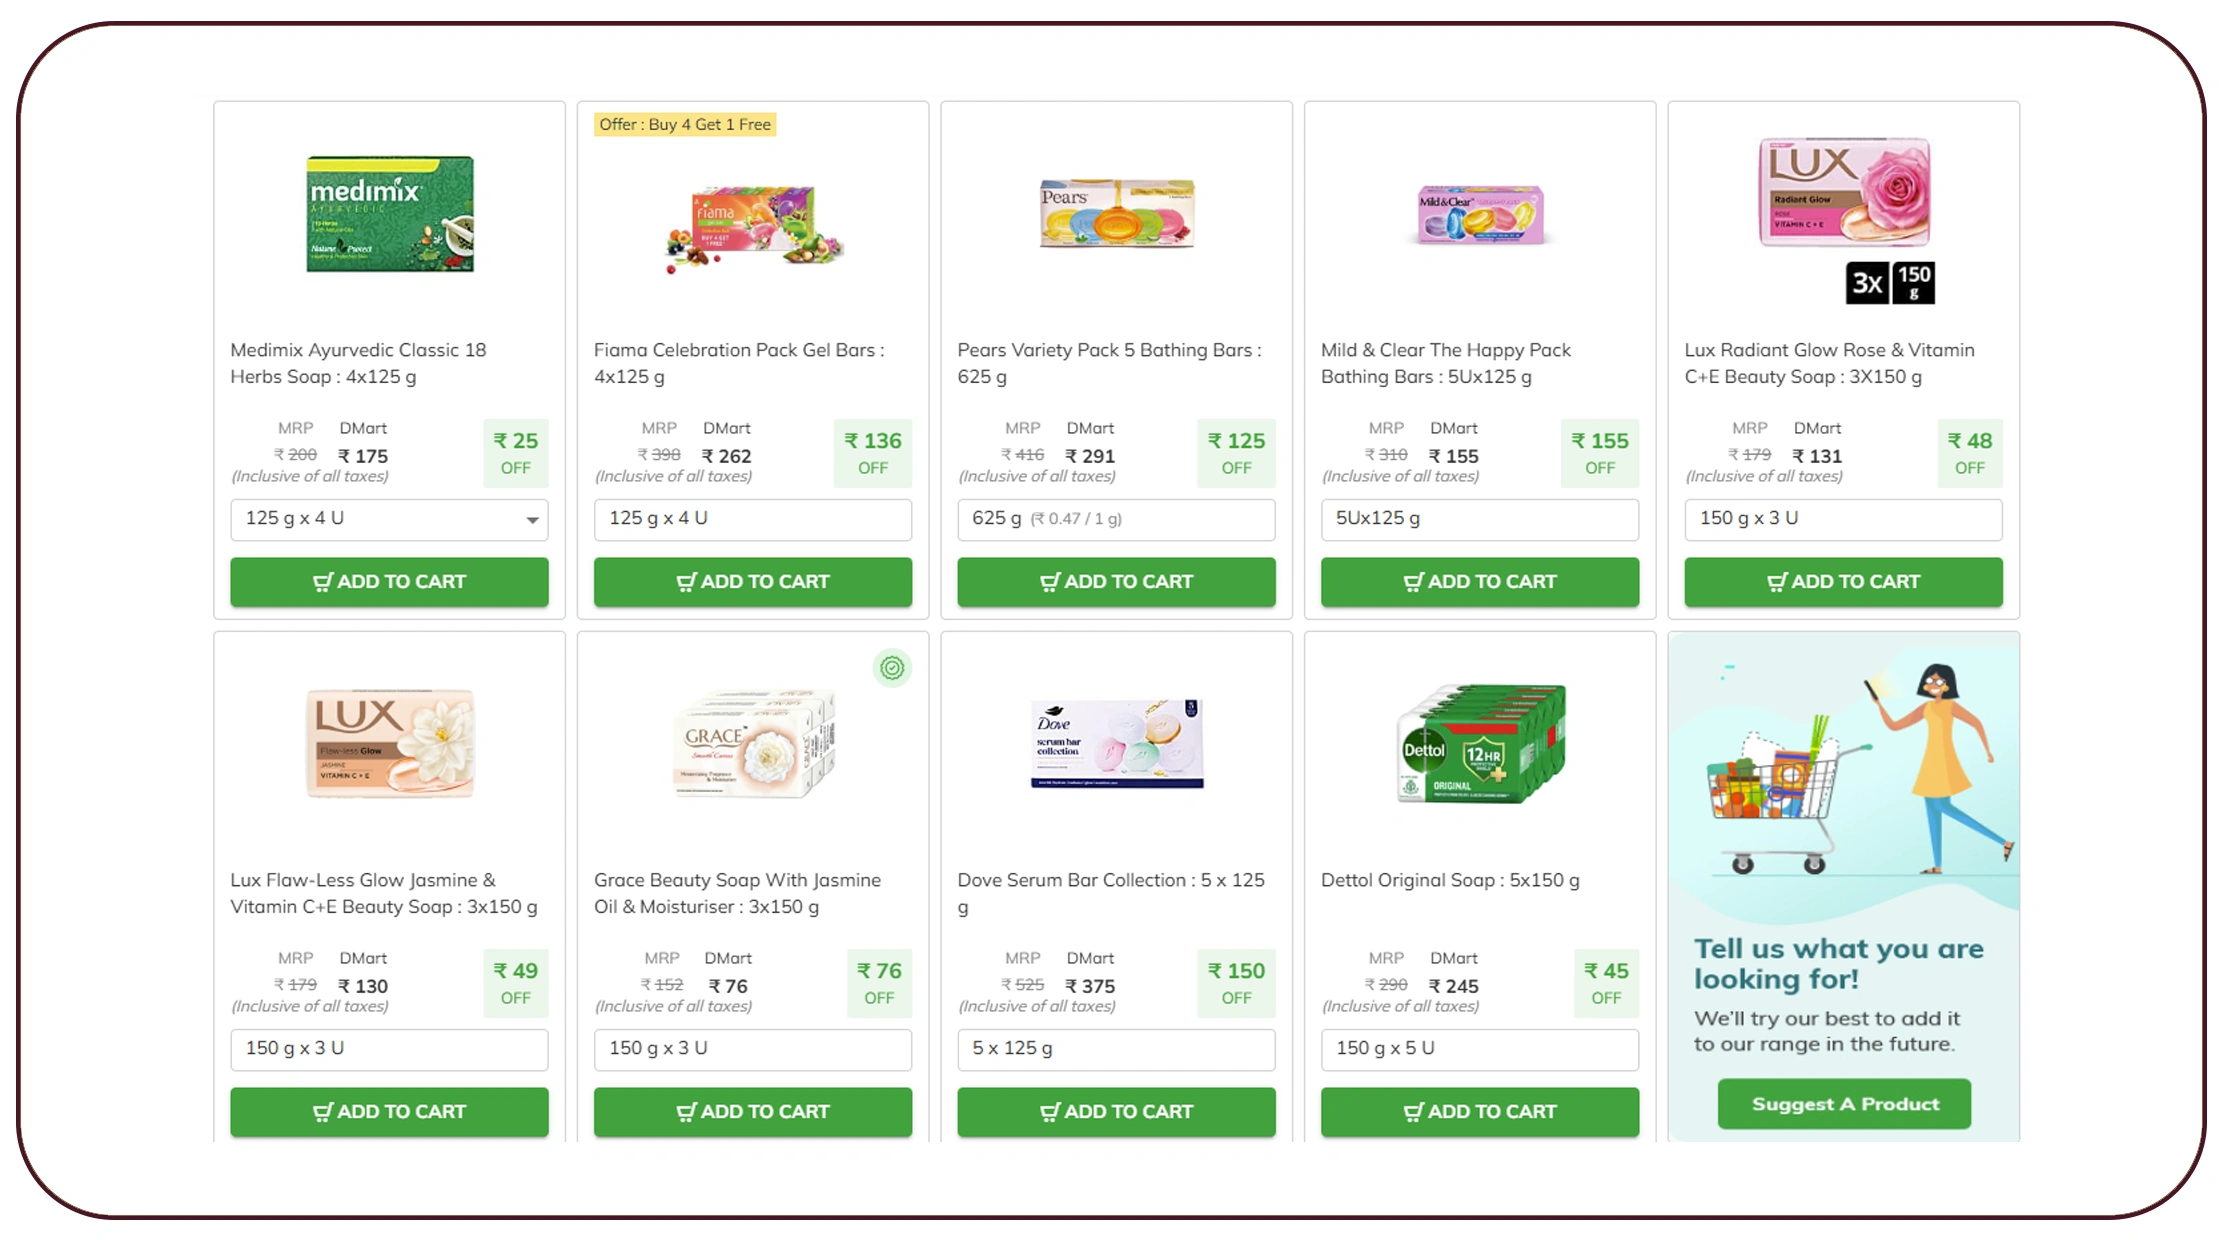
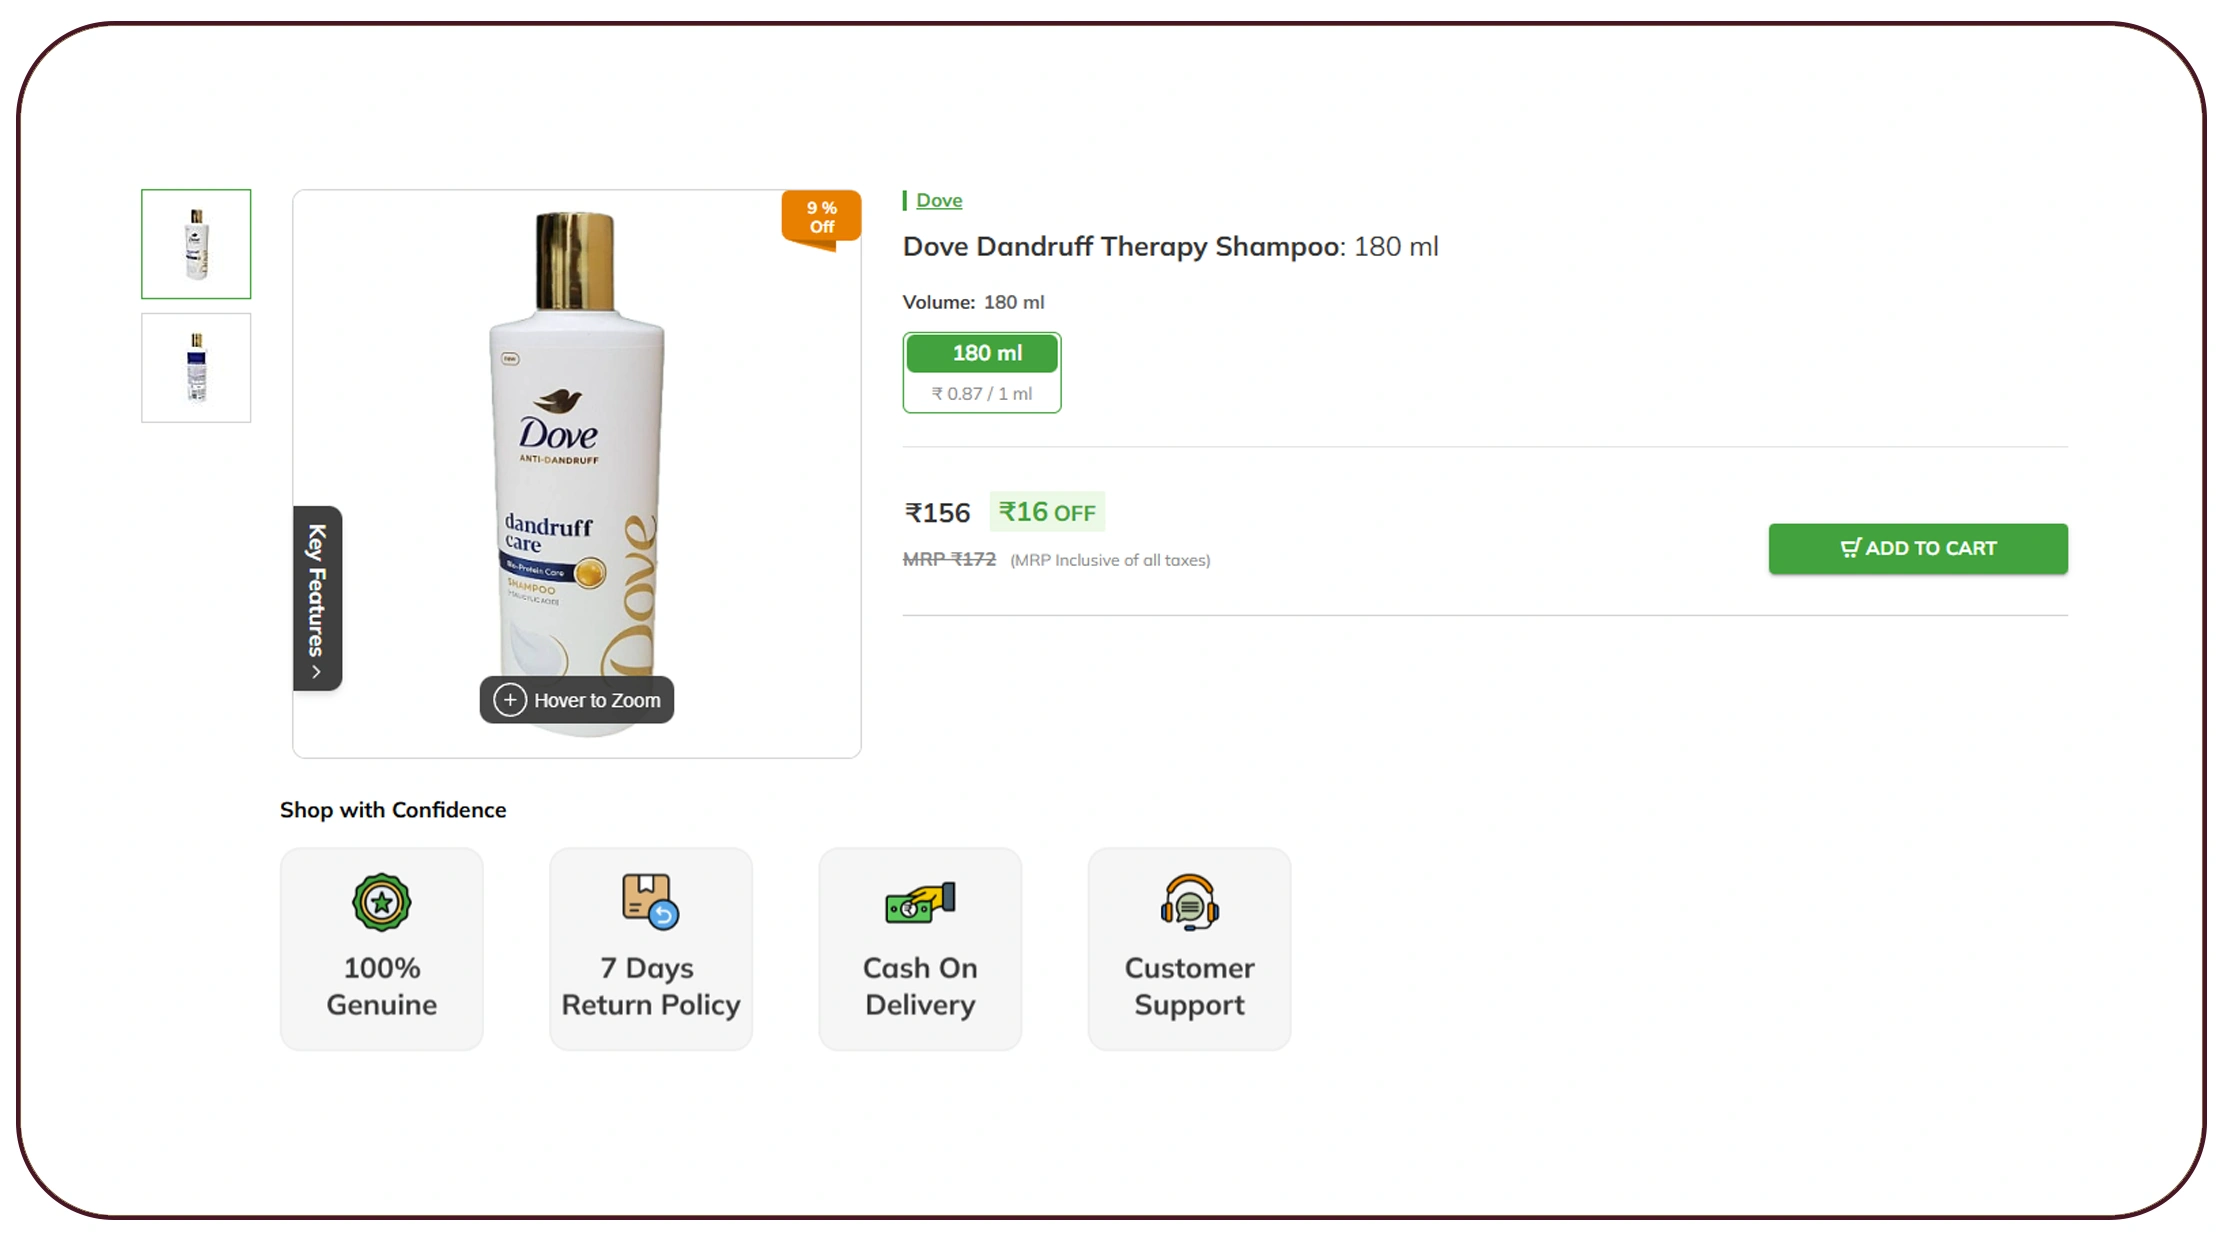
To systematically monitor such shifts, businesses deploy a DMart grocery pricing data scraper to extract product-level details such as MRP, selling price, pack size, availability, and discount percentage. This enables consistent benchmarking across categories like staples, dairy, snacks, and beverages.
A structured scraping system ensures:
- Historical price comparison (2020–2026 trends)
- Discount frequency tracking
- Competitor assortment mapping
- Margin optimization modeling
Without automation, retail intelligence remains reactive. With structured extraction, companies move toward predictive decision-making backed by real-time insights.
Automating Multi-Category Data Collection
Retailers like DMart manage thousands of SKUs across multiple cities. Manual monitoring is not scalable. Automated pipelines powered by a DMart data extraction API enable consistent data capture across categories, subcategories, and product variants.
| Year | Avg SKU Count per City | % Increase YoY |
|---|---|---|
| 2020 | 8,500 | — |
| 2021 | 9,200 | 8% |
| 2022 | 10,400 | 13% |
| 2023 | 11,300 | 9% |
| 2024 | 12,600 | 11% |
| 2025* | 13,800 | 9% |
| 2026* | 15,000 | 8% |
With API-driven extraction, businesses can:
- Track SKU expansion city-wise
- Identify pricing differences across metros and Tier-2 cities
- Analyze discount cycles during festive seasons
- Monitor private-label penetration
Automation ensures clean JSON or CSV outputs that integrate directly into BI dashboards, eliminating manual data cleaning and enabling real-time FMCG benchmarking at scale.
Decoding Competitive Pricing Patterns
Retail competition depends heavily on pricing psychology. Retailers adjust prices based on local demand elasticity, competitor actions, and supplier negotiations.
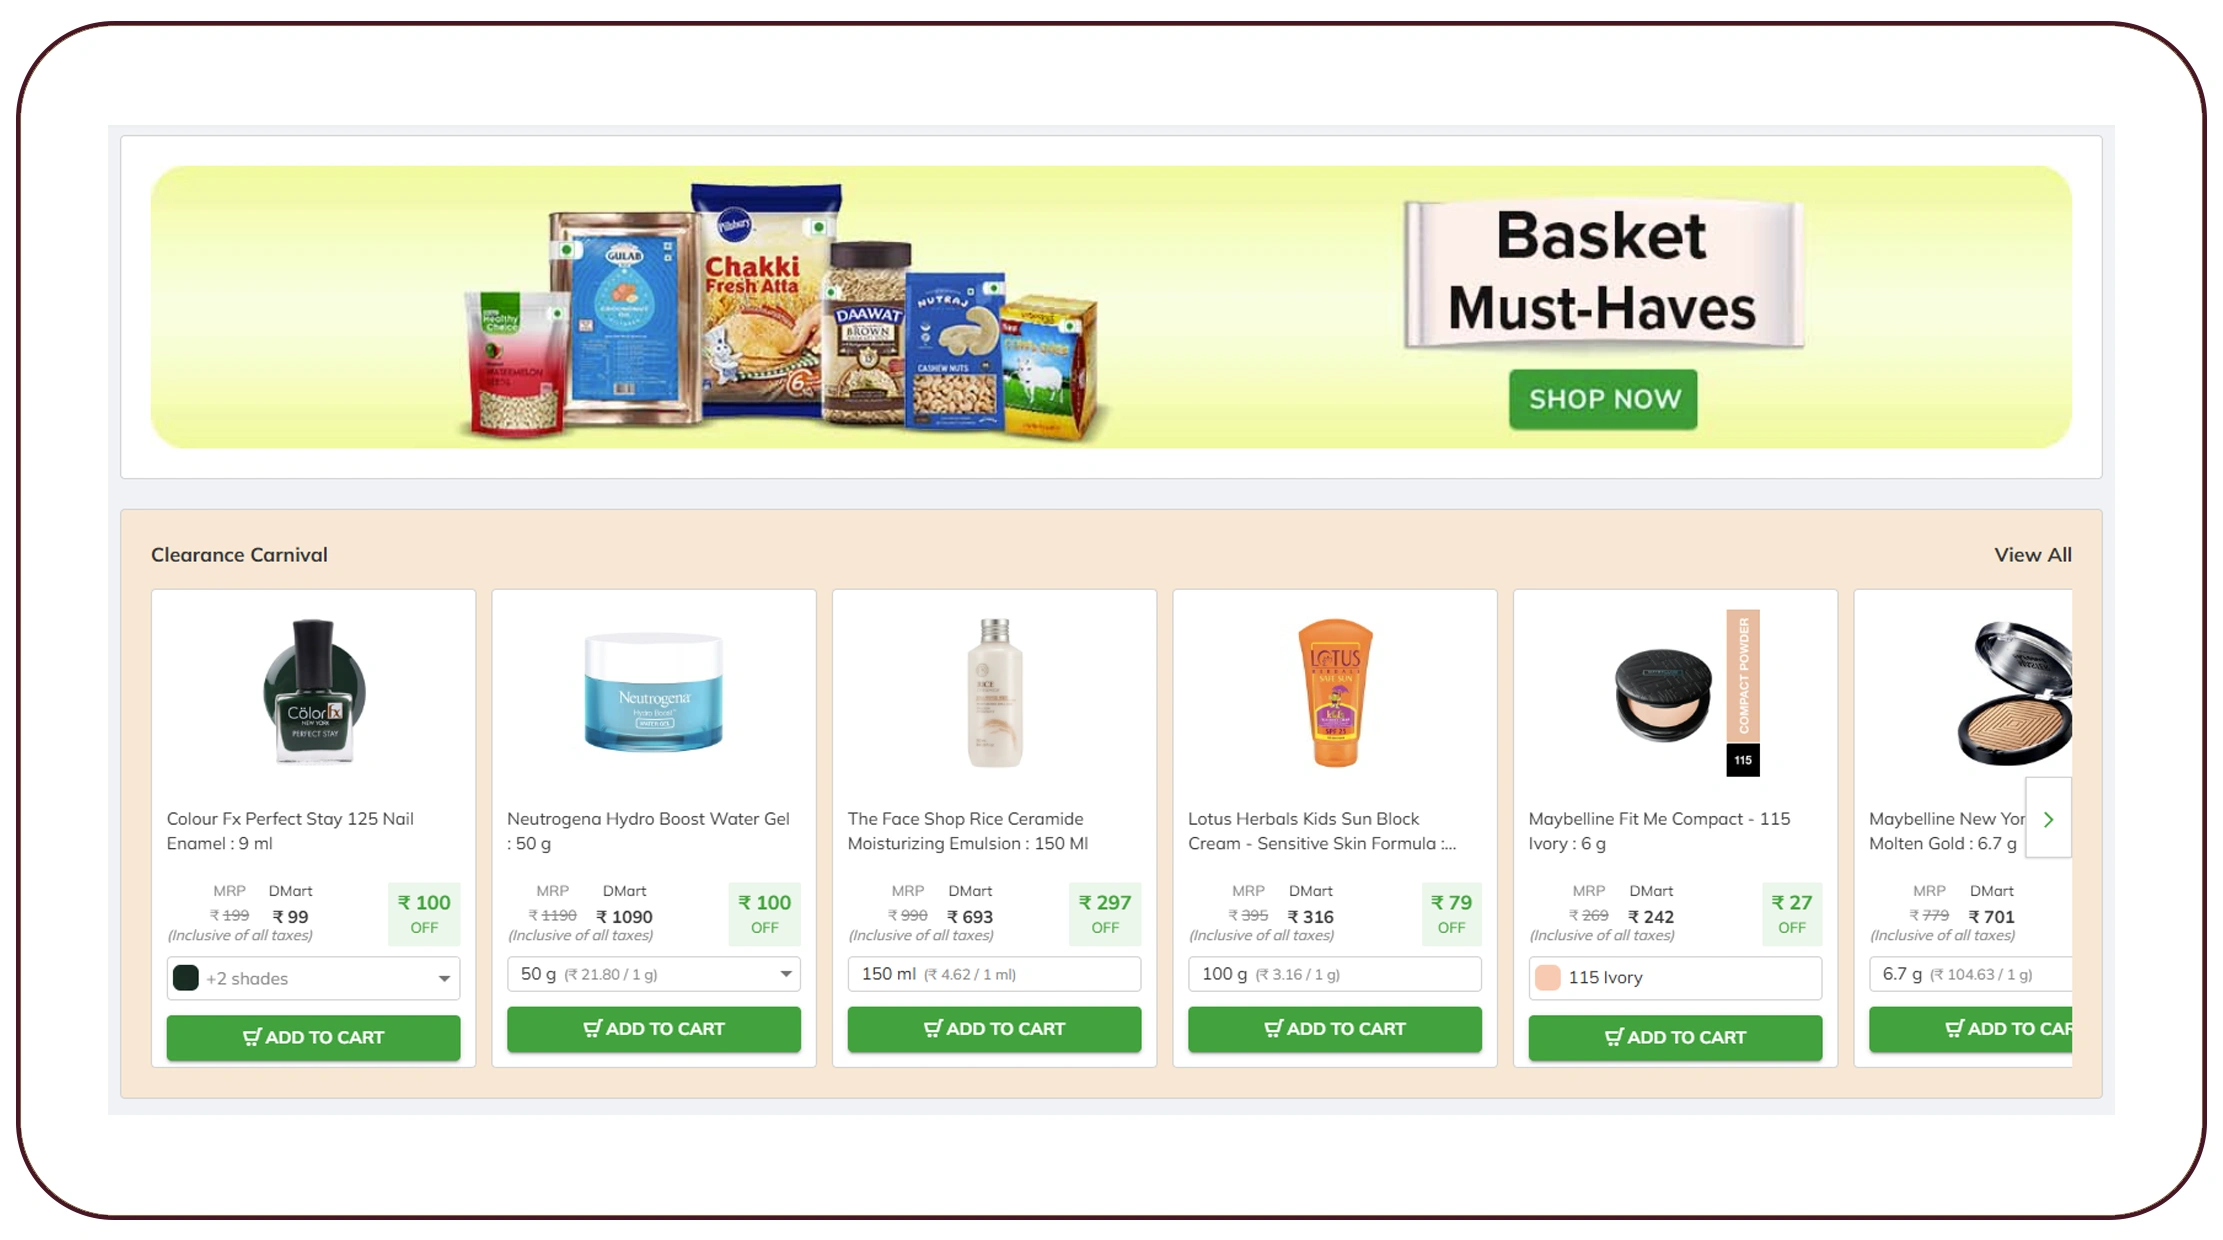
Using a DMart pricing strategy data extractor, analysts can study:
- EDLP (Everyday Low Pricing) trends
- Promotional timing patterns
- Bundle pricing behavior
- Regional variance in essential goods
| Category | Metro Avg Price (₹) | Tier-2 Avg Price (₹) | % Difference |
|---|---|---|---|
| Edible Oil 1L | 145 | 152 | 4.8% |
| Basmati Rice 5kg | 520 | 545 | 4.6% |
| Shampoo 650ml | 388 | 402 | 3.6% |
| Detergent 1kg | 62 | 65 | 4.8% |
These insights allow brands to:
- Adjust distributor pricing
- Plan targeted promotions
- Negotiate better retailer margins
- Optimize inventory allocation
Competitive benchmarking backed by structured datasets ensures brands don't rely on assumptions—but on measurable pricing intelligence.
Scaling Category-Level Monitoring
FMCG benchmarking requires cross-category visibility. A robust Grocery Data Scraping API enables structured extraction of essentials like grains, dairy, packaged foods, snacks, and beverages.
| Year | Grocery Online Share % | Avg Price Variation % |
|---|---|---|
| 2020 | 6% | 3% |
| 2021 | 8% | 4% |
| 2022 | 10% | 5% |
| 2023 | 12% | 4.5% |
| 2024 | 14% | 4% |
| 2025* | 16% | 3.8% |
| 2026* | 18% | 3.5% |
Structured grocery monitoring helps:
- Identify high-velocity SKUs
- Detect underpriced competitors
- Analyze promotional depth
- Improve pricing elasticity modeling
By consolidating datasets across years, businesses gain long-term benchmarking advantages instead of short-term snapshots.
Monitoring Packaged Food Trends
Packaged food pricing is highly sensitive to commodity costs and promotional cycles. Using a Food Data Scraping API, businesses can track:
- Snack price volatility
- Beverage promotional frequency
- Seasonal demand spikes
- Pack-size shrinkflation patterns
| Year | Avg Snack Price (₹) | Promo Frequency % |
|---|---|---|
| 2020 | 20 | 18% |
| 2021 | 22 | 21% |
| 2022 | 25 | 24% |
| 2023 | 26 | 23% |
| 2024 | 27 | 20% |
| 2025* | 29 | 18% |
| 2026* | 30 | 17% |
These datasets reveal:
- Inflation pass-through trends
- Reduced discount dependency
- Premiumization shifts
- Urban demand growth
City-level scraping enables hyper-local pricing intelligence, helping brands tailor pricing and promotion strategies regionally.
Turning Raw Data into Strategic Assets
Raw scraped data becomes valuable only when structured properly. Clean, normalized Web Scraping Datasets enable:
- Historical trend forecasting
- BI dashboard integration
- Demand prediction modeling
- Margin sensitivity simulations
| Year | Retailers Using Data Analytics % |
|---|---|
| 2020 | 38% |
| 2021 | 44% |
| 2022 | 51% |
| 2023 | 59% |
| 2024 | 66% |
| 2025* | 72% |
| 2026* | 78% |
Structured datasets eliminate inconsistencies such as duplicate SKUs, inconsistent pack-size formatting, or mismatched category tagging. With standardized data pipelines, brands gain long-term benchmarking clarity across multiple cities and product categories.
Why Choose Real Data API?
Real Data API simplifies retail intelligence by offering scalable extraction infrastructure tailored to FMCG businesses. Whether your focus is multi-city benchmarking or category-specific analysis, our solutions ensure reliable automation.
With Real Data API, you can efficiently Scrape DMart data to track FMCG pricing and enable accurate Price Comparison across categories and regions. Our systems deliver:
- Automated city-wise extraction
- Clean, structured outputs
- Real-time and historical tracking
- API-ready integrations
- Secure, scalable infrastructure
By combining automation with analytics-ready datasets, businesses gain faster decision cycles and improved competitive agility.
Conclusion
In India's rapidly evolving FMCG landscape, pricing intelligence is no longer optional—it is strategic. From inflation monitoring to regional benchmarking, automated systems help brands stay ahead of shifting market conditions.
When you Scrape DMart data to track FMCG pricing, you unlock measurable insights into discounts, SKU expansion, city-wise price gaps, and promotional intensity. Structured retail datasets empower smarter decisions, stronger negotiations, and improved profitability.
Ready to transform your retail intelligence strategy? Partner with Real Data API today and Scrape DMart data to track FMCG pricing with precision and scale.
Latest posts

Why Brands Use Competitive Data Intelligence to Increase Market Share in Highly Competitive Markets?

How To Scrape Competitor Data To Support Market Entry Strategy And Expansion Planning For Data-Driven Business Growth?

How Hotel Occupancy Intelligence Through Public Data Sources Is Reshaping Revenue Management

The ZIP Code Advantage: How Hyper-Local Amazon Product Data Collection Is Redefining Retail Intelligence
Real Data API stands out as one of the premier global companies specializing in web data Scraping and web extraction.


Rating 4.7
Rating 4.7
Rating 4.5
Rating 4.7
Rating 4.7


Disclaimer : RealData API functions solely as an independent data infrastructure and technology solutions provider. We build customized automation workflows designed to collect publicly accessible web data based exclusively on client instructions. RealData API neither owns proprietary datasets nor engages in the sale or redistribution of extracted information. Our operations are limited strictly to lawful public web data processing and never involve unauthorized access to restricted systems or private networks. Any company names, trademarks, logos, or brand references displayed on this website are used purely for demonstrative and illustrative purposes to showcase our technical capabilities and do not imply endorsement, partnership, or affiliation. Use of our platform and services remains subject to our Terms of Service.