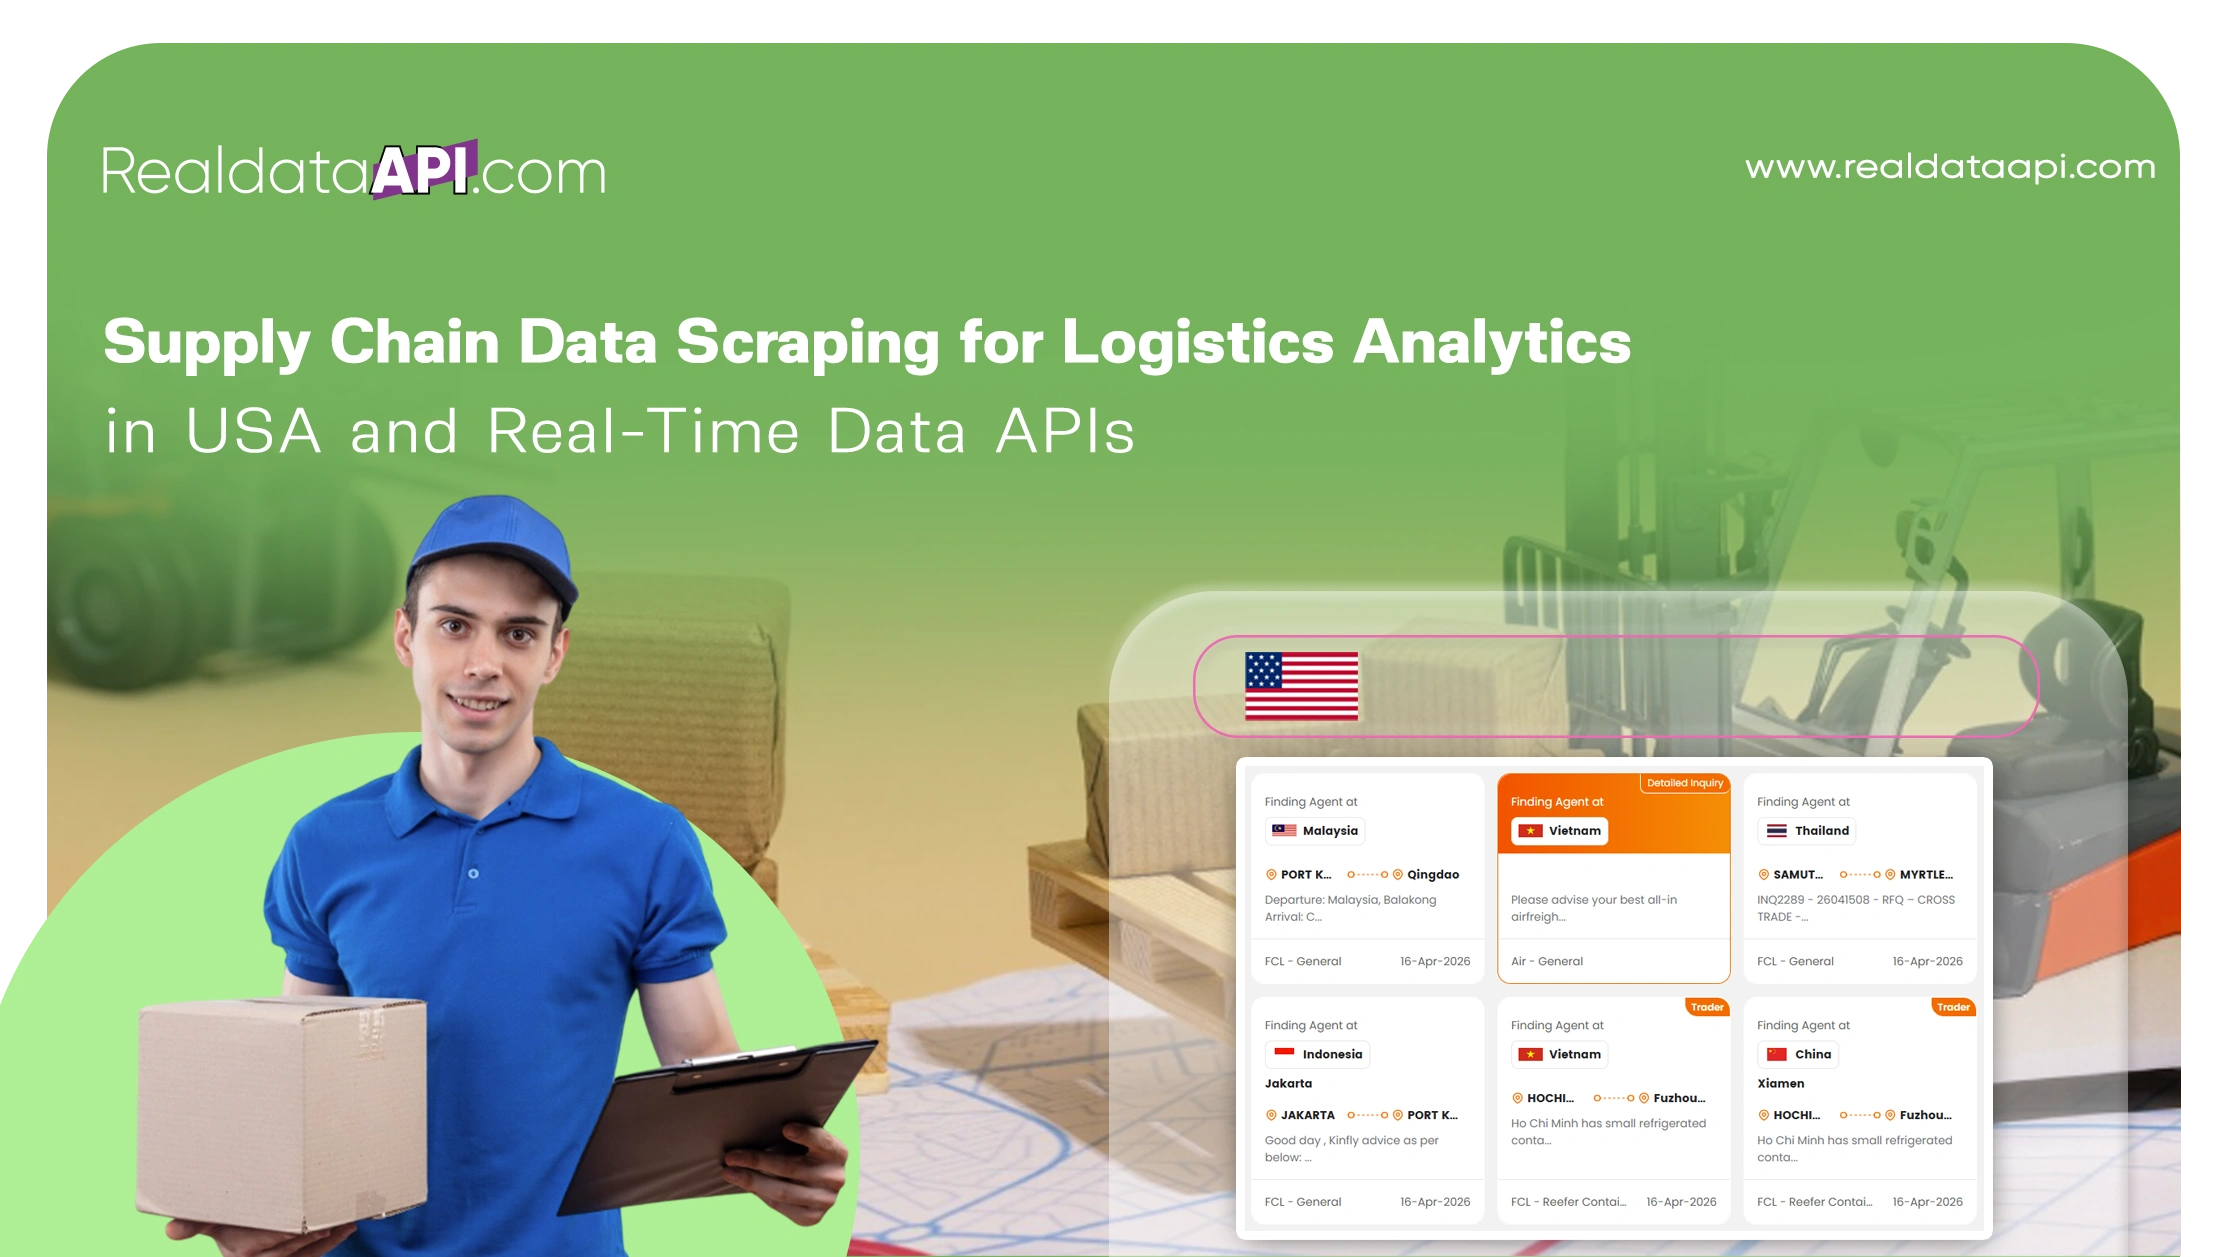
Introduction
The United States supply chain ecosystem is one of the most complex and economically consequential in the world. Spanning millions of suppliers, warehouses, transportation networks, port facilities, and distribution centers, the US supply chain processes trillions of dollars in goods annually across every industry vertical — from automotive and electronics to food and beverage, retail, pharmaceuticals, and industrial manufacturing. And unlike most other business functions, supply chain performance is directly measured in dollars lost or saved every single day through the combined effect of freight rate fluctuations, inventory positioning decisions, carrier selection, demand forecast accuracy, and vendor pricing dynamics.
Yet despite the enormous financial stakes, the majority to scrape logistics data for demand analysis in the USA for supply chain organizations still make critical decisions based on lagged data — periodic benchmark reports, quarterly supplier reviews, and annual contract negotiations that reflect market conditions from weeks or months ago. Web scraping supply chain market intelligence in USA addresses this gap at its root: by enabling organizations to collect, normalize, and analyze supply chain-relevant data continuously from the public web — carrier websites, freight exchanges, supplier portals, commodity indexes, port authority feeds, and e-commerce demand signals — in real time.
This article explores the data sources, tools, use cases, and intelligence outputs that define modern supply chain data scraping for logistics analytics in USA, and how a real-time supply chain data intelligence API transforms fragmented market data into a unified competitive asset.
$1.3T
US logistics market value 2025
22%
Freight as share of total supply chain cost
40%+
Spot rate volatility in peak freight cycles
$1.8T
US inventory carrying cost annually
Why Supply Chain Intelligence Requires Real-Time Data
The fundamental challenge of supply chain management in the United States is not a lack of data — it is data latency. Every decision that supply chain managers make, from carrier selection and freight procurement to inventory replenishment and demand planning, is only as good as the market data informing it. And in a market where spot freight rates can move 15–20% in a single week, port congestion can emerge without warning, supplier pricing can shift with raw material costs, and consumer demand signals can reverse direction within days, decisions made on data that is even a week old can carry significant financial consequences.
Web scraping supply chain market intelligence in USA solves this latency problem by creating a continuous data collection pipeline that pulls structured, normalized intelligence from public web sources at the speed the market demands — hourly for freight rate monitoring, daily for inventory and pricing signals, and weekly for broader market trend analysis. The result is a supply chain data scraper USA framework that gives organizations the same real-time market visibility that financial traders expect as standard — applied to the operational decisions that drive supply chain cost and performance.
"The supply chain organization that sees a freight rate spike, a supplier price increase, or a demand surge before it arrives on a benchmark report has a two-week head start on every competitor still reading last month's data."
Key Data Sources for Supply Chain Market Intelligence
Effective supply chain data scraping for logistics analytics in USA draws from a diverse set of publicly accessible sources, each contributing a distinct intelligence layer to the overall supply chain picture.
DAT / Truckstop.com
Spot truckload and LTL rates by lane, load-to-truck ratios, and carrier capacity signals — the primary source for real-time freight market intelligenceCarrier Rate Portals
UPS, FedEx, XPO, and regional carrier rate cards, fuel surcharge tables, and accessorial fee schedules updated on carrier tariff cyclesPort Authority Feeds
Container dwell times, vessel arrival schedules, congestion indices, and import/export volume data from major US ports including LA, Long Beach, New York, and SavannahFreightos / Xeneta
Ocean freight spot rates by container type and trade lane, air cargo benchmarks, and contract vs. spot rate differentials for import/export supply chainsE-Commerce Platforms
Amazon, Walmart, and Target product availability signals, price change monitoring, and inventory depth indicators as demand-side supply chain intelligenceCommodity & EIA Indices
Steel, aluminum, plastics, fuel, and agricultural commodity price indices that drive upstream supplier pricing and total landed cost calculations
Tools and Infrastructure for Supply Chain Data Scraping
Building a production-grade supply chain data scraper for US logistics analytics requires a layered toolset matched to the technical complexity of each data source. Freight rate portals, carrier websites, and e-commerce platforms all use dynamic JavaScript rendering and varying anti-bot protections, demanding enterprise-grade browser automation and crawling infrastructure.
Python + Playwright
Browser automation for JS-rendered freight exchanges, carrier rate calculators, and port authority dashboards requiring interactive form inputsScrapy
High-throughput crawling for large-scale structured extraction across carrier tariff pages, commodity indices, and supplier pricing portals simultaneouslyWeb Scraping API
Managed scraping infrastructure with proxy rotation and CAPTCHA resolution — the core of scalable enterprise web crawling for supply chain intelligence programsEnterprise Web Crawling
Distributed crawling systems monitoring hundreds of supply chain data sources continuously, with configurable alert triggers on rate, price, or availability threshold breachesWeb Scraping Services USA
Managed end-to-end supply chain data extraction using Web Scraping Services USA for logistics teams without dedicated engineering resources — from collection through structured, normalized deliveryReal-Time Data API
Pre-built supply chain data APIs delivering continuously refreshed freight rates, inventory signals, demand indices, and commodity pricing without custom pipeline development
# Supply chain market intelligence scraper — freight + demand signals
import asyncio
from playwright.async_api import async_playwright
import pandas as pd
from datetime import datetime

async def scrape_supply_chain_signals(origin, destination, commodity):
    async with async_playwright() as p:
        browser = await p.chromium.launch(headless=True)
        page = await browser.new_page()
        # Freight rate extraction
        freight_url = (f"https://example-freight-exchange.com/rates"
                       f"?origin={origin}&dest={destination}&mode=TL")
        await page.goto(freight_url, wait_until="networkidle")
        rates = await page.query_selector_all(".rate-card")
        records = []
        for r in rates:
            carrier = await r.query_selector(".carrier-name")
            rate = await r.query_selector(".spot-rate")
            capacity = await r.query_selector(".capacity-index")
            records.append({
                "lane": f"{origin}→{destination}",
                "commodity": commodity,
                "carrier": await carrier.inner_text() if carrier else None,
                "spot_rate": await rate.inner_text() if rate else None,
                "capacity_idx": await capacity.inner_text() if capacity else None,
                "scraped_at": datetime.utcnow().isoformat(),
            })
        await browser.close()
        return pd.DataFrame(records)

# Monitor key US supply chain corridors
midwest_west = asyncio.run(scrape_supply_chain_signals("Chicago-IL","Los-Angeles-CA","Consumer Goods"))
south_ne = asyncio.run(scrape_supply_chain_signals("Dallas-TX", "New-York-NY", "Retail"))
port_inland = asyncio.run(scrape_supply_chain_signals("Long-Beach-CA","Memphis-TN", "Import"))
supply_chain_dataset = pd.concat([midwest_west, south_ne, port_inland])
supply_chain_dataset.to_csv("usa_supply_chain_intelligence.csv", index=False)
Key Use Cases: What Supply Chain Scraping Powers

Demand Analysis and Inventory Optimization
Scraping logistics data for demand analysis in the USA enables supply chain planners to monitor real-time product availability signals from Amazon, Walmart, and major retail platforms — tracking when competitor SKUs go out of stock, when new product categories surge in search volume, and when regional demand patterns diverge from national forecasts. These signals feed inventory replenishment models with market-side demand intelligence that internal POS data alone cannot provide.
Dynamic Pricing and Freight Cost Management
Supply chain organizations that integrate scraped freight rate data into their dynamic pricing systems can automatically adjust product pricing to reflect real-time transportation cost changes — passing cost increases through to customers when spot rates spike and capturing margin when rates fall. This closed-loop between freight rate intelligence and pricing strategy is only possible with a continuous, structured supply chain data feed that updates as frequently as the freight market moves.
Supplier Price Monitoring and Negotiation
Web scraping supply chain market intelligence in USA includes monitoring publicly available supplier pricing, commodity indices, and manufacturing cost signals that inform procurement negotiations. A procurement team that knows current steel prices, resin costs, or agricultural commodity benchmarks before entering a supplier negotiation has a structural information advantage — and a scraping pipeline that collects this data continuously ensures that advantage is always current.
Port Congestion and Disruption Early Warning
Scraping container dwell time data, vessel arrival schedules, and congestion indices from US port authority websites provides an early warning system for import supply chain disruptions. When container dwell times at the Port of Los Angeles begin rising above baseline, supply chain teams with real-time data visibility can reroute shipments, accelerate inland transit, or adjust safety stock levels days before the congestion appears in downstream delivery delays.
Supply Chain Intelligence Dataset — Key Metrics
| Intelligence Layer | Primary Source | Supply Chain Application | Update Cadence |
|---|---|---|---|
| Spot freight rates by lane | DAT, Truckstop.com | Carrier selection & dynamic pricing | Hourly |
| Carrier rate cards & surcharges | UPS, FedEx, XPO portals | Parcel & LTL cost modeling | Daily |
| Port congestion & dwell times | Port authority feeds | Import risk monitoring | Daily |
| E-commerce demand signals | Amazon, Walmart, Target | Inventory & replenishment planning | Daily |
| Commodity price indices | EIA, CME, LME feeds | Supplier negotiation & cost forecasting | Weekly |
| Ocean & air freight benchmarks | Freightos, Xeneta | International lane procurement | Daily |
Enterprise Web Crawling for Multi-Tier Supply Chain Intelligence
For enterprise manufacturers, large retailers, and national 3PLs managing multi-tier supply chains across dozens of US distribution regions, enterprise web crawling infrastructure elevates supply chain data scraping from a departmental tool to a company-wide strategic asset. A centralized enterprise crawling system that monitors freight rates, demand signals, supplier pricing, and port data across every relevant source simultaneously produces a unified supply chain intelligence layer that informs decisions from the C-suite to the warehouse floor.
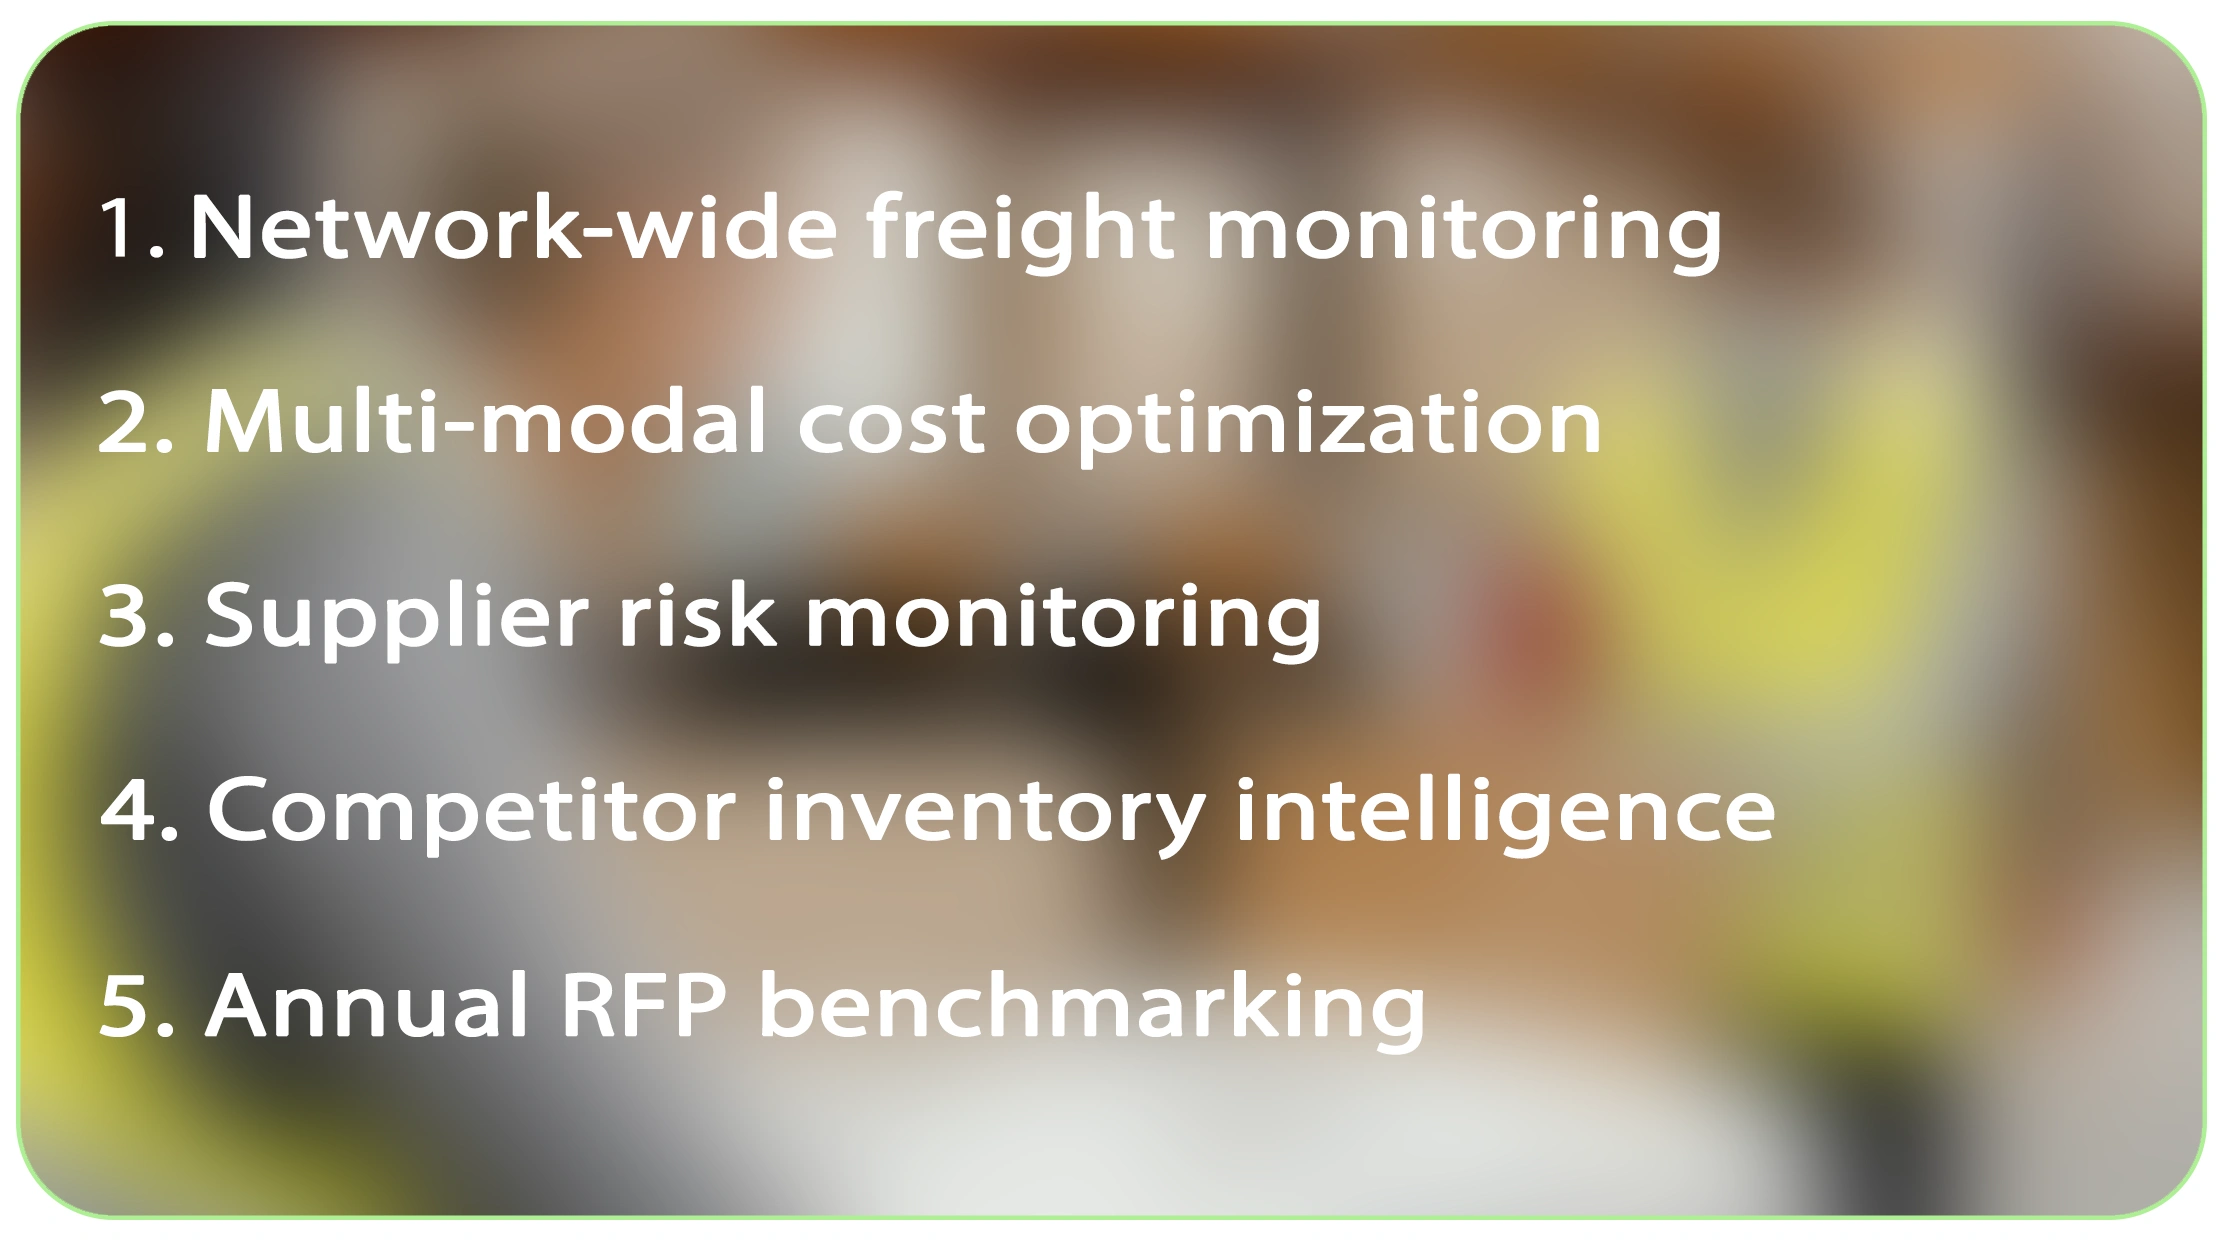
Enterprise Web Crawling — Supply Chain Intelligence Applications
- Network-wide freight monitoring — tracking spot and contract rate movements across every lane in an enterprise shipper's distribution network, updated on schedules matched to each lane's volatility profile
- Multi-modal cost optimization — comparing truckload, LTL, intermodal, ocean, and air rates for the same shipment origin-destination pair to identify mode shift opportunities in real time
- Supplier risk monitoring — scraping news feeds, regulatory databases, and financial disclosure sources for early warning signals on supplier financial distress, quality incidents, or geopolitical disruptions
- Competitor inventory intelligence — monitoring e-commerce platform availability data for competitor SKUs to identify supply chain disruptions or demand shifts before they appear in market share data
- Annual RFP benchmarking — using scraped historical freight and supplier rate datasets to benchmark carrier and vendor bids during procurement cycles, ensuring negotiated rates genuinely reflect market conditions
Conclusion: Real-Time Data Is the New Supply Chain Resilience
The US supply chain market rewards organizations that can see market changes before they arrive — and penalizes those still operating on last quarter's benchmark reports. Supply chain data scraping for logistics analytics in USA, real-time supply chain data intelligence via API, and enterprise web crawling infrastructure are not experimental capabilities. They are the operational data foundation of supply chain organizations that consistently outperform on cost, service, and resilience across every market cycle.
Whether the application is scraping logistics data for demand analysis, building a dynamic pricing engine that responds to real-time freight cost movements, monitoring port congestion for import risk management, or deploying enterprise web crawling across a national distribution network, the data infrastructure requirement is the same: clean, structured, continuously refreshed supply chain market intelligence that reflects the US market as it actually is — right now, across every relevant source and signal.
For supply chain teams and logistics analytics organizations that want this capability without the complexity of building and maintaining multi-source scraping pipelines, Real Data API is the most complete and production-ready solution available today. Real Data API provides structured, continuously refreshed access to a comprehensive US supply chain intelligence dataset — spanning spot and contract freight rates across all major US lanes and modes, port congestion and dwell time data, e-commerce demand signals, commodity price indices, carrier surcharge tables, and ocean and air freight benchmarks — all delivered through a clean, scalable web scraping API and enterprise web crawling infrastructure purpose-built for logistics analytics and supply chain market intelligence. From freight brokers building dynamic pricing engines to enterprise manufacturers optimizing multi-tier supply chain costs, Real Data API delivers the data foundation that turns supply chain complexity into competitive advantage.
Real Data API — US Supply Chain Intelligence, Always Current
Access real-time freight rates, port congestion data, e-commerce demand signals, commodity price indices, and carrier surcharge tables across the USA — all through a single web scraping API and enterprise web crawling infrastructure built for supply chain market intelligence and logistics analytics.
Statistics and data figures are illustrative estimates based on publicly available market sources. Always verify against current platform data. Review each platform's Terms of Service before initiating any data collection program.
Latest posts
How Review scraping and monitoring services Help Businesses Track Customer Sentiment and Protect Brand Reputation in 2026?

How Real Estate Investment Insights Using RERA Data Scraping Help Investors Minimize Risk and Maximize Returns
How Can Web Scraping Customer Feedback Analytics for Product Innovation Improve Product Success?
How to Scrape Travel Review Data Analytics for Hospitality Businesses to Enhance Guest Experience?
What Makes Web Scraping ITA Airways Fare Data Valuable for Accurate Airline Fare Monitoring?
Real Data API stands out as one of the premier global companies specializing in web data Scraping and web extraction.


Rating 4.7
Rating 4.7
Rating 4.5
Rating 4.7
Rating 4.7


Disclaimer : RealData API functions solely as an independent data infrastructure and technology solutions provider. We build customized automation workflows designed to collect publicly accessible web data based exclusively on client instructions. RealData API neither owns proprietary datasets nor engages in the sale or redistribution of extracted information. Our operations are limited strictly to lawful public web data processing and never involve unauthorized access to restricted systems or private networks. Any company names, trademarks, logos, or brand references displayed on this website are used purely for demonstrative and illustrative purposes to showcase our technical capabilities and do not imply endorsement, partnership, or affiliation. Use of our platform and services remains subject to our Terms of Service.