Introduction
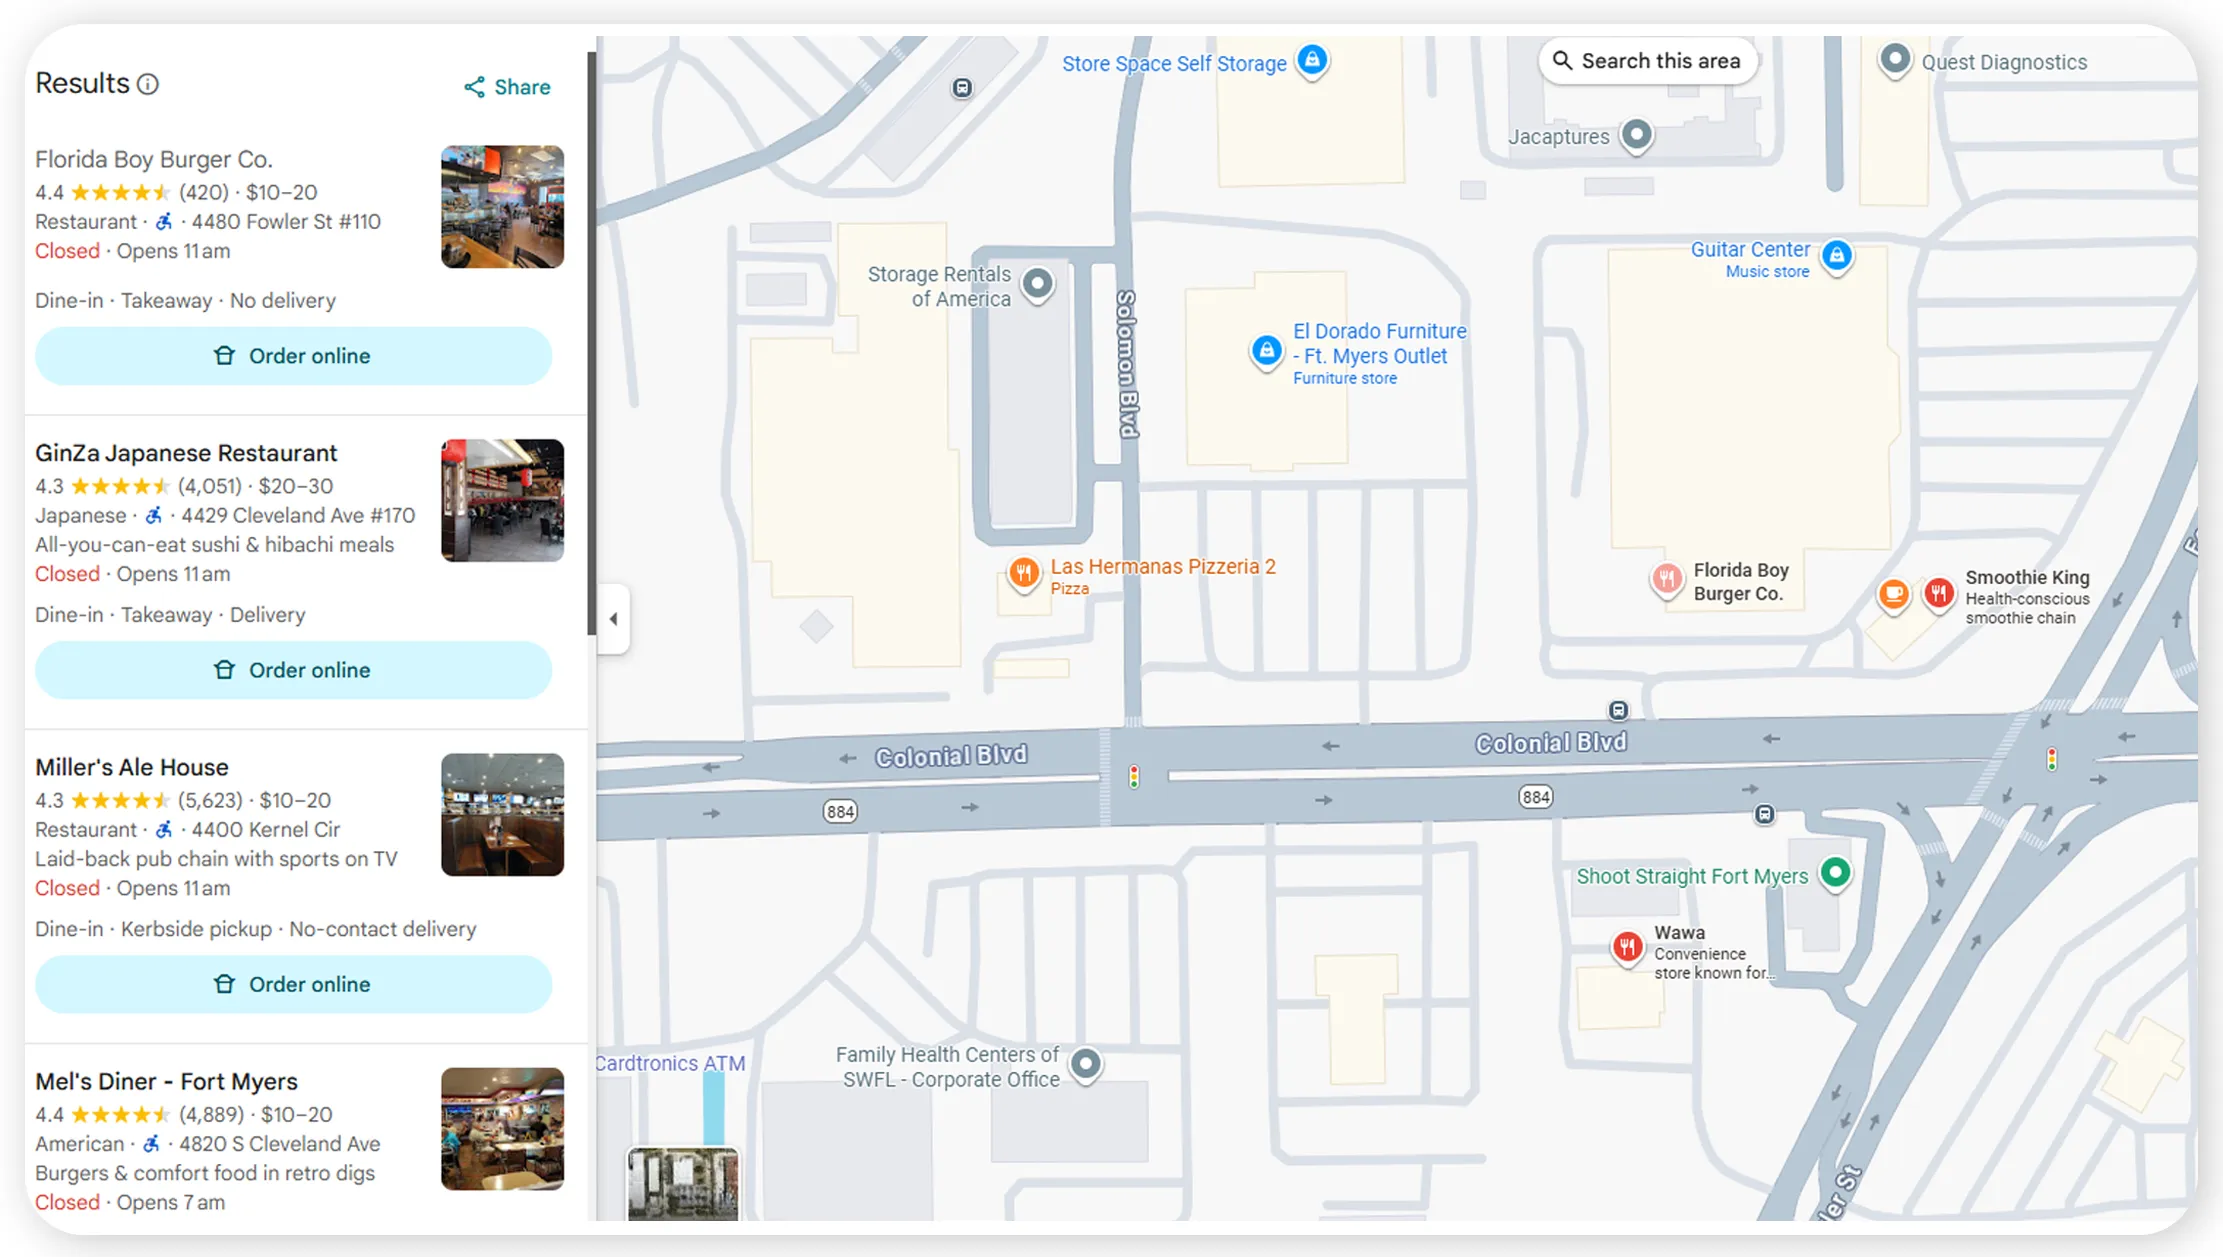
In an increasingly competitive digital economy, businesses must rely on accurate location intelligence to understand market dynamics, customer reach, and competitor presence. Location-based datasets have become a strategic asset for enterprises seeking scalable growth and precise decision-making. One of the most impactful methods to achieve this is Google Maps location data scraping for competitive market mapping, which enables organizations to convert publicly available geospatial data into structured insights.
This research report explores how businesses leverage large-scale location data extraction to map competitive landscapes, assess market saturation, identify underserved regions, and forecast expansion opportunities. By analyzing trends from 2020 to 2026, the report highlights how real-time location intelligence has evolved from basic mapping to advanced predictive analytics. It also demonstrates how structured datasets derived from Google Maps listings, reviews, and points of interest (POIs) empower enterprises across retail, logistics, real estate, and fintech sectors.
Through six in-depth analytical sections supported by statistical tables, this report provides a comprehensive view of market coverage analysis, business density evaluation, and intelligence-driven decision-making. The study concludes by explaining why Real Data API's Web Unlocker API is a preferred partner for scalable, compliant, and reliable data extraction solutions.
Expanding Geographic Visibility
Organizations seeking broader geographic insight increasingly rely on scraping Google Maps data for market coverage analysis to understand where competitors operate and where demand remains unmet. This approach enables businesses to evaluate regional presence, service reach, and infrastructure gaps with precision.
Between 2020 and 2026, enterprises adopted location analytics to guide expansion strategies, optimize distribution networks, and prioritize high-growth zones. Market coverage analysis revealed that companies using location-based datasets improved territory planning accuracy and reduced operational blind spots. Industries such as food delivery, retail chains, and logistics providers benefited significantly from mapping coverage inconsistencies across urban and semi-urban regions.
Market Coverage Adoption Trends (2020–2026)
| Year | Enterprises Using Coverage Analytics (%) | Expansion Success Rate (%) |
|---|---|---|
| 2020 | 38 | 52 |
| 2021 | 44 | 57 |
| 2022 | 53 | 63 |
| 2023 | 61 | 68 |
| 2024 | 69 | 74 |
| 2025 | 76 | 79 |
| 2026 | 82 | 85 |
By integrating market coverage datasets into planning workflows, businesses gain clarity on saturation levels and regional potential, enabling smarter capital allocation and faster market entry.
Understanding Competitive Concentration
Analyzing competitor clustering is critical for identifying market saturation and opportunity zones. Businesses increasingly Extract Google Maps data to analyze business density and evaluate how competitors are distributed across specific locations.
From 2020 onward, data-driven density analysis helped organizations identify over-served markets and pinpoint emerging micro-markets with lower competition. Retail brands used density insights to refine store placement strategies, while service providers leveraged this data to optimize delivery routes and staffing models.
Business Density Insights (2020–2026)
| Year | Avg. Businesses per Sq. Km | New Market Entries (%) |
|---|---|---|
| 2020 | 112 | 21 |
| 2021 | 118 | 25 |
| 2022 | 124 | 29 |
| 2023 | 131 | 33 |
| 2024 | 138 | 38 |
| 2025 | 145 | 42 |
| 2026 | 152 | 47 |
Business density analysis enables enterprises to balance risk and opportunity by avoiding overcrowded markets while targeting high-demand areas with sustainable growth potential.
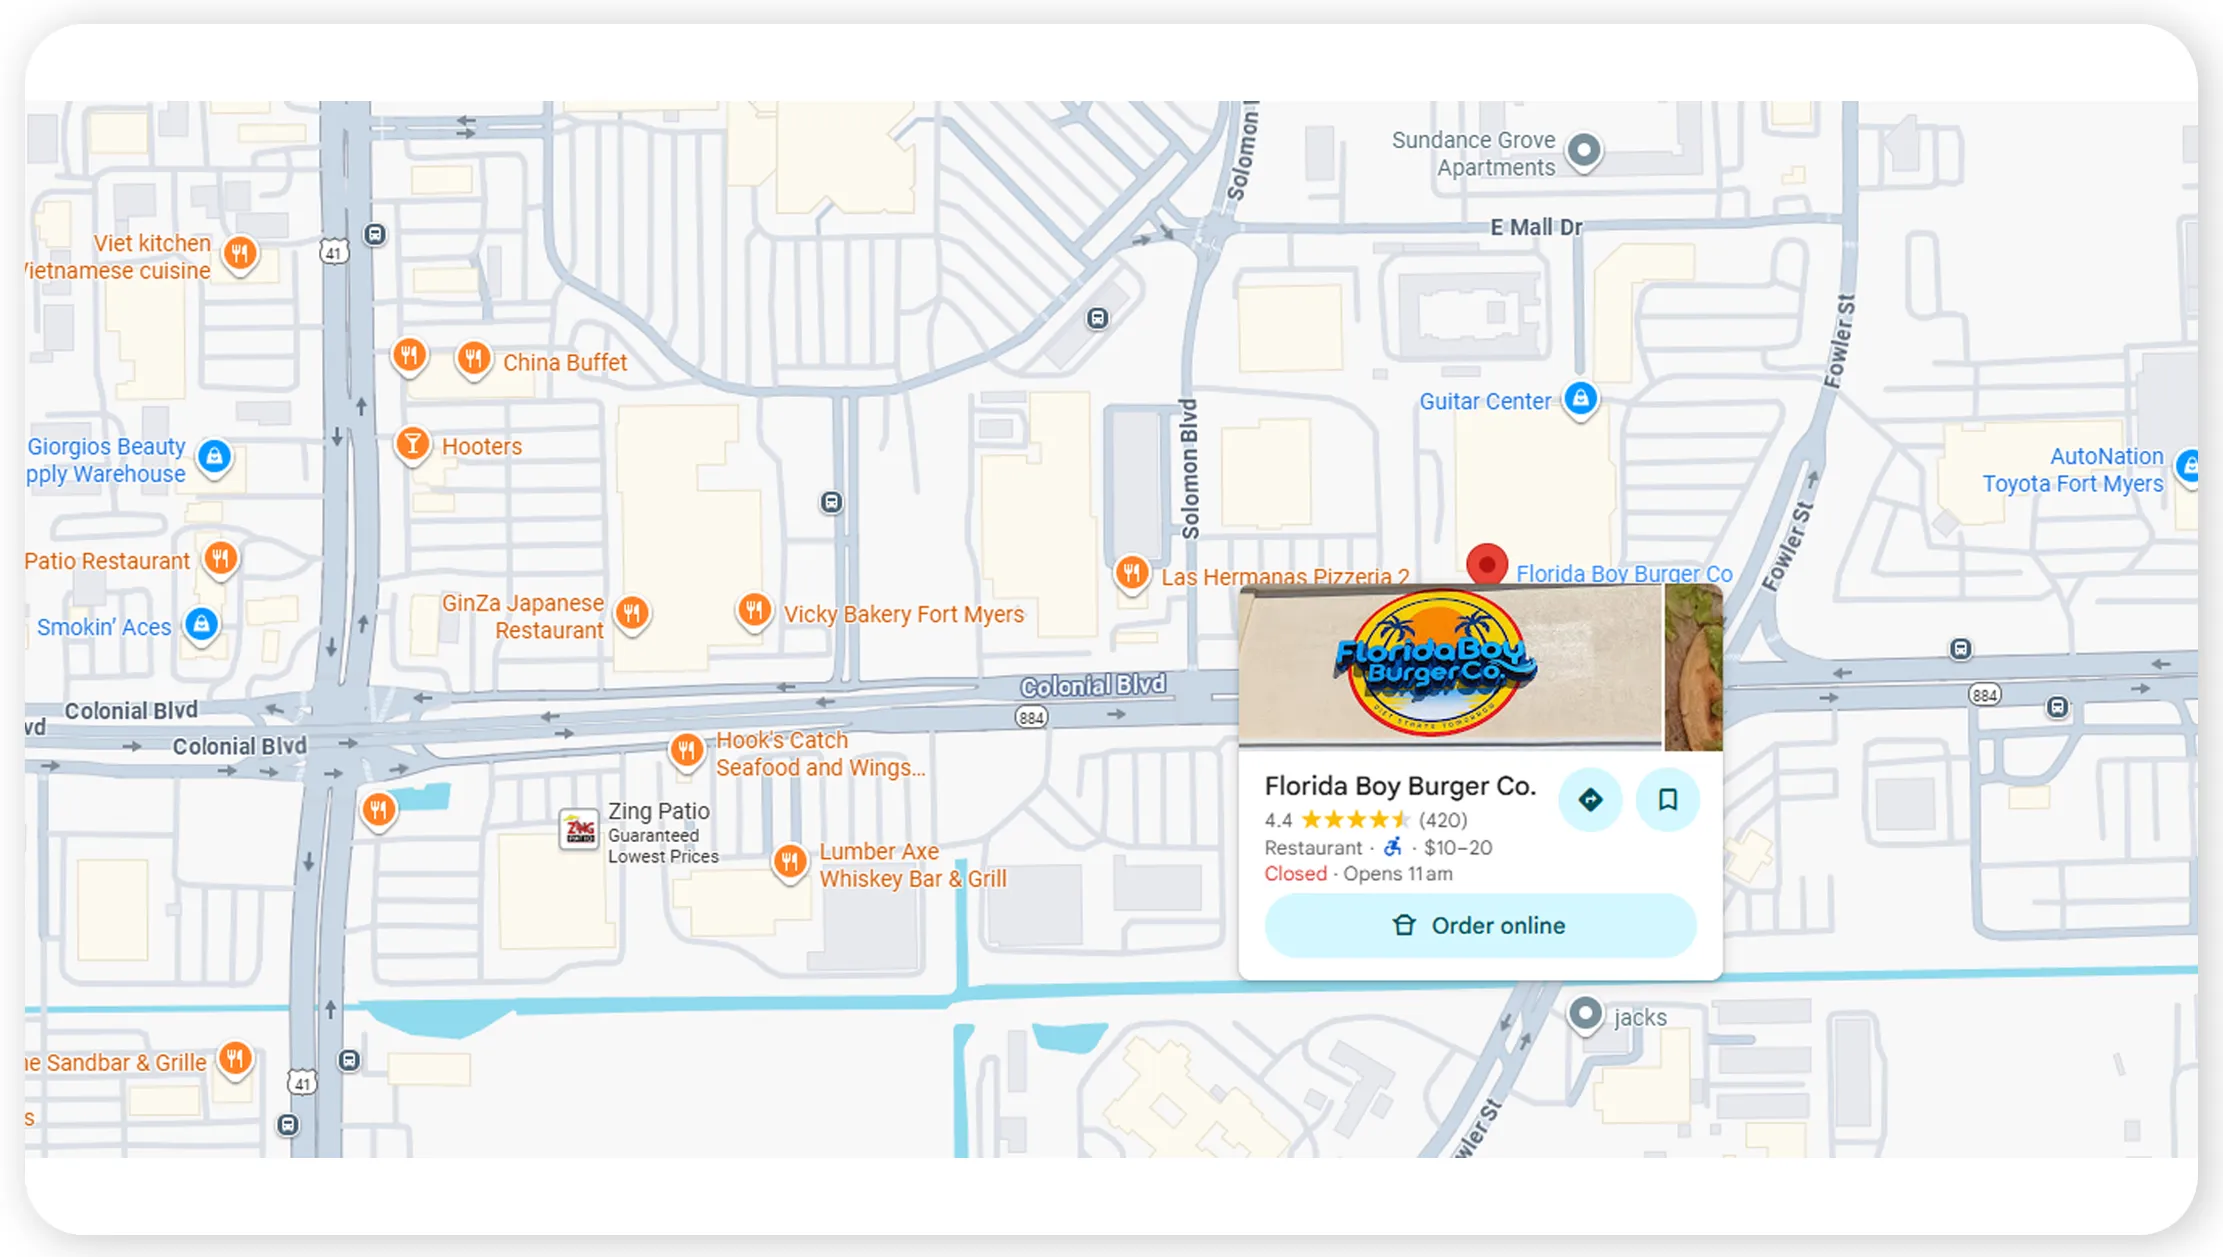
Visualizing Spatial Competition
Advanced visualization techniques rely on Scrape Business location density mapping to convert raw location datasets into actionable intelligence. Density mapping helps businesses visualize competitor concentration and customer accessibility within defined geographic boundaries.
Between 2020 and 2026, adoption of spatial visualization tools increased significantly as enterprises shifted from static reports to dynamic dashboards. These insights improved site selection accuracy and enhanced real-time competitive monitoring. Businesses that implemented density mapping reported improved forecasting accuracy and reduced market-entry risks.
Location Density Mapping Growth (2020–2026)
| Year | Adoption Rate (%) | Decision Accuracy Improvement (%) |
|---|---|---|
| 2020 | 34 | 41 |
| 2021 | 40 | 46 |
| 2022 | 48 | 53 |
| 2023 | 56 | 60 |
| 2024 | 64 | 66 |
| 2025 | 71 | 72 |
| 2026 | 79 | 78 |
Density mapping transforms complex datasets into intuitive visual layers, empowering stakeholders to make faster, more confident decisions.
Unlocking Points of Interest Intelligence
Businesses increasingly depend on Market coverage insights data extraction using google maps POI data to evaluate surrounding infrastructure, customer traffic patterns, and service accessibility. POI-based analysis provides contextual understanding beyond simple location coordinates.
From 2020 to 2026, POI intelligence played a critical role in urban planning, retail expansion, and mobility services. Enterprises leveraged POI datasets to assess proximity to transit hubs, commercial zones, and residential clusters, resulting in more informed strategic decisions.
POI Data Utilization Trends (2020–2026)
| Year | POI Data Usage (%) | Planning Efficiency Gain (%) |
|---|---|---|
| 2020 | 29 | 38 |
| 2021 | 36 | 43 |
| 2022 | 44 | 49 |
| 2023 | 52 | 56 |
| 2024 | 60 | 62 |
| 2025 | 68 | 69 |
| 2026 | 75 | 76 |
POI intelligence adds depth to market mapping by linking business locations with environmental and consumer behavior factors.
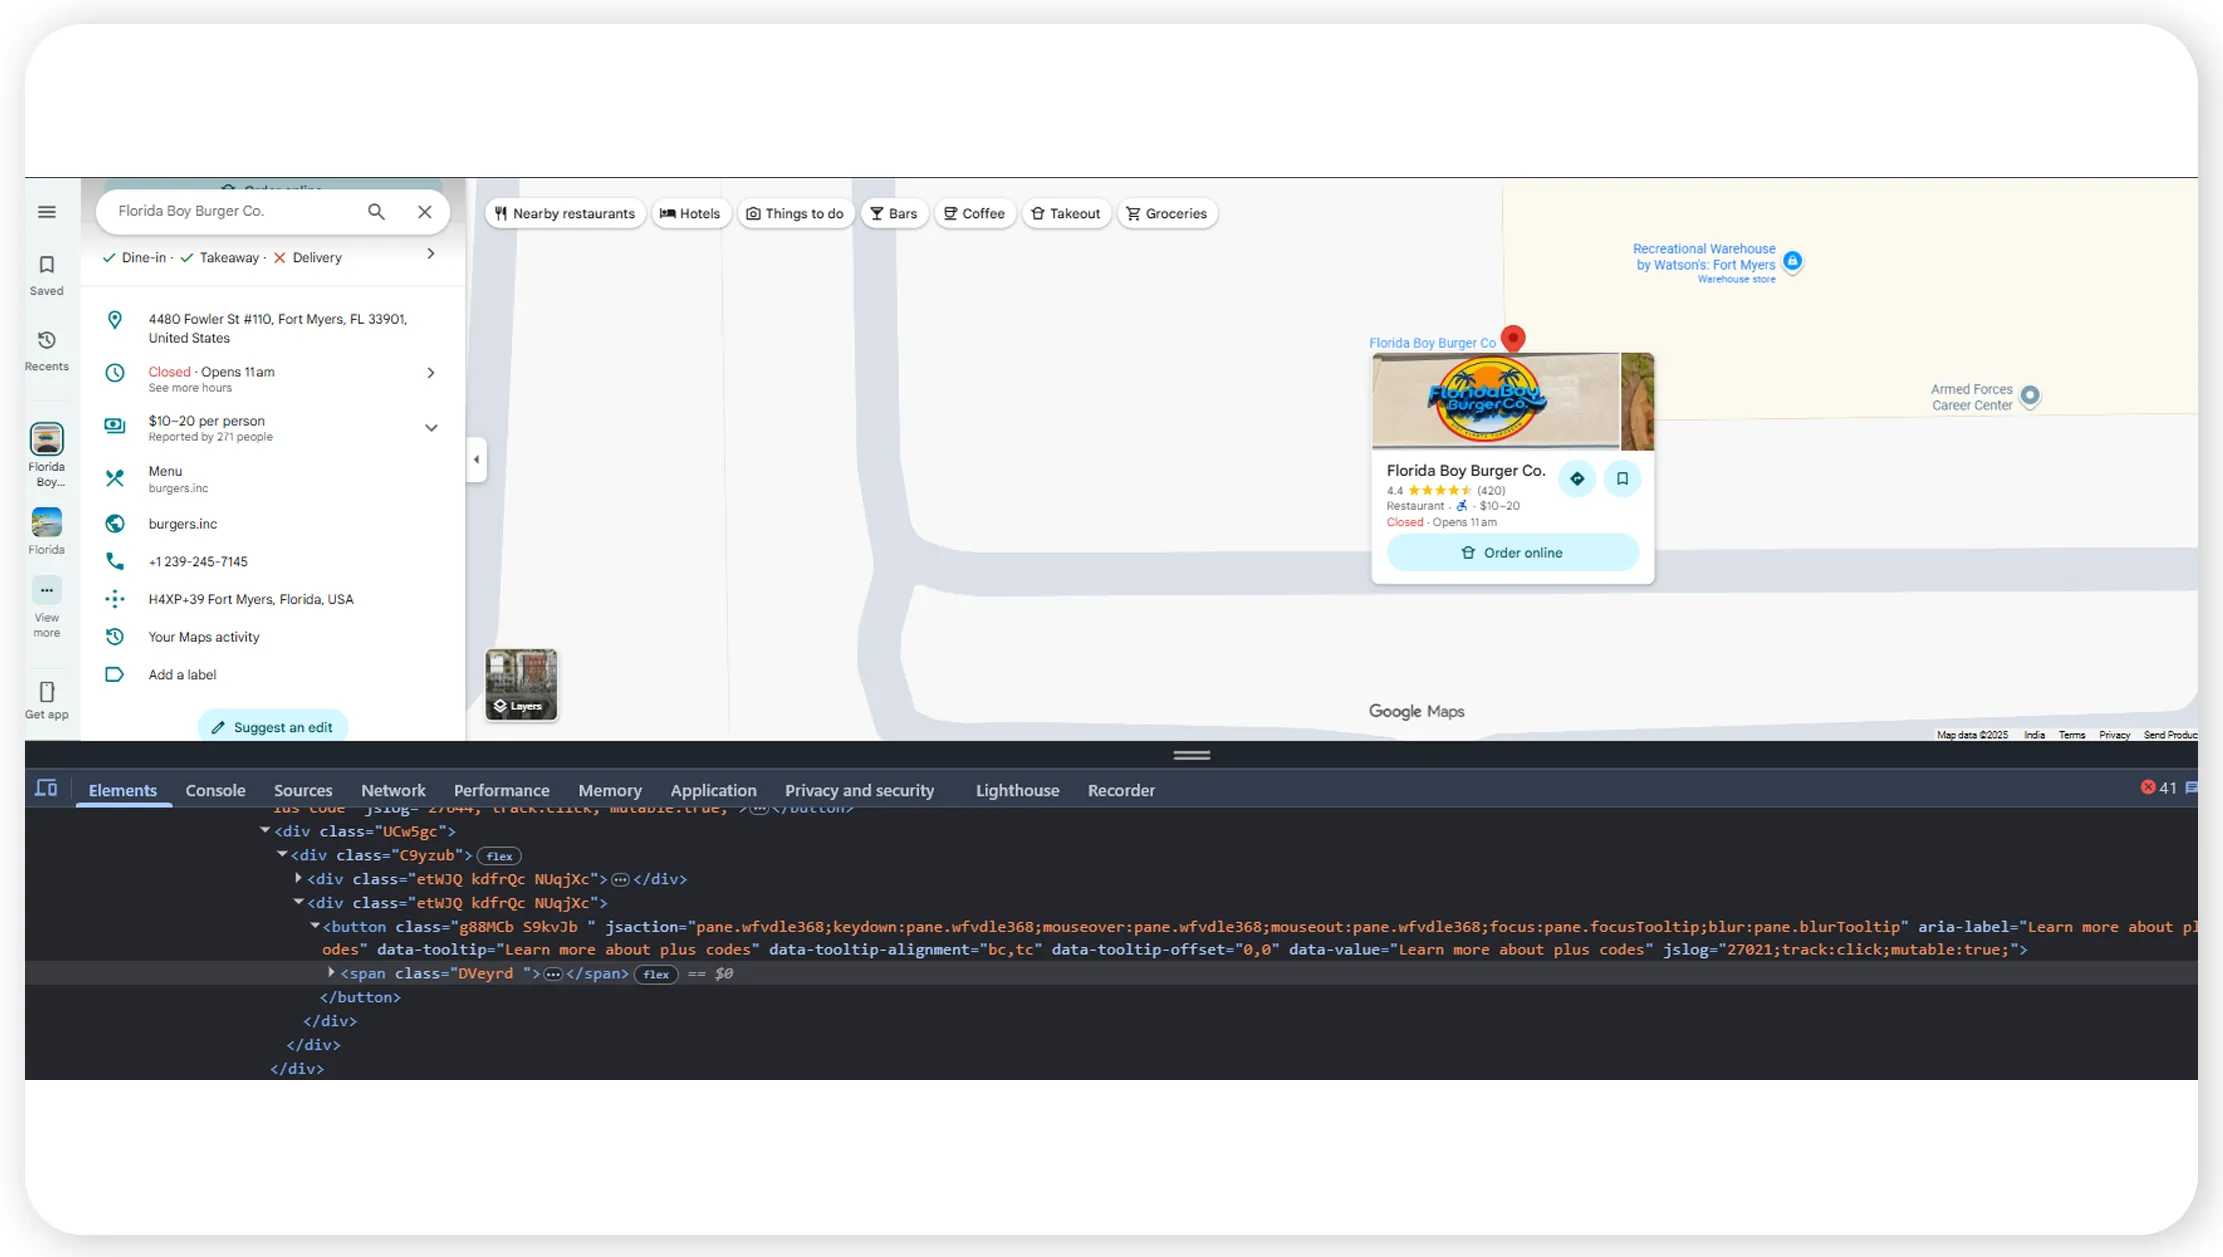
Transforming Public Listings into Insights

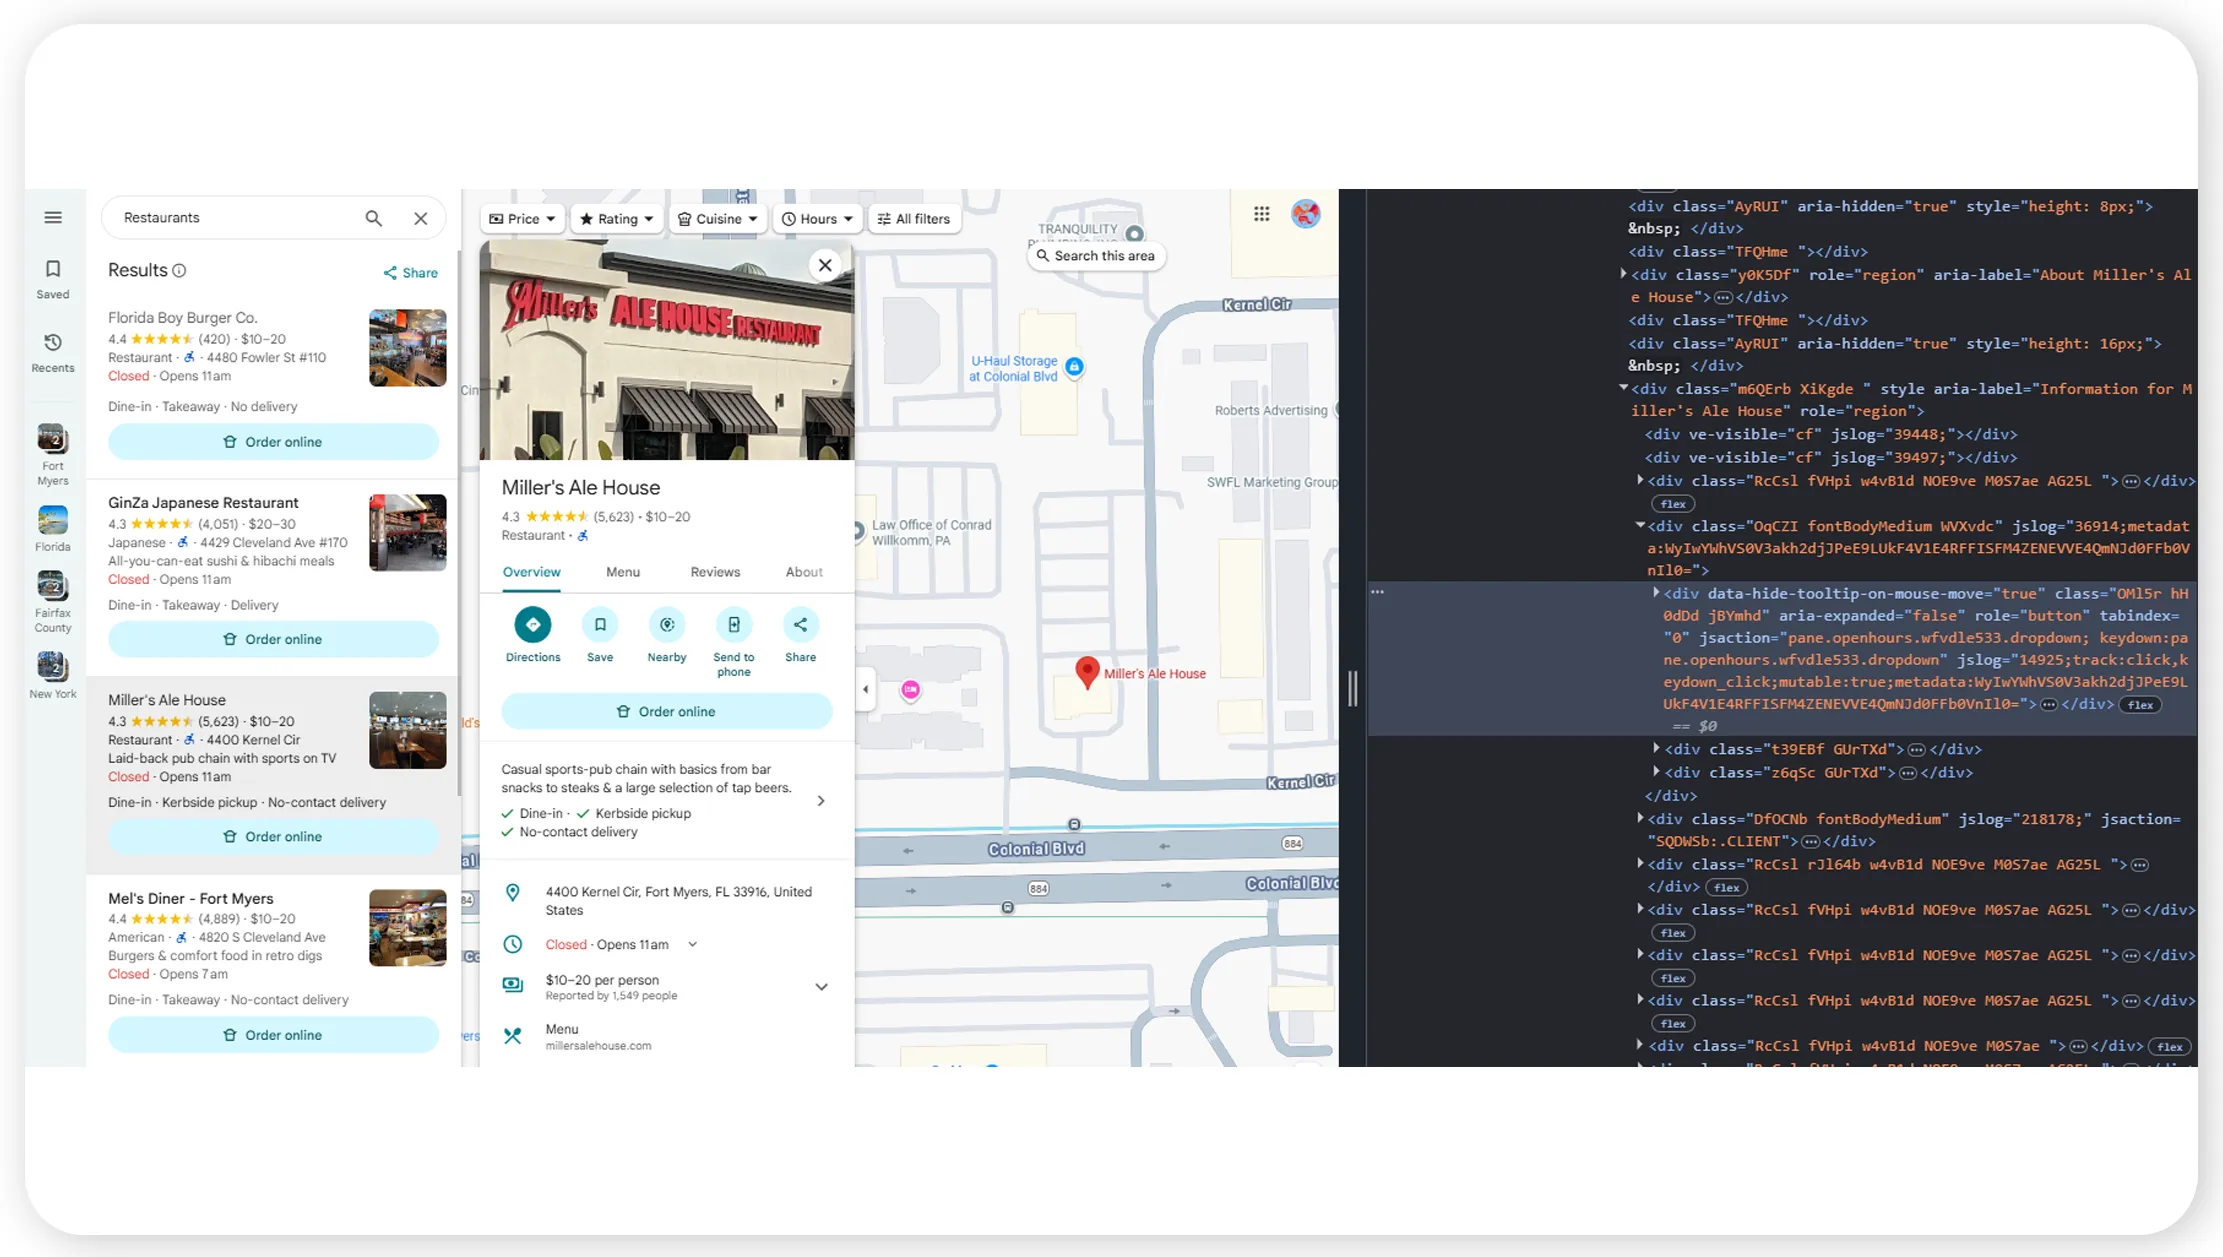
Organizations aiming for deeper competitive analysis increasingly Extract Valuable Information from Google Maps Using Web Scraping to convert unstructured listings into structured datasets. This includes business names, categories, ratings, reviews, and operational details.
Between 2020 and 2026, enterprises using structured extraction methods improved market intelligence accuracy and reduced manual research efforts. Automated data extraction enabled scalable competitor tracking and real-time updates, supporting agile decision-making across multiple regions.
Data Extraction Efficiency Trends (2020–2026)
| Year | Automation Adoption (%) | Cost Reduction (%) |
|---|---|---|
| 2020 | 41 | 27 |
| 2021 | 47 | 31 |
| 2022 | 55 | 36 |
| 2023 | 63 | 41 |
| 2024 | 70 | 46 |
| 2025 | 77 | 51 |
| 2026 | 84 | 57 |
Structured data extraction transforms raw listings into intelligence-ready datasets that drive measurable business value.
Powering Smarter Strategic Decisions
Enterprises increasingly rely on Location Intelligence Using Google Maps Data Scraping to support predictive modeling, demand forecasting, and long-term planning. Location intelligence integrates geospatial data with business metrics to reveal patterns and trends.
From 2020 to 2026, organizations using location intelligence reported improved forecasting accuracy and stronger alignment between operations and market demand. This approach enabled proactive responses to competitive shifts and changing consumer behaviors.
Location Intelligence Impact (2020–2026)
| Year | Forecast Accuracy (%) | Strategic ROI (%) |
|---|---|---|
| 2020 | 54 | 48 |
| 2021 | 59 | 52 |
| 2022 | 64 | 57 |
| 2023 | 69 | 62 |
| 2024 | 74 | 67 |
| 2025 | 79 | 72 |
| 2026 | 85 | 78 |
Location intelligence empowers organizations to transition from reactive strategies to data-driven, future-ready planning.
Why Choose Real Data API?
Real Data API delivers enterprise-grade data solutions through its robust Google Maps Scraper, enabling scalable and compliant access to location intelligence. Designed for performance and accuracy, the platform supports large-scale Google Maps location data scraping for competitive market mapping without compromising reliability or data quality.
With advanced automation, flexible output formats, and global coverage, Real Data API empowers businesses to extract, process, and analyze location data efficiently. Its infrastructure is built to support high-volume requests while maintaining data integrity and operational stability.
Conclusion
Competitive market intelligence is no longer optional—it is a strategic necessity. By leveraging advanced data extraction technologies such as Web Unlocker API, businesses can overcome access challenges and maintain uninterrupted data flows. Combined with Google Maps location data scraping for competitive market mapping, organizations gain the clarity needed to identify opportunities, mitigate risks, and outperform competitors.
Start transforming location data into actionable insights today—partner with Real Data API and gain a decisive edge in competitive market mapping.
Latest posts
How to scrape GeM procurement analytics data for manufacturers to Unlock Smarter Government Contract Opportunities?
The future of Data-as-a-Service in 2026 - Trends, Innovations, and Business Opportunities
How To Use AI Agents For Automated Data Collection and Analysis to Improve Business Intelligence And Decision-Making
How to Scrape Dynamic pricing strategies powered by travel data for Smarter Travel Pricing and Revenue Optimization
Real Data API stands out as one of the premier global companies specializing in web data Scraping and web extraction.


Rating 4.7
Rating 4.7
Rating 4.5
Rating 4.7
Rating 4.7


Disclaimer : RealData API functions solely as an independent data infrastructure and technology solutions provider. We build customized automation workflows designed to collect publicly accessible web data based exclusively on client instructions. RealData API neither owns proprietary datasets nor engages in the sale or redistribution of extracted information. Our operations are limited strictly to lawful public web data processing and never involve unauthorized access to restricted systems or private networks. Any company names, trademarks, logos, or brand references displayed on this website are used purely for demonstrative and illustrative purposes to showcase our technical capabilities and do not imply endorsement, partnership, or affiliation. Use of our platform and services remains subject to our Terms of Service.