
Introduction
The U.S. housing market has undergone major structural changes since 2020, driven by remote work adoption, rising interest rates, and affordability challenges. As homeownership becomes more expensive, renters and investors alike are increasingly turning to data to understand shifting demand patterns. Listing platforms play a crucial role in revealing how consumer preferences evolve across cities, property types, and price ranges.
This blog explores how Redfin vs Apartments.com housing demand analysis uncovers meaningful differences between rental and home-buying behavior. Redfin offers deep visibility into residential sales trends, while Apartments.com captures real-time rental demand signals. When analyzed together, these datasets provide a comprehensive view of housing demand across the U.S. Using structured listing data from 2020 to 2026, this blog demonstrates how Real Data API enables businesses, investors, and analysts to predict rental market shifts with accuracy and confidence.
Signals Behind Renting and Buying Preferences
One of the most valuable insights from real estate listings is the evolving balance between renting and homeownership. By applying Scrape rental vs home buying trends, analysts can track how affordability, mortgage rates, and migration patterns influence consumer decisions.
Between 2020 and 2022, historically low mortgage rates drove strong home-buying activity, reflected in increased Redfin listing views and faster sale times. However, from 2023 onward, rising interest rates pushed many potential buyers toward renting. Apartments.com data shows a steady increase in rental searches, particularly in urban and high-growth metro areas.
U.S. Housing Demand Trends (2020–2026)
| Year | Home Purchase Demand Index | Rental Demand Index |
|---|---|---|
| 2020 | 100 | 92 |
| 2021 | 118 | 95 |
| 2022 | 110 | 102 |
| 2023 | 96 | 115 |
| 2024 | 90 | 120 |
| 2025 | 88 | 126 |
| 2026 | 92 | 130 |
These shifts highlight how rental demand has overtaken home-buying interest in many regions, making dual-platform analysis essential for accurate forecasting.
Rental Market Intelligence from Listings
Rental listings provide near-real-time signals of demand, pricing pressure, and market saturation. With Web Scraping Apartments.com rental data, businesses can monitor vacancy rates, rent fluctuations, and renter behavior at scale.
From 2020 to 2026, Apartments.com data reveals consistent growth in rental demand across suburban and secondary markets. Studio and one-bedroom units showed the highest demand growth post-2022, driven by affordability constraints and workforce mobility. Additionally, average time-on-market for rentals decreased significantly in high-demand metros.
Average Rental Listing Metrics (2020–2026)
| Year | Avg Monthly Rent ($) | Avg Days on Market |
|---|---|---|
| 2020 | 1,480 | 34 |
| 2021 | 1,520 | 32 |
| 2022 | 1,650 | 29 |
| 2023 | 1,780 | 25 |
| 2024 | 1,890 | 23 |
| 2025 | 1,980 | 22 |
| 2026 | 2,050 | 21 |
These trends indicate rising competition among renters and sustained demand pressure—key signals for investors and property managers.
Home Sales Demand and Buyer Behavior
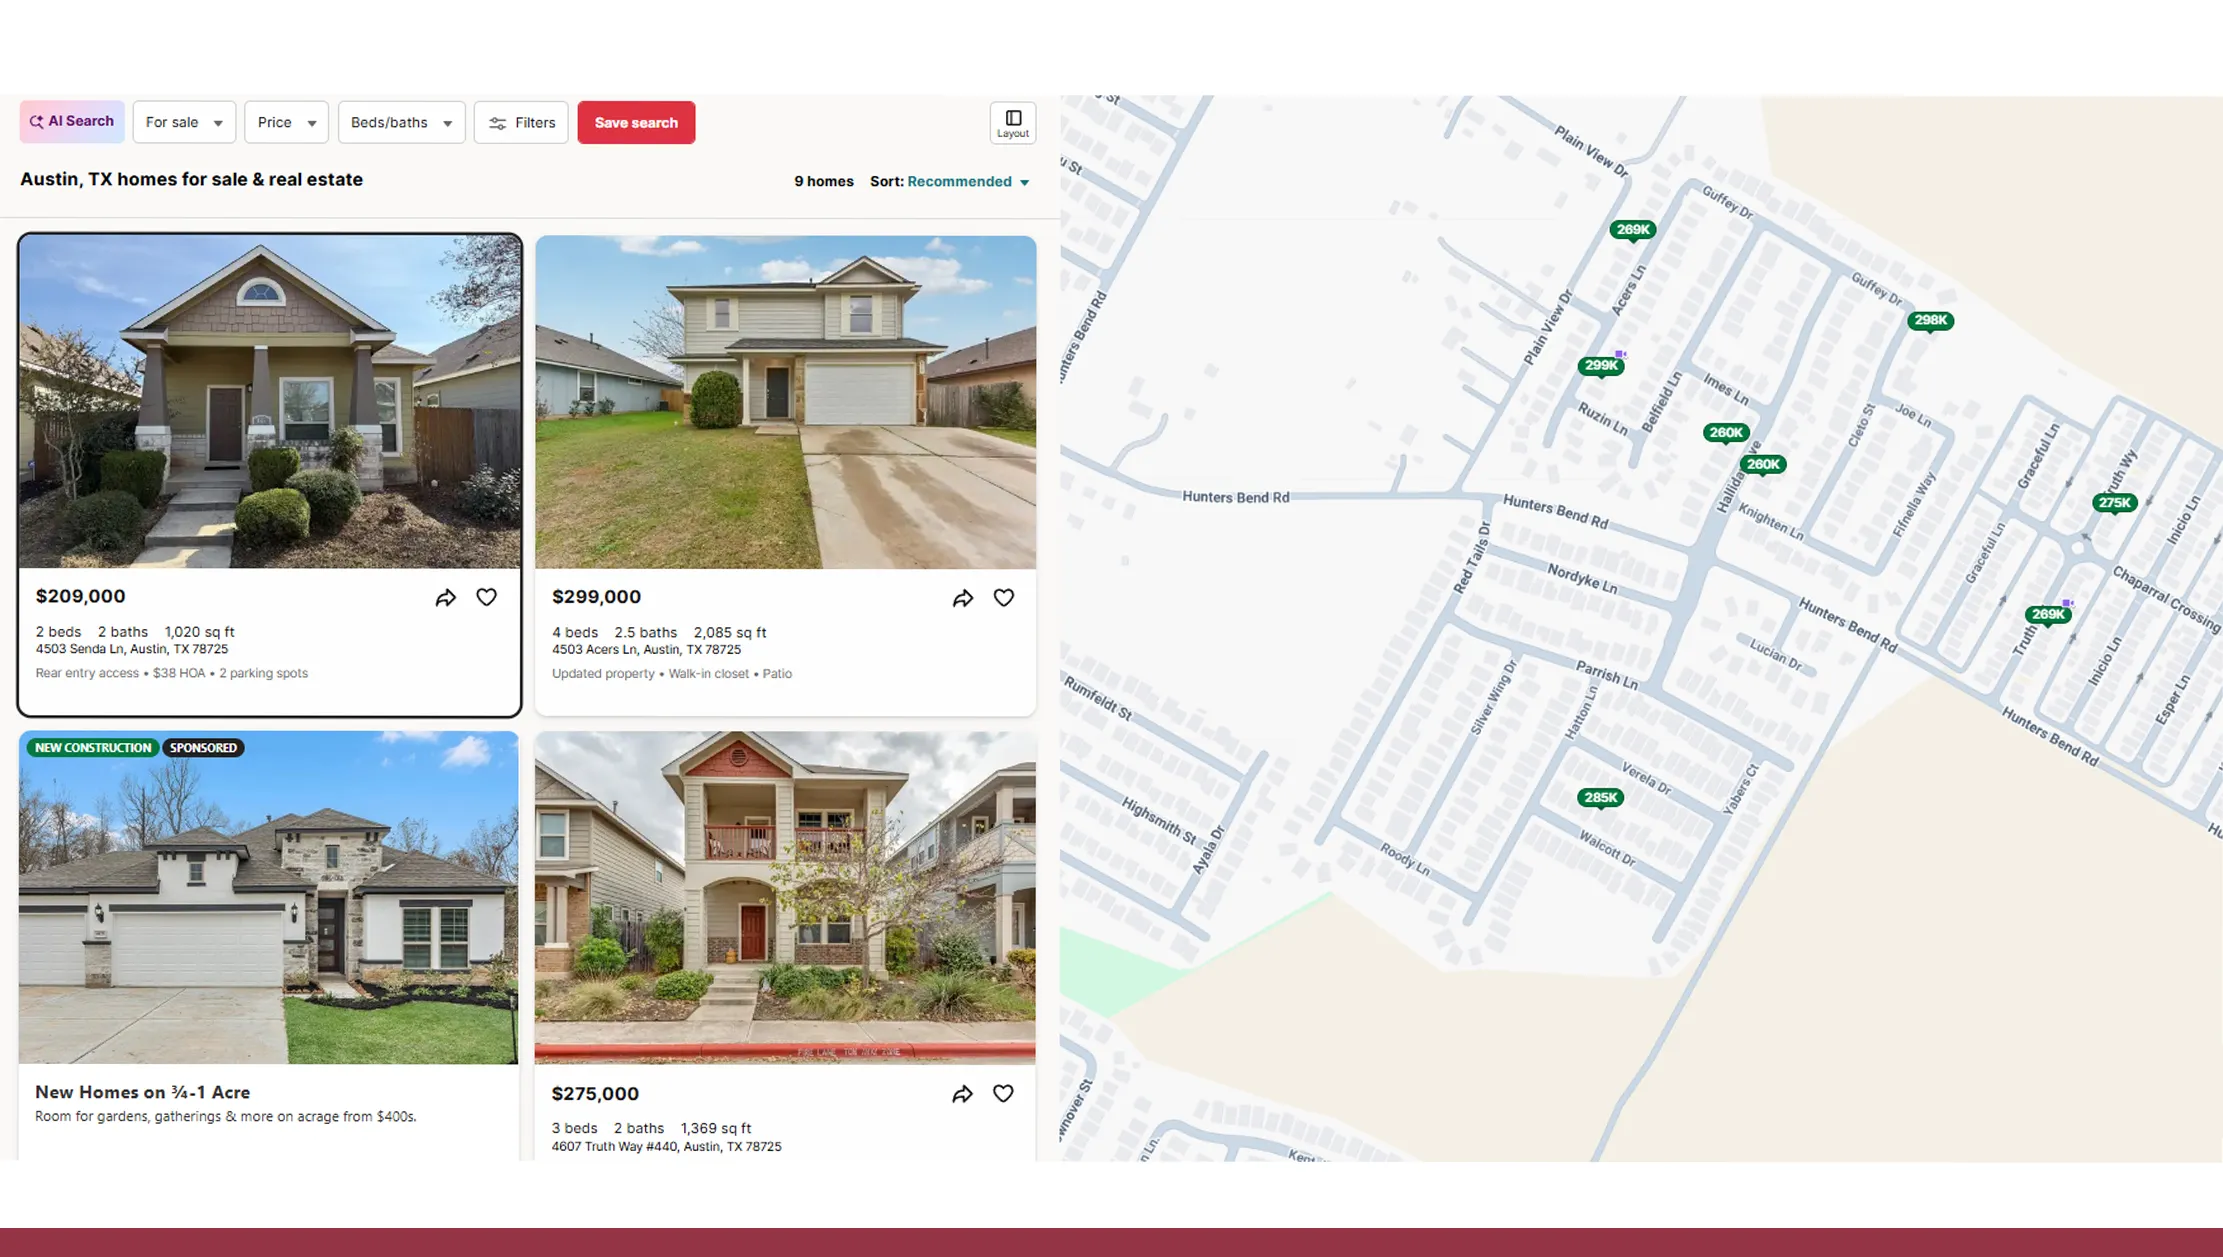
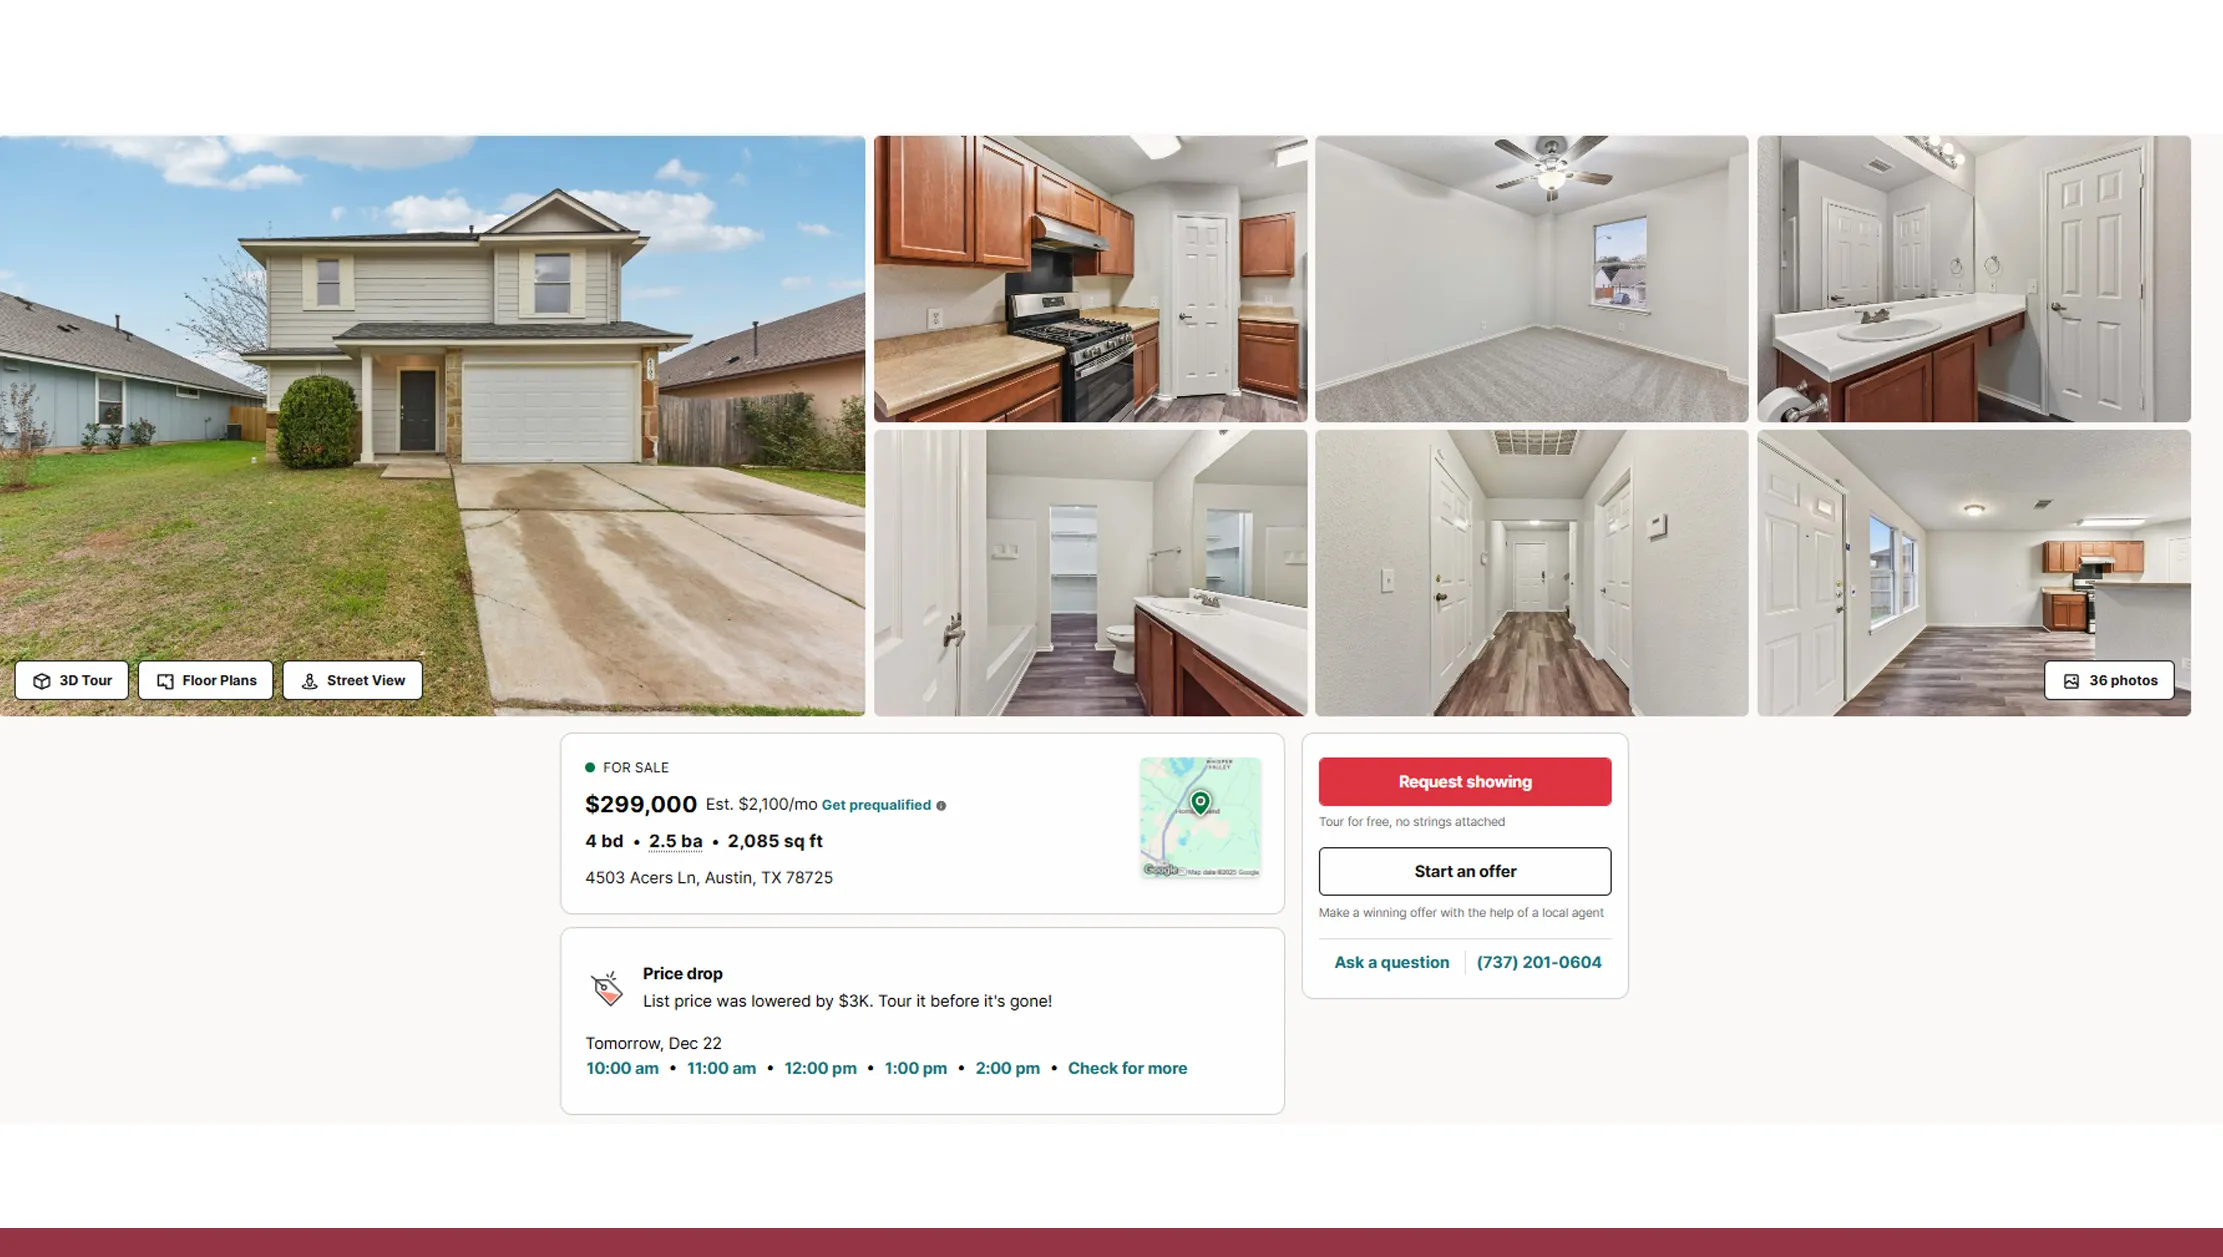
On the home-buying side, Redfin housing market data extraction enables detailed analysis of buyer intent, pricing sensitivity, and market cooling patterns. Redfin listing data captures metrics such as median home prices, listing views, and sale velocity.
From 2020 to 2021, demand surged due to low interest rates and limited inventory. However, from 2022 onward, buyer demand softened as affordability declined. Listings stayed active longer, and price growth slowed in many markets.
Home Sales Indicators (2020–2026)
| Year | Median Home Price ($) | Avg Days on Market |
|---|---|---|
| 2020 | 320,000 | 29 |
| 2021 | 355,000 | 24 |
| 2022 | 380,000 | 27 |
| 2023 | 395,000 | 34 |
| 2024 | 405,000 | 38 |
| 2025 | 415,000 | 40 |
| 2026 | 430,000 | 37 |
These indicators show why combining Redfin and Apartments.com data delivers a clearer picture of housing demand transitions.
Turning Listings into Market Intelligence
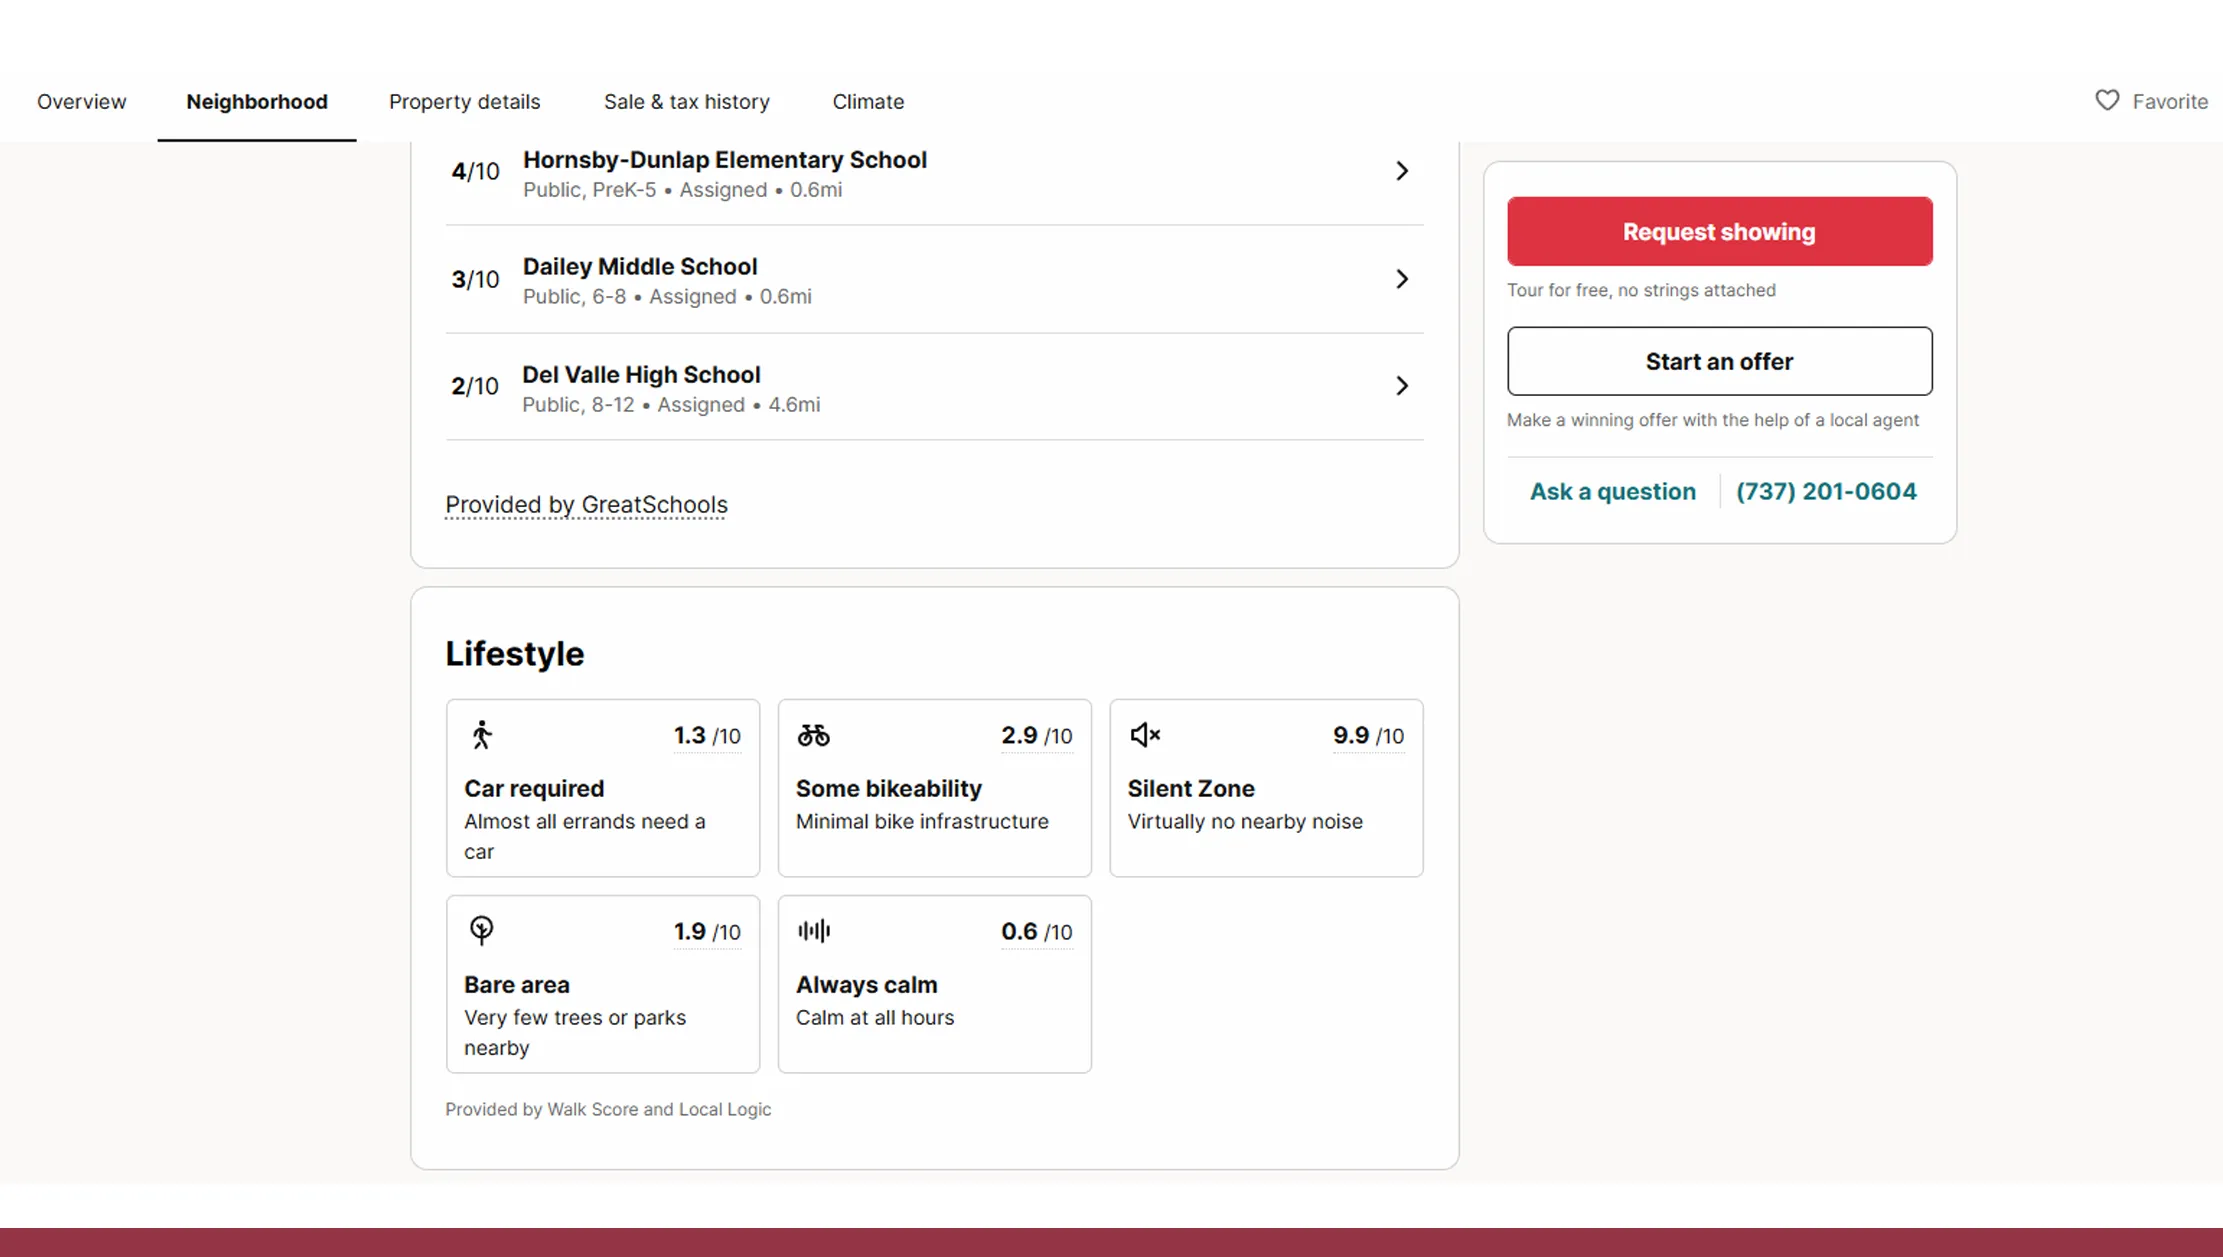
Raw listing data becomes exponentially more valuable when transformed into actionable insights. Through residential real estate analytics, analysts can uncover relationships between pricing, location, property type, and consumer demand.
By correlating rental demand spikes with declining home-buying interest, Real Data API enables predictive modeling of housing shifts. For example, cities experiencing rapid rent growth often show reduced home purchase activity within six to twelve months. These insights support smarter investment decisions, site selection, and pricing strategies.
Demand Shift Correlation (Sample Cities)
| City | Rental Demand Growth | Home Buyer Demand Change |
|---|---|---|
| Austin | +18% | -9% |
| Phoenix | +15% | -7% |
| Atlanta | +20% | -11% |
| Tampa | +17% | -8% |
Such analytics empower stakeholders to anticipate rather than react to market movements.
Scalable Access to Housing Market Data

To support enterprise-scale analysis, Real Data API offers structured access via the Redfin Data Scraping API, allowing users to collect large volumes of standardized housing data efficiently.
The API delivers clean, normalized datasets covering listing prices, availability, property attributes, and historical trends. Automated extraction ensures accuracy, compliance, and scalability across thousands of locations. Businesses can integrate this data directly into dashboards, forecasting models, or internal analytics systems without manual intervention.
From institutional investors to proptech startups, API-driven access enables faster insights, reduced operational costs, and real-time decision-making across dynamic housing markets.
Rental Listings as Predictive Assets
Rental datasets are increasingly used as leading indicators of housing demand. With access to the Apartments.com Real Estate Dataset, analysts can track early signs of market shifts before they appear in home sales data.
Rental listing volume, rent change velocity, and vacancy rates often react months ahead of broader housing indicators. This makes Apartments.com data particularly valuable for anticipating economic shifts, migration trends, and affordability pressures.
Predictive Rental Indicators (2020–2026)
| Metric | 2020 | 2023 | 2026 |
|---|---|---|---|
| Avg Rent Growth | 2.1% | 5.8% | 4.9% |
| Vacancy Rate | 7.2% | 5.4% | 5.1% |
| Rental Search Volume | Index 100 | 123 | 135 |
These signals help businesses stay ahead of demand changes across regions.
Why Choose Real Data API?
Real Data API delivers enterprise-grade access to structured housing intelligence through reliable, scalable solutions. Our Real Estate Dataset offerings combine rental and home-buying data into unified formats, enabling deep market analysis. By supporting Redfin vs Apartments.com housing demand analysis, we help clients uncover demand shifts, pricing opportunities, and geographic trends with precision. Automated pipelines, high data accuracy, and flexible delivery formats make Real Data API a trusted partner for real estate analytics, investment research, and market forecasting.
Conclusion
Housing demand is no longer driven by intuition alone—it is shaped by real-time listing data across rental and home-buying platforms. By leveraging Web Scraping Real Estate Data API, businesses gain the ability to monitor market signals, predict shifts, and make informed decisions. Through Redfin vs Apartments.com housing demand analysis, Real Data API enables a unified view of the housing ecosystem, empowering smarter strategies across real estate, finance, and proptech.
Ready to unlock actionable housing insights? Contact Real Data API today to access real-time rental and home-buying intelligence at scale.
Latest posts

How To Scrape Digital Shelf Data For Retail Analytics For Better Competitor Tracking And Insights?

How To Scrape Competitor Data For Retail Expansion Planning To Identify High-Growth Market Opportunities?

How Businesses Can Improve Competitive Pricing Strategies When They Scrape Retail Pricing Data on Online and Offline Channels for Market Analysis?

Why Brands Use Hyperlocal Retail Intelligence With Location Data Scraping For Hyperlocal Market Insights?
Real Data API stands out as one of the premier global companies specializing in web data Scraping and web extraction.


Rating 4.7
Rating 4.7
Rating 4.5
Rating 4.7
Rating 4.7


Disclaimer : RealData API functions solely as an independent data infrastructure and technology solutions provider. We build customized automation workflows designed to collect publicly accessible web data based exclusively on client instructions. RealData API neither owns proprietary datasets nor engages in the sale or redistribution of extracted information. Our operations are limited strictly to lawful public web data processing and never involve unauthorized access to restricted systems or private networks. Any company names, trademarks, logos, or brand references displayed on this website are used purely for demonstrative and illustrative purposes to showcase our technical capabilities and do not imply endorsement, partnership, or affiliation. Use of our platform and services remains subject to our Terms of Service.