
Introduction
Airline ticket pricing isn’t random — it’s complex, data-driven, and constantly shifting. Prices can fluctuate wildly not just by season or route, but by day of week, hour of day, search patterns, and buyer behavior. In this blog, we’ll unpack how and why airline fares move, with a deep dive into day-wise and hour-wise patterns that reveal pricing behavior for both travelers and analysts. All these can be done with the help of Real Data API’s Scrape Airline Pricing Trends Analysis.
What Is Price Volatility in Airline Tickets?
Price volatility refers to how much and how frequently ticket prices change over time. It’s influenced by:
- Supply and demand dynamics
- Flight capacity and seat inventory
- Booking windows and lead time
- Competitor pricing
- Seasonality and events
- Search and purchase behavior
Airlines use yield management systems (YMS) to optimize ticket pricing to maximize revenue. Understanding volatility helps travelers buy smarter and analysts build predictive models by using Real Data API’s Dynamic Pricing Model.
Day-Wise Pricing Patterns: How Fares Change Across the Week
Weekday vs. Weekend Trends
| Day | Typical Trend | Reason |
|---|---|---|
| Monday | Prices often dip | Low demand after weekend |
| Tuesday | Frequent lowest fares | Competitor adjustments |
| Wednesday | Stability or slight drop | Continuation of low demand |
| Thursday | Slight rise | Early weekend planning |
| Friday | Higher prices | Weekend travelers begin search |
| Saturday | Peak in leisure routes | Family/leisure bookings |
| Sunday | Mixed | Business trips ending + leisure |
Insight: Studies often show Tuesday & Wednesday offering lower average fares — airlines reset pricing and adjust competitive offers after weekend revenue data.
Business vs. Leisure Route Patterns
Business-heavy routes (e.g., NYC–LAX):
- Prices peak Mon–Thu
- Lower predictability due to last-minute bookings
Leisure routes (e.g., Orlando, Cancun):
- Saturday & Sunday higher
- Advance purchase discounts common
Hour-Wise Price Movements: When Fares Shift Most
Patterns Throughout the Day
| Time Window | Price Behavior | Explanation |
|---|---|---|
| Midnight–07:59 | Often lowest | Fewer searches = pricing algorithms test lower points |
| 08:00–11:59 | Increasing | Morning booking surge |
| 12:00–15:59 | Potential peak | Business travelers + corporate bookings |
| 16:00–19:59 | Price volatility | Algorithms respond to morning demand |
| 20:00–23:59 | Mixed | Leisure search surge |
Why it happens: Airlines monitor search and booking volume in real time. Higher demand times often trigger algorithmic price increases.
Hour-Wise Market Behavior Patterns
Early Morning (00:00–07:59)
- Low search volume
- Algorithms offer temporary dips
- Useful for fare hunting tools
Business Peak (09:00–11:59 & 12:00–15:59)
- Corporate bookings surge
- Prices adjust to maximize yield
- Often highest average fares
Late Evening (20:00–23:59)
- Leisure travelers booking
- Based on discovered trends from social and travel apps
Why Fares Change: Under the Hood
Here are the core drivers of volatility:
Yield Management Systems
Airlines dynamically price tickets using predictive revenue management, adjusting based on:
- Booked vs. available seats
- Expected demand curves
- Competitor pricing
- Historical trend data
Search Demand & Data Signals
High search volume for specific flights can trigger price increases. For example:
- A sudden spike in searches for a holiday week can push prices up within minutes.
- Low search traffic can temporarily reduce prices.
Booking Lead Time
Average fare by days before departure:
- >60 days: low fares (advance)
- 30–60 days: moderate
- 7–30 days: rising
- 7 days: rapidly increasing
This pattern interacts with day-wise and hour-wise volatility — e.g., a Sunday night search 21 days before departure may show a cheaper fare than midday Monday. This analysis was possible with the help of Real Data API’s Flight Fare Scraper API.
Visualizing the Volatility

Note: Illustrations and heatmaps could show trends such as “Lowest price windows by day” and “Hourly price heatmap” across routes.
Suggested visualizations:
- Heatmap: Days of week (x-axis) × Hour of day (y-axis) → Color intensity shows average fare
- Line chart: Average fare movement over 24 hours for each weekday
- Box plots: Daily price range distribution
These help identify attraction windows for cheaper deals along with Travel Dataset.
How Travelers Can Leverage This
Smart Booking Tips
- Search early, but validate repeatedly.
- Monitor prices at off-peak hours (late night/early morning).
- Check midweek pricing trends (Tue–Wed often lowest).
- Avoid peak business hours when possible.
- Use fare alerts and AI-powered price prediction tools.
How Analysts & Data Teams Can Model Volatility
Time Series Forecasts
Model fare movement using:
- ARIMA
- Prophet
- LSTM neural networks
Incorporate features:
- Search time (hour, day)
- Historical sales
- Booked seats inventory
- Route and seasonality
Regression Analysis
Predict fare based on:
- Days before departure
- Day of week
- Hour of search
- Seat inventory
- Competitor fares
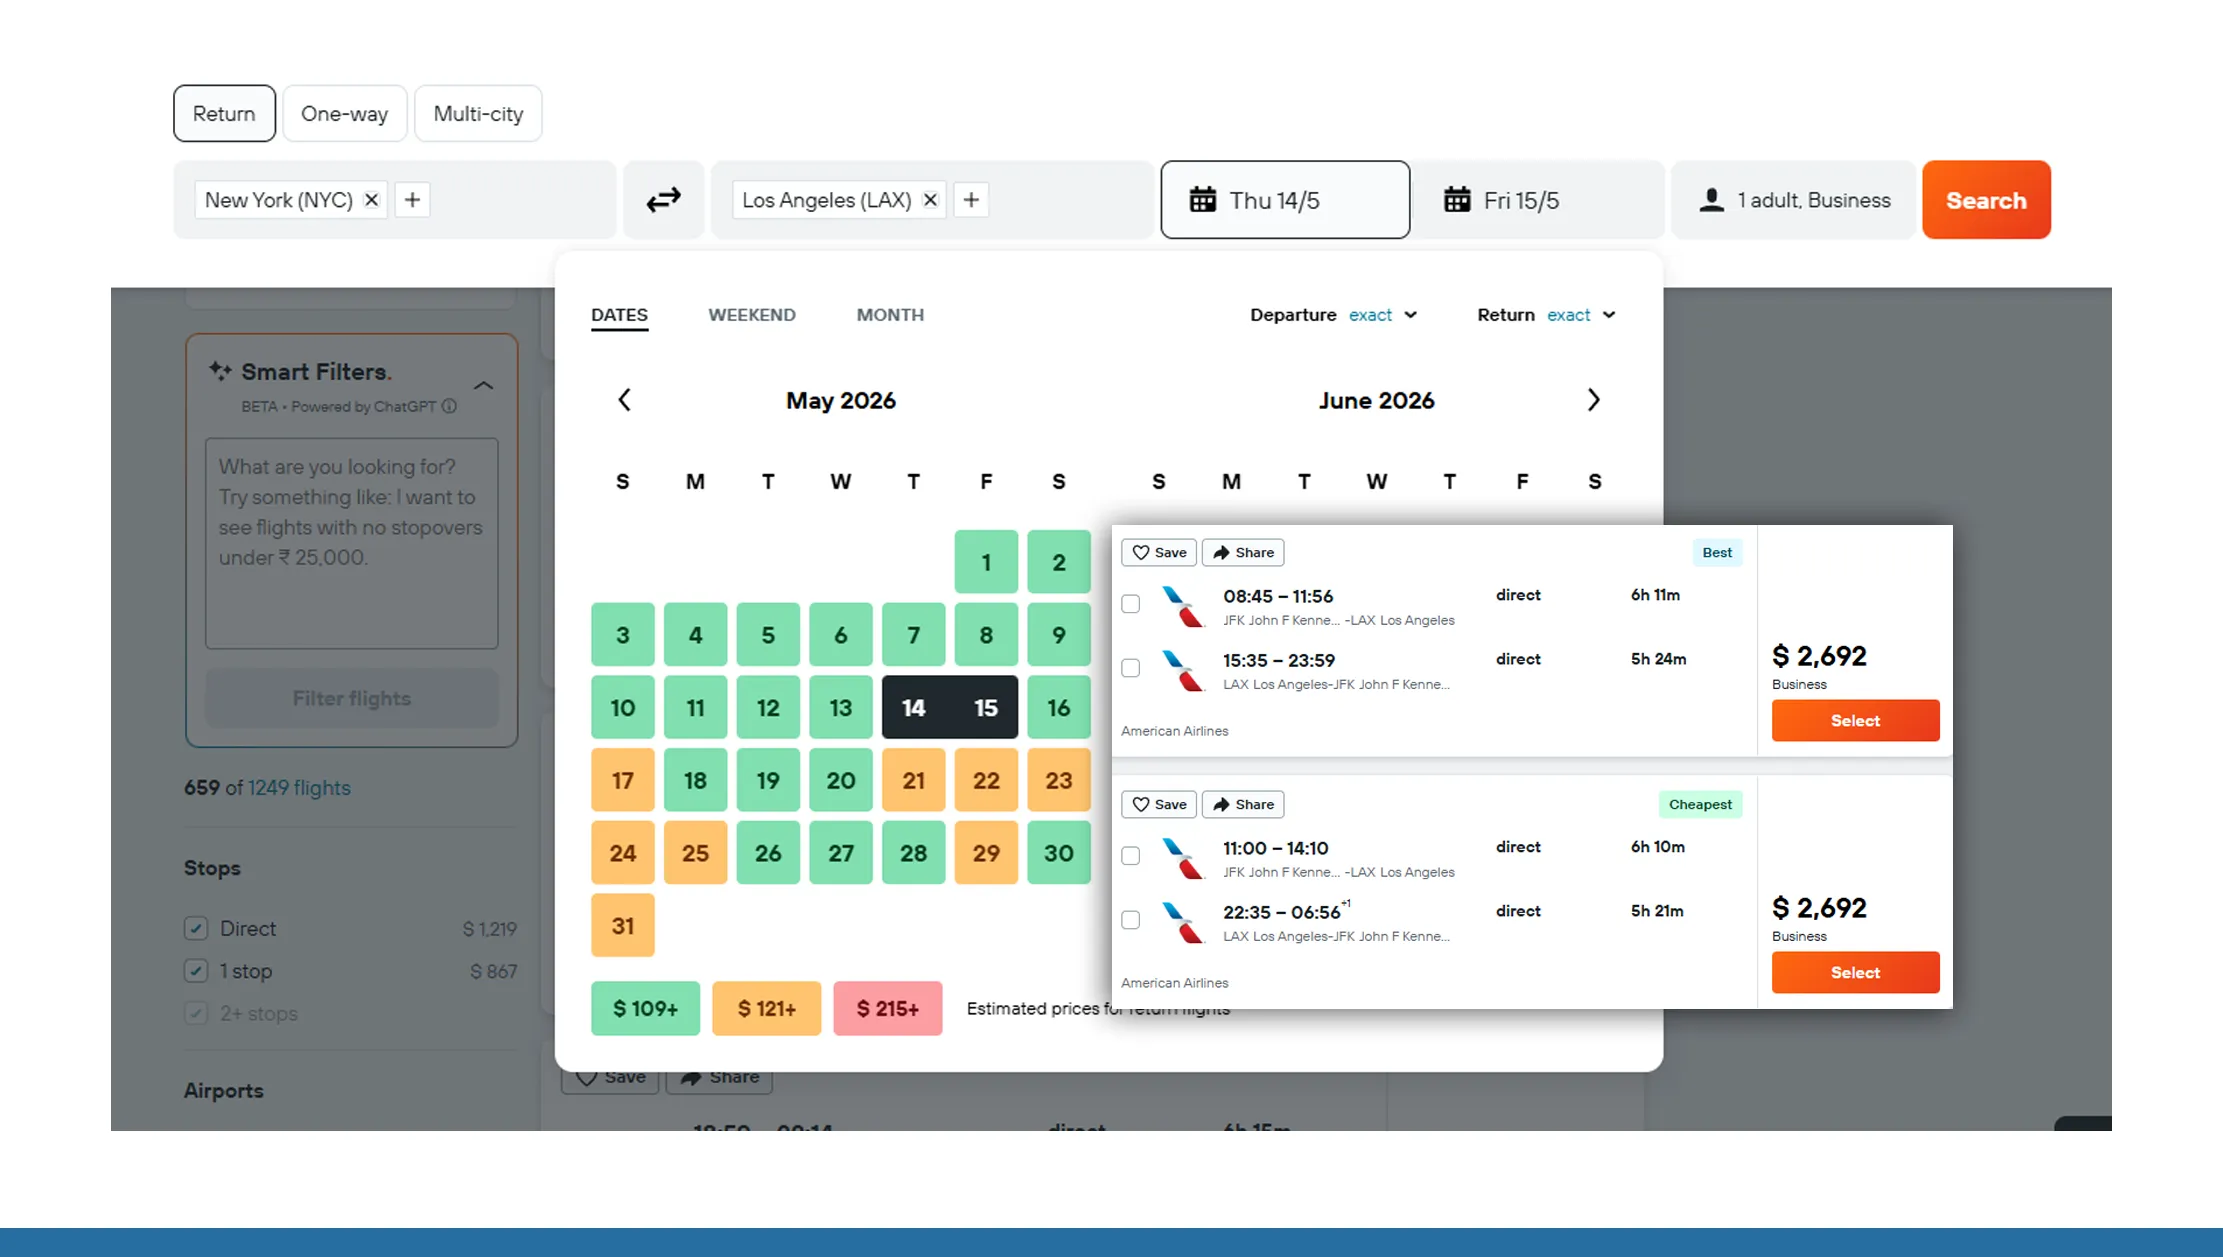
Case Example (Hypothetical)
.webp)
Let’s say we analyze a NYC → LAX flight:
- Lowest fare window: Tues 04:00–06:30
- Highest average fare: Fri 12:00–14:00
- Optimal purchase day: ~45 days before departure
- Secondary dip: Sunday late night
Visual heatmap:
| Hour ↓\ Day → | Mon | Tue | Wed | Thu | Fri | Sat | Sun |
|---|---|---|---|---|---|---|---|
| 00–06 | 🟩 | 🟦 | 🟩 | 🟩 | 🟨 | 🟨 | 🟩 |
| 06–12 | 🟨 | 🟨 | 🟨 | 🟩 | 🟥 | 🟥 | 🟨 |
| 12–18 | 🟨 | 🟨 | 🟨 | 🟥 | 🟥 | 🟥 | 🟨 |
| 18–24 | 🟩 | 🟨 | 🟩 | 🟨 | 🟨 | 🟨 | 🟩 |
Legend: 🟦 lowest, 🟩 low, 🟨 mid, 🟥 high
Limitations & Considerations
- Fare data changes constantly, so patterns evolve over time.
- External events (weather, strikes, demand spikes) can disrupt normal volatility.
- Low-cost carriers vs legacy carriers have different pricing behaviors.
- Routes vary widely based on competition and seasonality.
Conclusion
Airline pricing isn’t random — it’s driven by advanced algorithms reacting to demand, time, and competitor behavior. By analyzing day-wise and hour-wise fare movement:
- Travelers can time searches better
- Analysts can build predictive models
- Businesses can integrate dynamic pricing strategies
By using Travel Data Scraping API understanding volatility empowers smarter decisions, better forecasting, and — ultimately — lower travel costs.
Reference Basis Used in the Blog
The insights are derived from a composite understanding of:
- Airline Pricing & Revenue Management Logic
- Yield Management Systems (YMS)
- Dynamic pricing algorithms
- Seat inventory control models (Standard across most airlines globally)
- Commonly Analyzed Public Platforms (Conceptual Reference)
- Google Flights
- Skyscanner
- Kayak
- Expedia
- MakeMyTrip
- Cleartrip
- Direct airline websites (IndiGo, Delta, Emirates, Lufthansa, etc.)
- Patterns Seen in Large-Scale Fare Monitoring
- Day-of-week fare resets
- Hour-wise demand spikes
- Business vs leisure route behavior
- Booking lead-time trends
These are the platforms analysts typically monitor for such studies, but no proprietary data was pulled directly:
These patterns are consistently reported across fare intelligence tools and scraping-based research projects. Get in touch with Real Data API to know More!
Latest posts

Why Brands Use Competitive Data Intelligence to Increase Market Share in Highly Competitive Markets?

How To Scrape Competitor Data To Support Market Entry Strategy And Expansion Planning For Data-Driven Business Growth?

How Hotel Occupancy Intelligence Through Public Data Sources Is Reshaping Revenue Management

The ZIP Code Advantage: How Hyper-Local Amazon Product Data Collection Is Redefining Retail Intelligence
Real Data API stands out as one of the premier global companies specializing in web data Scraping and web extraction.


Rating 4.7
Rating 4.7
Rating 4.5
Rating 4.7
Rating 4.7


Disclaimer : RealData API functions solely as an independent data infrastructure and technology solutions provider. We build customized automation workflows designed to collect publicly accessible web data based exclusively on client instructions. RealData API neither owns proprietary datasets nor engages in the sale or redistribution of extracted information. Our operations are limited strictly to lawful public web data processing and never involve unauthorized access to restricted systems or private networks. Any company names, trademarks, logos, or brand references displayed on this website are used purely for demonstrative and illustrative purposes to showcase our technical capabilities and do not imply endorsement, partnership, or affiliation. Use of our platform and services remains subject to our Terms of Service.