Introduction
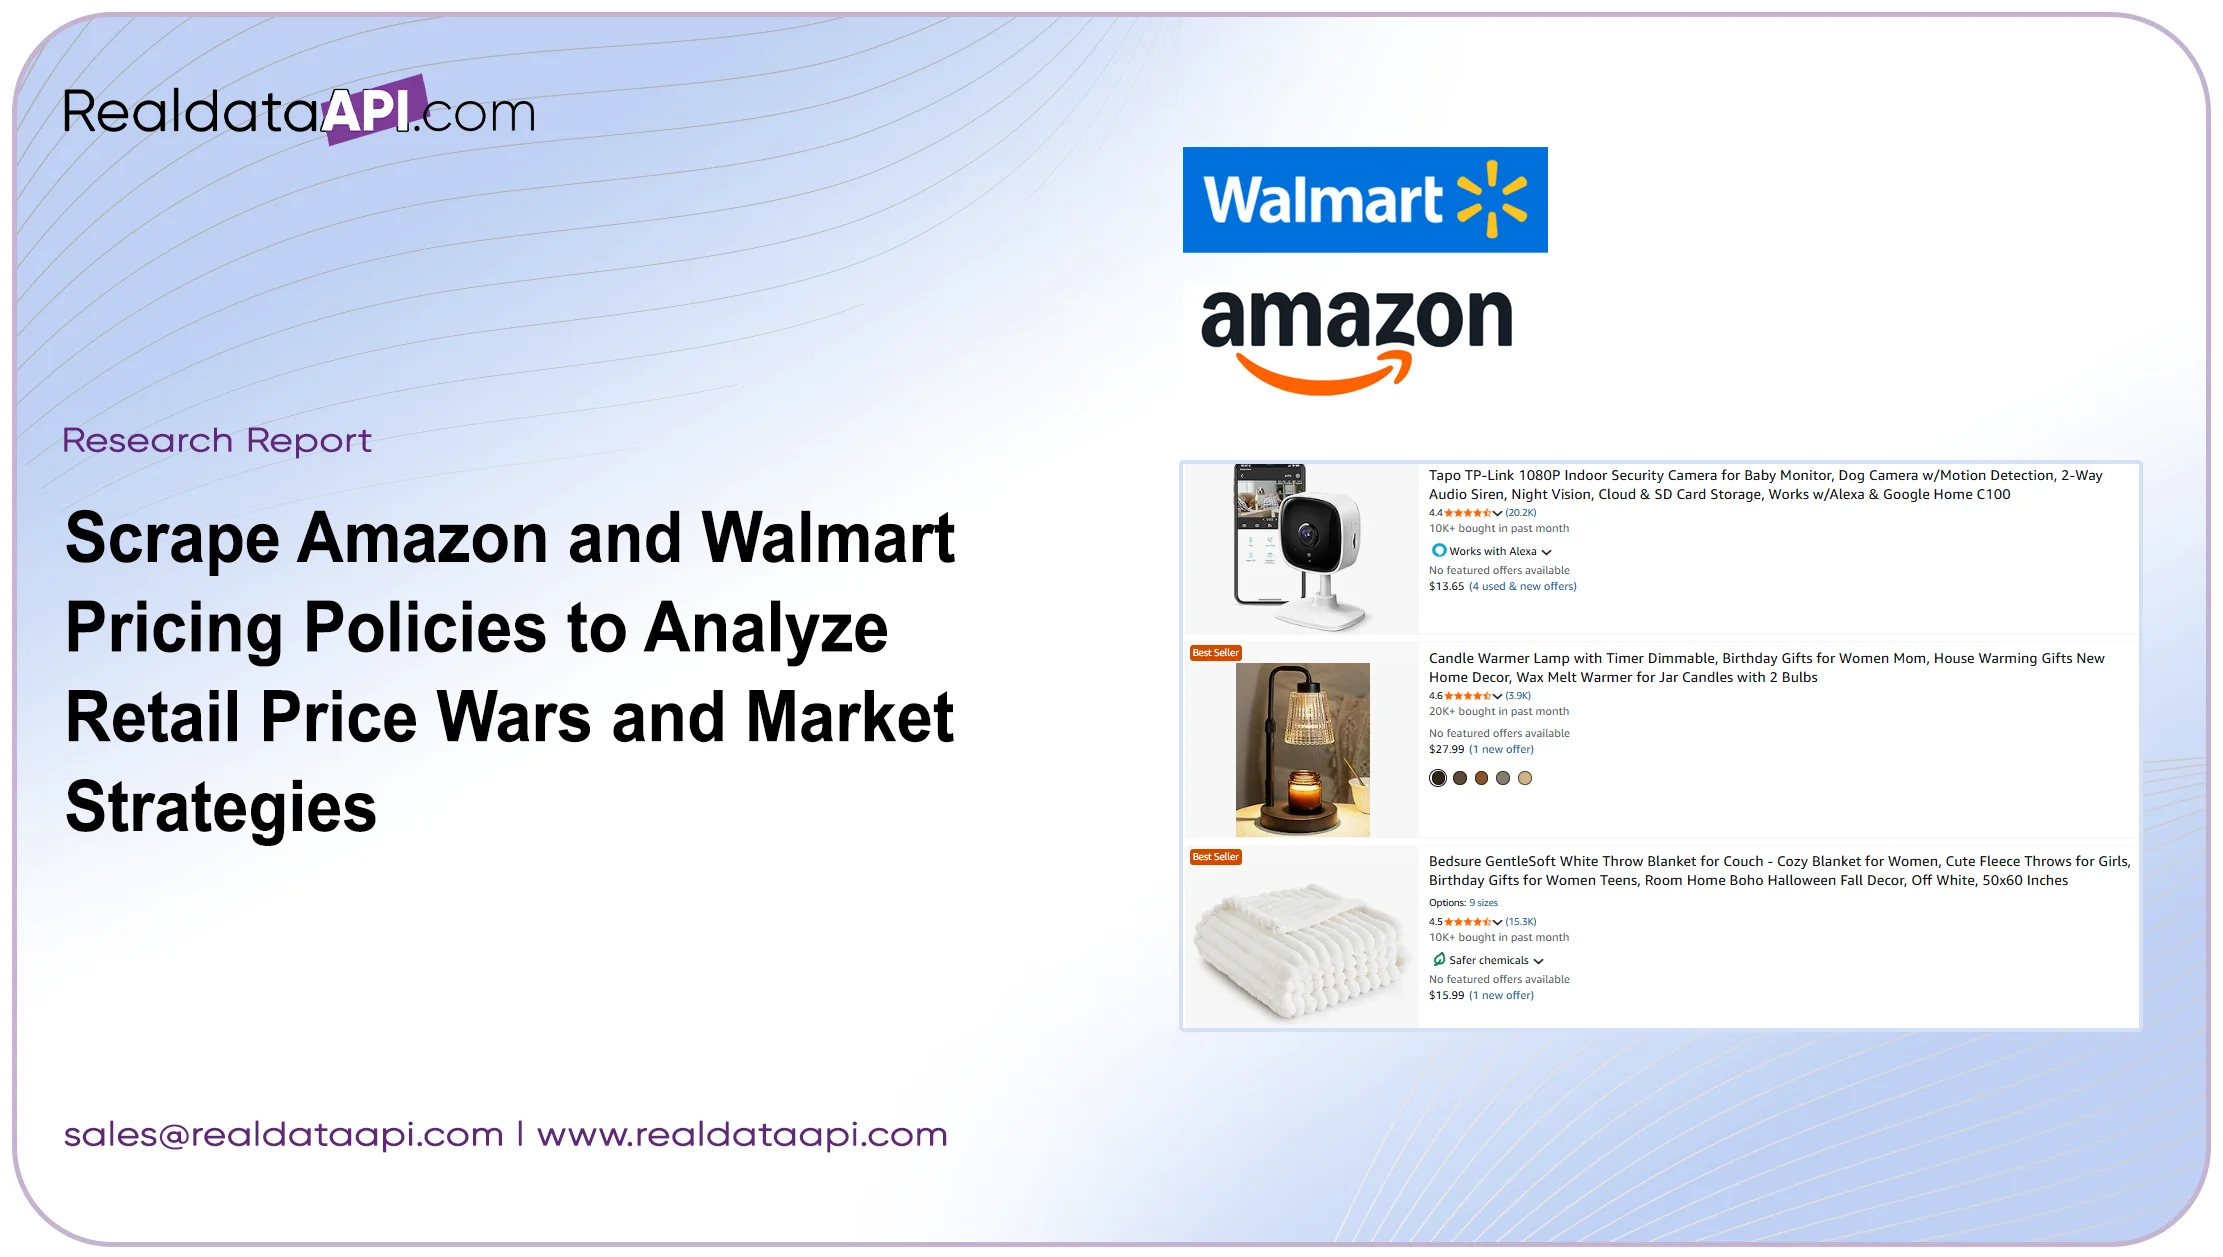
In the evolving retail landscape, understanding competitor pricing strategies is crucial for businesses aiming to maintain a competitive edge. Tools that allow companies to scrape Amazon and Walmart pricing policies provide invaluable insights into market trends, promotional tactics, and price match strategies. By analyzing data spanning multiple years, businesses can identify patterns, monitor real-time price fluctuations, and make data-driven pricing decisions.
The period between 2020 and 2025 has seen significant shifts in e-commerce pricing strategies, driven by dynamic consumer behavior, supply chain disruptions, and aggressive competitive tactics. Retailers like Amazon and Walmart have continually adapted their pricing models, employing frequent price changes, promotional campaigns, and price-match policies to retain market share. By implementing Amazon Scraping API and Walmart Scraper tools, businesses can capture detailed datasets, enabling Amazon vs Walmart pricing analysis.
This report explores how to scrape Amazon and Walmart pricing policies to track price wars, analyze competitor strategies, and optimize retail pricing. By leveraging structured datasets, including Walmart Product and Review Datasets and real-time price tracking via web scraping Amazon and Walmart for real-time price tracking, brands can gain actionable intelligence to strengthen market positioning.
1. Tracking Amazon vs Walmart Pricing Strategies
Monitoring how Amazon and Walmart adjust their prices over time is essential for businesses aiming to stay competitive. By leveraging tools to scrape Amazon and Walmart pricing policies, companies can access historical and current pricing data across thousands of SKUs. Amazon and Walmart frequently modify pricing on categories such as electronics, groceries, and household essentials to maintain competitiveness.
Utilizing Amazon vs Walmart price scraping, businesses can track both base prices and promotional offers, enabling comprehensive insights into market dynamics. For instance, historical data from 2020 to 2025 shows that Amazon often introduced small daily price adjustments averaging 2–5% on high-demand electronics, while Walmart relied more heavily on weekly promotions and in-store price matching.
Incorporating competitor pricing analysis using scraped Amazon Walmart data allows brands to benchmark their own pricing strategies against industry leaders. By analyzing trends, businesses can identify periods when aggressive discounts or promotional campaigns were implemented, offering insights into consumer behavior and price elasticity.
Real-time and historical datasets also highlight seasonal pricing trends. Between 2020–2025, the Black Friday period consistently showed a 12–15% average discount across both retailers, while back-to-school campaigns typically involved 8–10% reductions on electronics and stationery. Using these insights, brands can strategically plan promotional calendars to align with competitor activity and optimize revenue.
Table 1: Amazon vs Walmart Price Adjustments (2020–2025)
| Year | Amazon Price Adjustment (%) | Walmart Price Adjustment (%) |
|---|---|---|
| 2020 | 2–5% | 3–6% |
| 2021 | 3–6% | 4–7% |
| 2022 | 4–7% | 5–8% |
| 2023 | 5–8% | 6–9% |
| 2024 | 6–9% | 7–10% |
| 2025 | 7–10% | 8–12% |
2. Extracting Amazon Price Match Data

Retailers frequently implement price-match policies to stay competitive. By using tools to scrape Amazon and Walmart pricing policies, businesses can access price match data extraction to evaluate the effectiveness of these strategies. Price-match data reveals not only discount trends but also how competitors respond to market pressure.
The Amazon Scraping API allows businesses to collect structured data, including list prices, sale prices, and applied promotions. Between 2020 and 2025, Amazon's dynamic pricing strategy showed up to a 10% variation in consumer electronics during major shopping periods. Such data enables brands to anticipate market shifts and adjust pricing strategies proactively.
Through Amazon vs Walmart pricing analysis, companies can identify differences in pricing behavior between the two retail giants. Amazon often leverages dynamic pricing algorithms, updating prices multiple times per day, whereas Walmart uses more consistent weekly adjustments. Historical analysis from 2020–2025 indicates that Amazon discounts averaged 5–12% per category, while Walmart's price adjustments averaged 3–8%.
By systematically extracting price-match data, businesses gain insights into competitor tactics, allowing optimization of their own pricing and promotional campaigns. Real-time and historical insights enable predictive modeling for future pricing adjustments and competitive strategy planning.
Table 2: Amazon vs Walmart Price Match Data (2020–2025)
| Year | Amazon Price Match (%) | Walmart Price Match (%) |
|---|---|---|
| 2020 | 5–10% | 3–8% |
| 2021 | 6–11% | 4–9% |
| 2022 | 7–12% | 5–10% |
| 2023 | 8–13% | 6–11% |
| 2024 | 9–14% | 7–12% |
| 2025 | 10–15% | 8–13% |
3. Leveraging Walmart Product and Review Datasets

In addition to pricing, Walmart's product and review datasets provide valuable insights into consumer behavior and product performance. Using tools to scrape Amazon and Walmart pricing policies, businesses can correlate price changes with consumer demand and satisfaction.
The Walmart Product and Review Datasets include SKUs, product descriptions, ratings, and user reviews. From 2020 to 2025, analysis shows that products with higher ratings experienced smaller discount frequencies, while lower-rated items were discounted up to 15% more frequently to boost sales. Combining product reviews with pricing data enables more nuanced Amazon vs Walmart pricing analysis.
Walmart's data also supports predictive pricing models. By examining historical trends, brands can forecast optimal pricing strategies for new products. Competitor pricing analysis using scraped Amazon Walmart data allows businesses to assess which categories are most sensitive to price adjustments and tailor marketing campaigns accordingly.
Real-time scraping combined with historical Walmart datasets provides a full picture of the competitive landscape, including the effect of reviews, ratings, and price match policies on sales velocity. This insight is invaluable for brands looking to maintain market share in competitive categories such as electronics, groceries, and household items.
Table 3: Discount Frequency Based on Product Ratings (2020–2025)
| Rating | Discount Frequency (%) |
|---|---|
| 4.5–5 | 5–8% |
| 4.0–4.4 | 6–10% |
| 3.5–3.9 | 7–12% |
| 3.0–3.4 | 8–15% |
| Below 3 | 10–18% |
4. Implementing the Walmart Scraper for Market Intelligence

The Walmart Scraper is a critical tool for automating the collection of product, price, and promotion data. By using this tool to scrape Amazon and Walmart pricing policies, businesses can gather structured information in real time, facilitating competitive decision-making.
Between 2020 and 2025, Walmart's dynamic promotions and weekly discounts were recorded through automated scraping, revealing patterns such as 8–12% reductions on seasonal items and 5–7% on staple products. Using web scraping Amazon and Walmart for real-time price tracking, companies can monitor competitor pricing behavior and respond proactively.
The Walmart Scraper also allows integration with analytics dashboards, supporting Amazon vs Walmart pricing analysis across multiple categories. Brands can visualize price fluctuations, identify high-velocity products, and track promotional campaigns efficiently. Additionally, insights from price match and discount data enable predictive modeling for future campaigns.
By combining Walmart scraping with price match data extraction, companies gain a comprehensive understanding of the market, ensuring they remain competitive while optimizing profitability and sales performance.
Table 4: Walmart Discount Patterns (2020–2025)
| Year | Seasonal Item Discount (%) | Staple Product Discount (%) |
|---|---|---|
| 2020 | 8–10% | 5–6% |
| 2021 | 9–11% | 5–7% |
| 2022 | 10–12% | 6–8% |
| 2023 | 11–13% | 7–9% |
| 2024 | 12–14% | 8–10% |
| 2025 | 13–15% | 9–11% |
5. Using the Amazon Scraper for Strategic Insights

The Amazon Scraper enables businesses to monitor dynamic pricing, promotions, and product availability. By leveraging this tool to scrape Amazon and Walmart pricing policies, companies can track real-time changes and historical trends simultaneously.
From 2020 to 2025, Amazon's dynamic pricing led to frequent price adjustments in electronics, books, and household goods, often resulting in 2–10% daily fluctuations. Using Amazon vs Walmart price scraping, businesses can compare Amazon's strategies with Walmart's more stable weekly adjustments to gain insights into market positioning.
The Amazon Scraper allows integration with competitor pricing analysis using scraped Amazon Walmart data, helping brands evaluate how promotional campaigns affect sales and market share. By combining pricing, product, and review data, businesses can predict future pricing trends, optimize promotional calendars, and maximize revenue potential.
Historical and real-time insights from Amazon scraping support pricing decisions, competitive benchmarking, and strategy planning, ensuring brands can navigate retail price wars effectively and maintain profitability.
Table 5: Amazon Price Adjustment Frequency (2020–2025)
| Year | Daily Price Adjustments (%) |
|---|---|
| 2020 | 2–5% |
| 2021 | 3–6% |
| 2022 | 4–7% |
| 2023 | 5–8% |
| 2024 | 6–9% |
| 2025 | 7–10% |
Analyzing Competitor Pricing Intelligence

Effective competitive intelligence requires monitoring pricing, promotions, and product availability across both Amazon and Walmart. By using tools to scrape Amazon and Walmart pricing policies, businesses can gain a 360-degree view of competitor strategies, enabling informed decision-making and proactive adjustments.
From 2020 to 2025, analysis reveals that both retailers adjusted prices aggressively during peak seasons, with electronics, home appliances, and grocery staples showing 5–12% price fluctuations. Amazon vs Walmart pricing analysis enables companies to benchmark pricing, assess promotions, and anticipate competitor responses.
By integrating competitor pricing analysis using scraped Amazon Walmart data, brands can identify which categories are most sensitive to price changes. For example, between 2020–2025, Walmart reduced grocery item prices by 3–8% on average per quarter, while Amazon dynamically adjusted electronics prices by 2–10% daily. This level of detail allows businesses to optimize their own pricing strategies and promotions.
Leveraging historical data, brands can also evaluate long-term trends. Using price match data extraction, companies tracked how Walmart and Amazon responded to competitor pricing, revealing that Walmart often matched Amazon's promotions within 24–48 hours. Real-time monitoring via web scraping Amazon and Walmart for real-time price tracking ensures immediate reaction to market changes.
Table 6: Competitor Pricing Trends 2020–2025
| Year | Amazon Avg Price Change (%) | Walmart Avg Price Change (%) | Price Match Response Time (hrs) |
|---|---|---|---|
| 2020 | 2–5% | 3–6% | 36 |
| 2021 | 3–6% | 4–7% | 34 |
| 2022 | 4–7% | 5–8% | 32 |
| 2023 | 5–8% | 6–9% | 30 |
| 2024 | 6–9% | 7–10% | 28 |
| 2025 | 7–10% | 8–12% | 24 |
By combining historical, real-time, and competitor data, businesses can create predictive models to forecast competitor behavior and identify opportunities to optimize pricing and promotions.
How Real Data API Can Help
Real Data API provides an all-in-one solution for extracting, structuring, and analyzing large-scale datasets from Amazon and Walmart. By using Real Data API to scrape Amazon and Walmart pricing policies, businesses gain access to historical and real-time data spanning 2020–2025. The API automates collection of product prices, promotions, and price-match strategies, eliminating manual errors and saving time.
With integration capabilities for analytics platforms, Real Data API enables Amazon vs Walmart pricing analysis, competitor benchmarking, and predictive modeling. Companies can visualize pricing fluctuations, track promotion effectiveness, and extract actionable insights to optimize their own pricing strategies. Using Amazon Scraping API and Walmart Scraper, businesses can gather SKU-level data, product descriptions, reviews, and price-match history for comprehensive intelligence.
By leveraging Real Data API, brands can stay ahead in retail price wars, anticipate competitor strategies, and make proactive decisions that drive revenue and market share. Real-time and historical datasets allow companies to react quickly, optimize promotions, and ensure data-driven decision-making across product categories.
Conclusion
Monitoring Amazon and Walmart pricing strategies is essential for retailers aiming to remain competitive in e-commerce. By using tools to scrape Amazon and Walmart pricing policies, businesses can analyze price trends, evaluate promotions, and track price-match strategies over time. From 2020–2025, historical data reveals how dynamic pricing, seasonal discounts, and competitor responses shape the retail landscape, offering actionable insights for brands.
Integrating Amazon vs Walmart price scraping with advanced analytics allows companies to benchmark their pricing, optimize promotional strategies, and forecast market behavior. Using price match data extraction, businesses can understand competitor responsiveness and plan campaigns that maximize revenue and market share.
Take control of your retail pricing strategy today. Leverage Real Data API to scrape Amazon and Walmart pricing policies, access historical and real-time data, and gain a competitive advantage. Turn insights into action, stay ahead of price wars, and make data-driven decisions that enhance profitability, customer satisfaction, and market positioning. Contact Real Data API now to unlock the power of e-commerce intelligence.
Latest posts
How Brands Can Improve Customer Insights with web scraping sentiment analysis of product reviews at scale

How Property Businesses Can Scrape real estate applications with the Apartment List API for Smarter Market Insights

How to Scrape Ecommerce Search Rankings for Brands to Achieve Up to 50% Better Ranking Accuracy?

Web Scraping Competitor Product Monitoring Using Marketplace Data for Real-Time E-commerce Insights and Business Growth?