
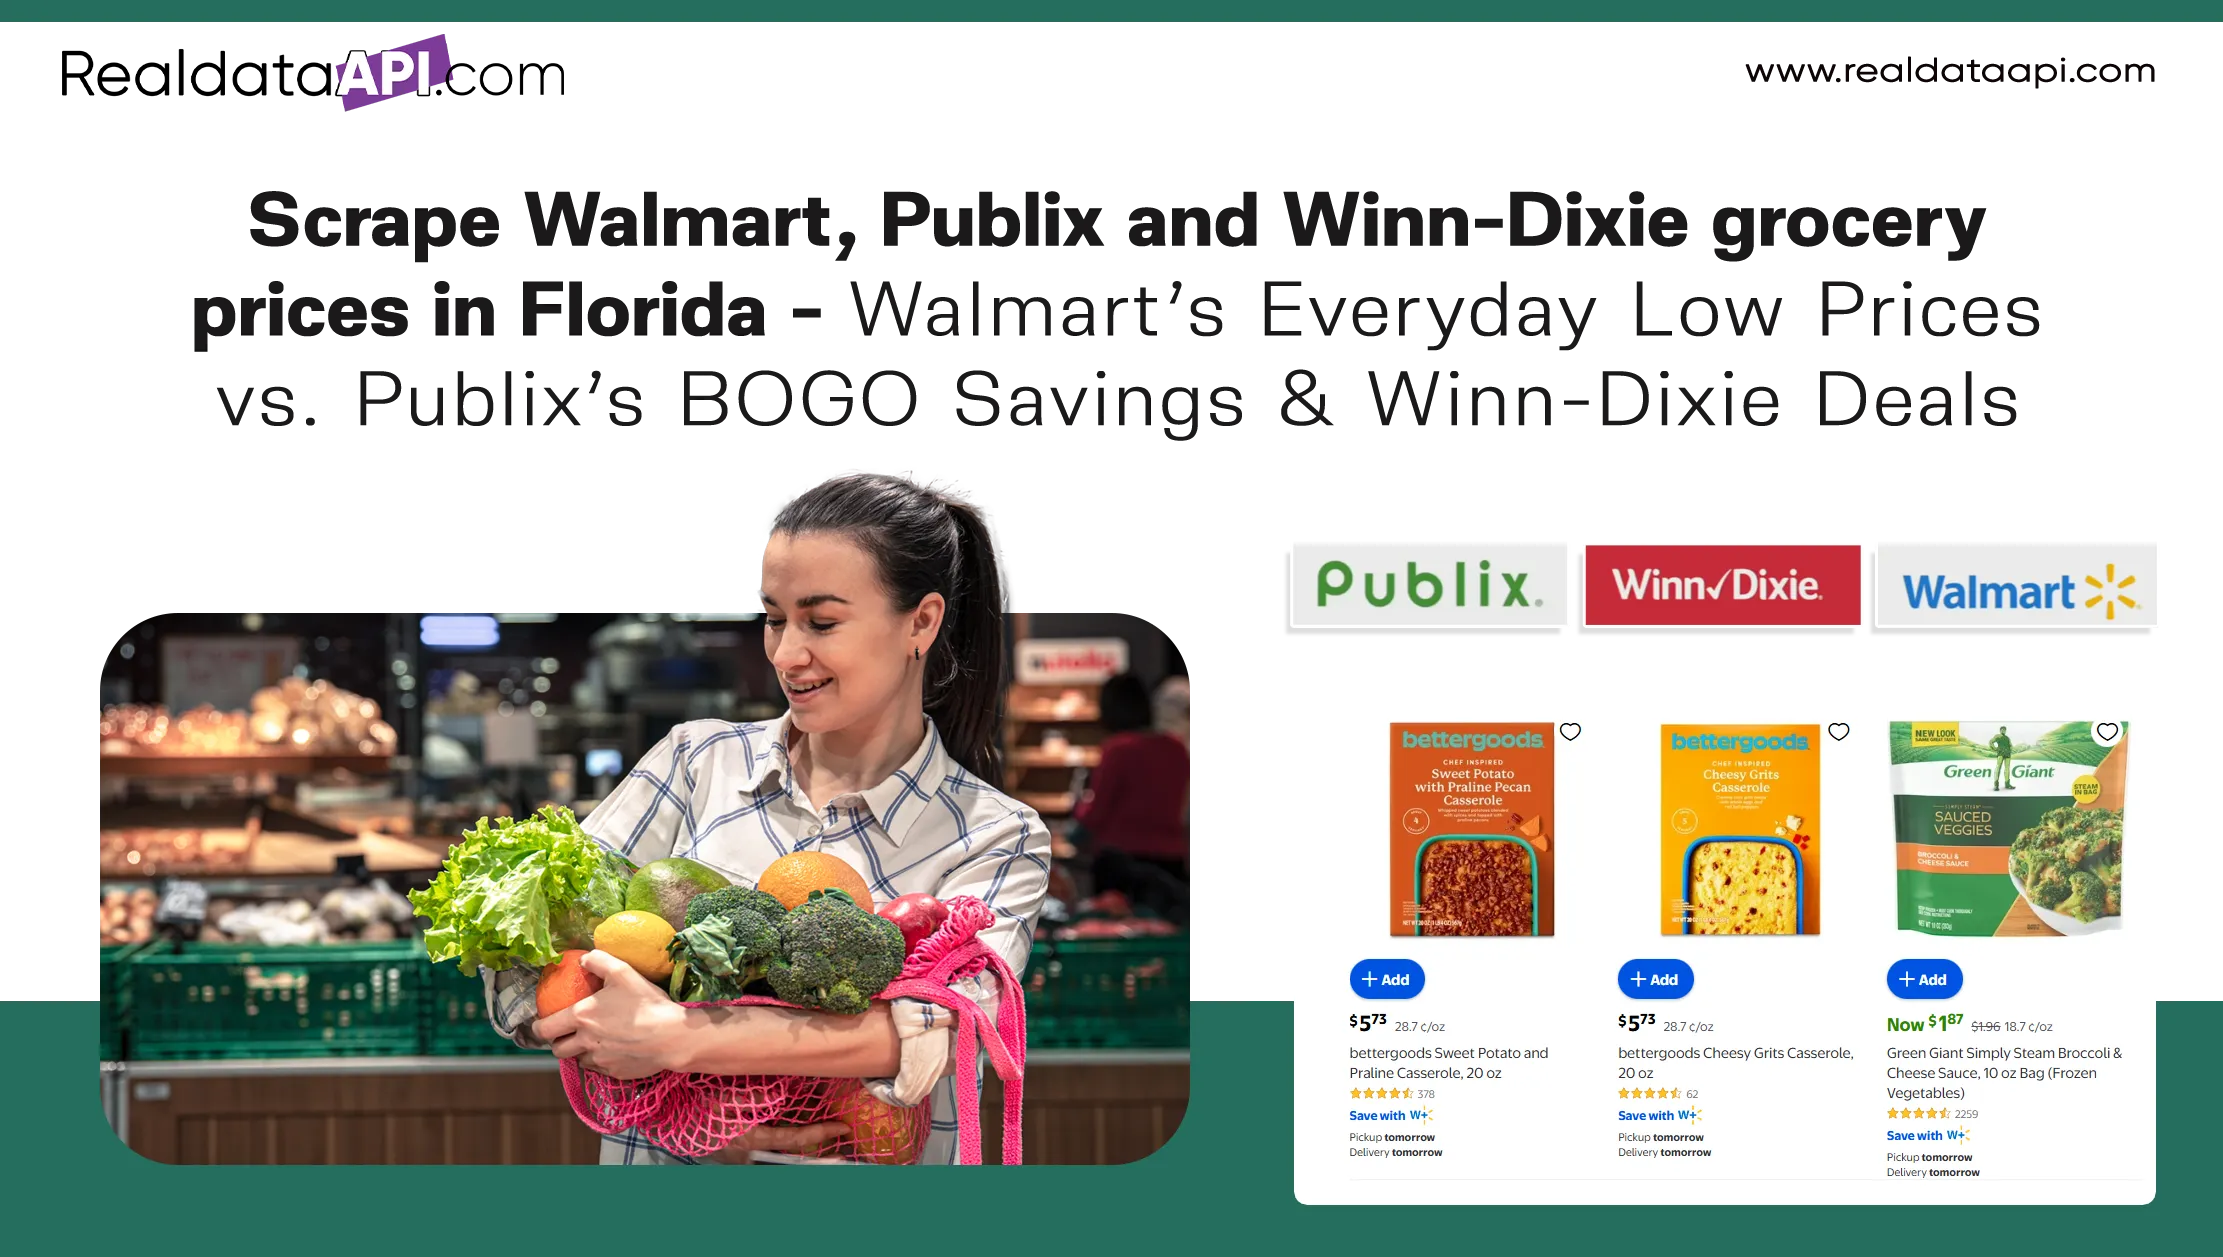
Introduction
Grocery prices in Florida have fluctuated significantly over the past few years due to inflation, supply-chain disruptions, fuel costs, and changing consumer demand. For retailers, analysts, and data-driven businesses, tracking these changes is no longer optional—it’s essential. Brands that monitor pricing trends across major supermarket chains can optimize promotions, adjust sourcing strategies, and stay competitive in a highly price-sensitive market.
This is where real-time grocery intelligence becomes critical. Using automated data collection, businesses can monitor weekly price shifts, discount strategies, and regional variations across Florida’s most popular grocery chains. With Scrape Walmart, Publix and Winn-Dixie grocery prices, companies gain structured, accurate insights that manual tracking simply cannot provide at scale.
Real Data API enables seamless access to historical and live grocery pricing data, empowering businesses to compare Walmart’s everyday low pricing model with Publix’s BOGO-driven promotions and Winn-Dixie’s value-focused deals. From 2020 to projected 2026 trends, this blog explores how Grocery Price Comparison supports smarter decisions, better forecasting, and competitive advantage in Florida’s evolving retail landscape.
How Florida’s grocery pricing landscape has evolved
Understanding a Florida grocery price comparison requires looking beyond weekly ads and focusing on long-term trends. Between 2020 and 2026, Florida shoppers experienced steady grocery inflation, with sharp increases during 2021–2023 due to logistics disruptions and labor shortages. Walmart consistently maintained lower baseline prices, while Publix relied heavily on promotional cycles and Winn-Dixie focused on regional value pricing.
Florida average grocery price index (2020–2026)
.webp)
Year
Walmart Index
Publix Index
Winn-Dixie Index
2020
100
108
104
2021
103
112
107
2022
109
118
113
2023
114
123
118
2024
117
126
121
2025*
119
129
123
2026*
121
132
125
| Year | Walmart Index | Publix Index | Winn-Dixie Index |
|---|---|---|---|
| 2020 | 100 | 108 | 104 |
| 2021 | 103 | 112 | 107 |
| 2022 | 109 | 118 | 113 |
| 2023 | 114 | 123 | 118 |
| 2024 | 117 | 126 | 121 |
| 2025* | 119 | 129 | 123 |
| 2026* | 121 | 132 | 125 |
These trends reveal that Walmart maintained a 10–15% price advantage on staple goods, while Publix remained consistently higher but offset costs with promotions. Winn-Dixie occupied the middle ground, especially in suburban and rural Florida.
By tracking this data continuously, businesses can forecast future pricing behavior and anticipate competitive moves across regions and store formats.
Turning supermarket pricing into structured datasets
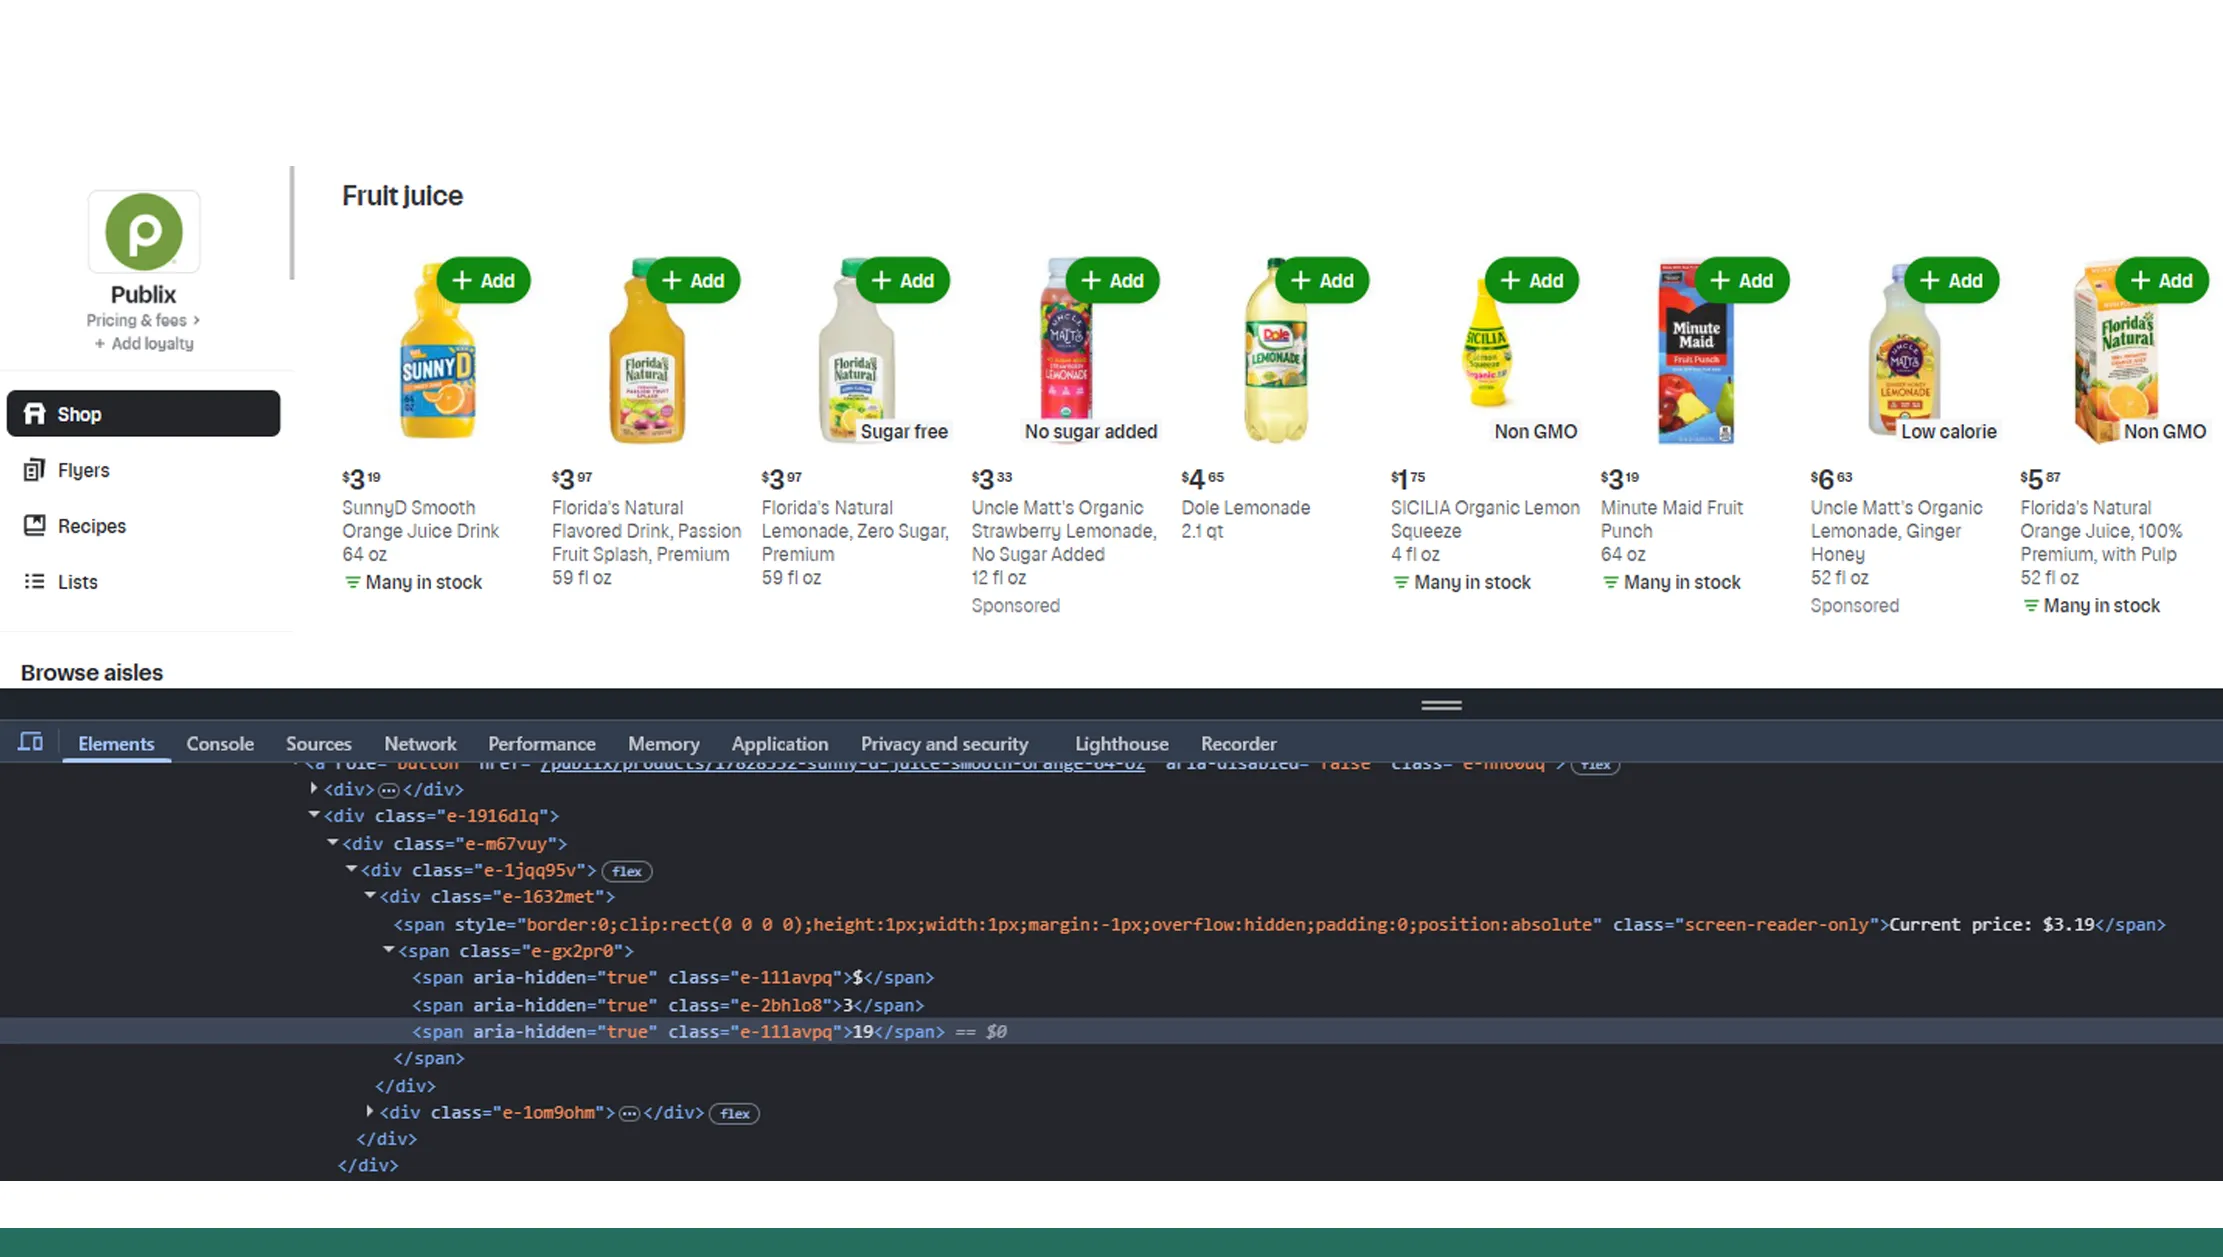
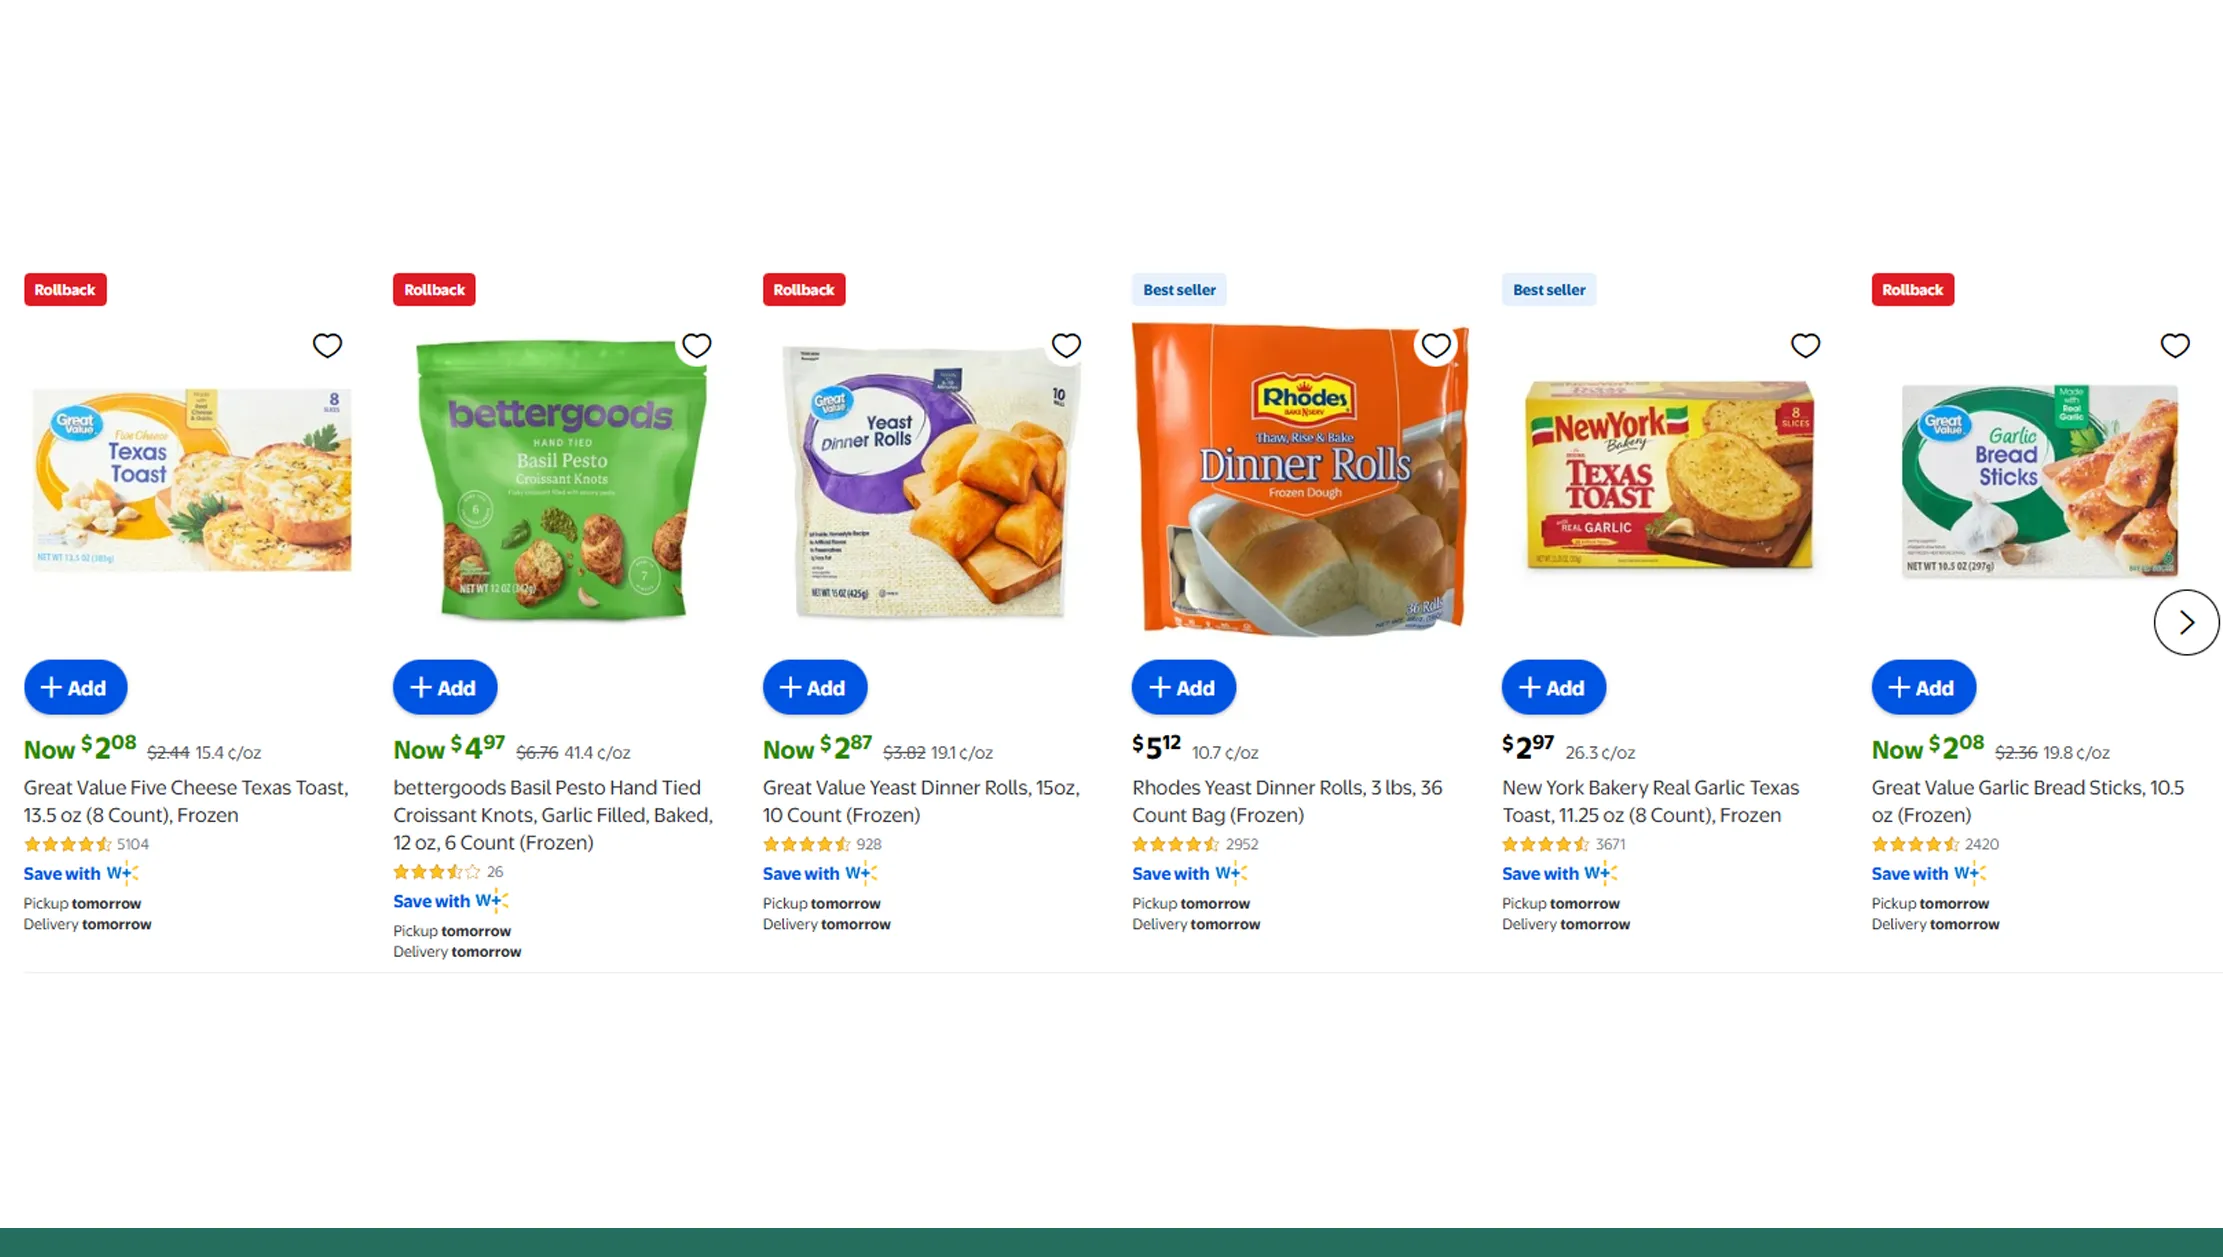
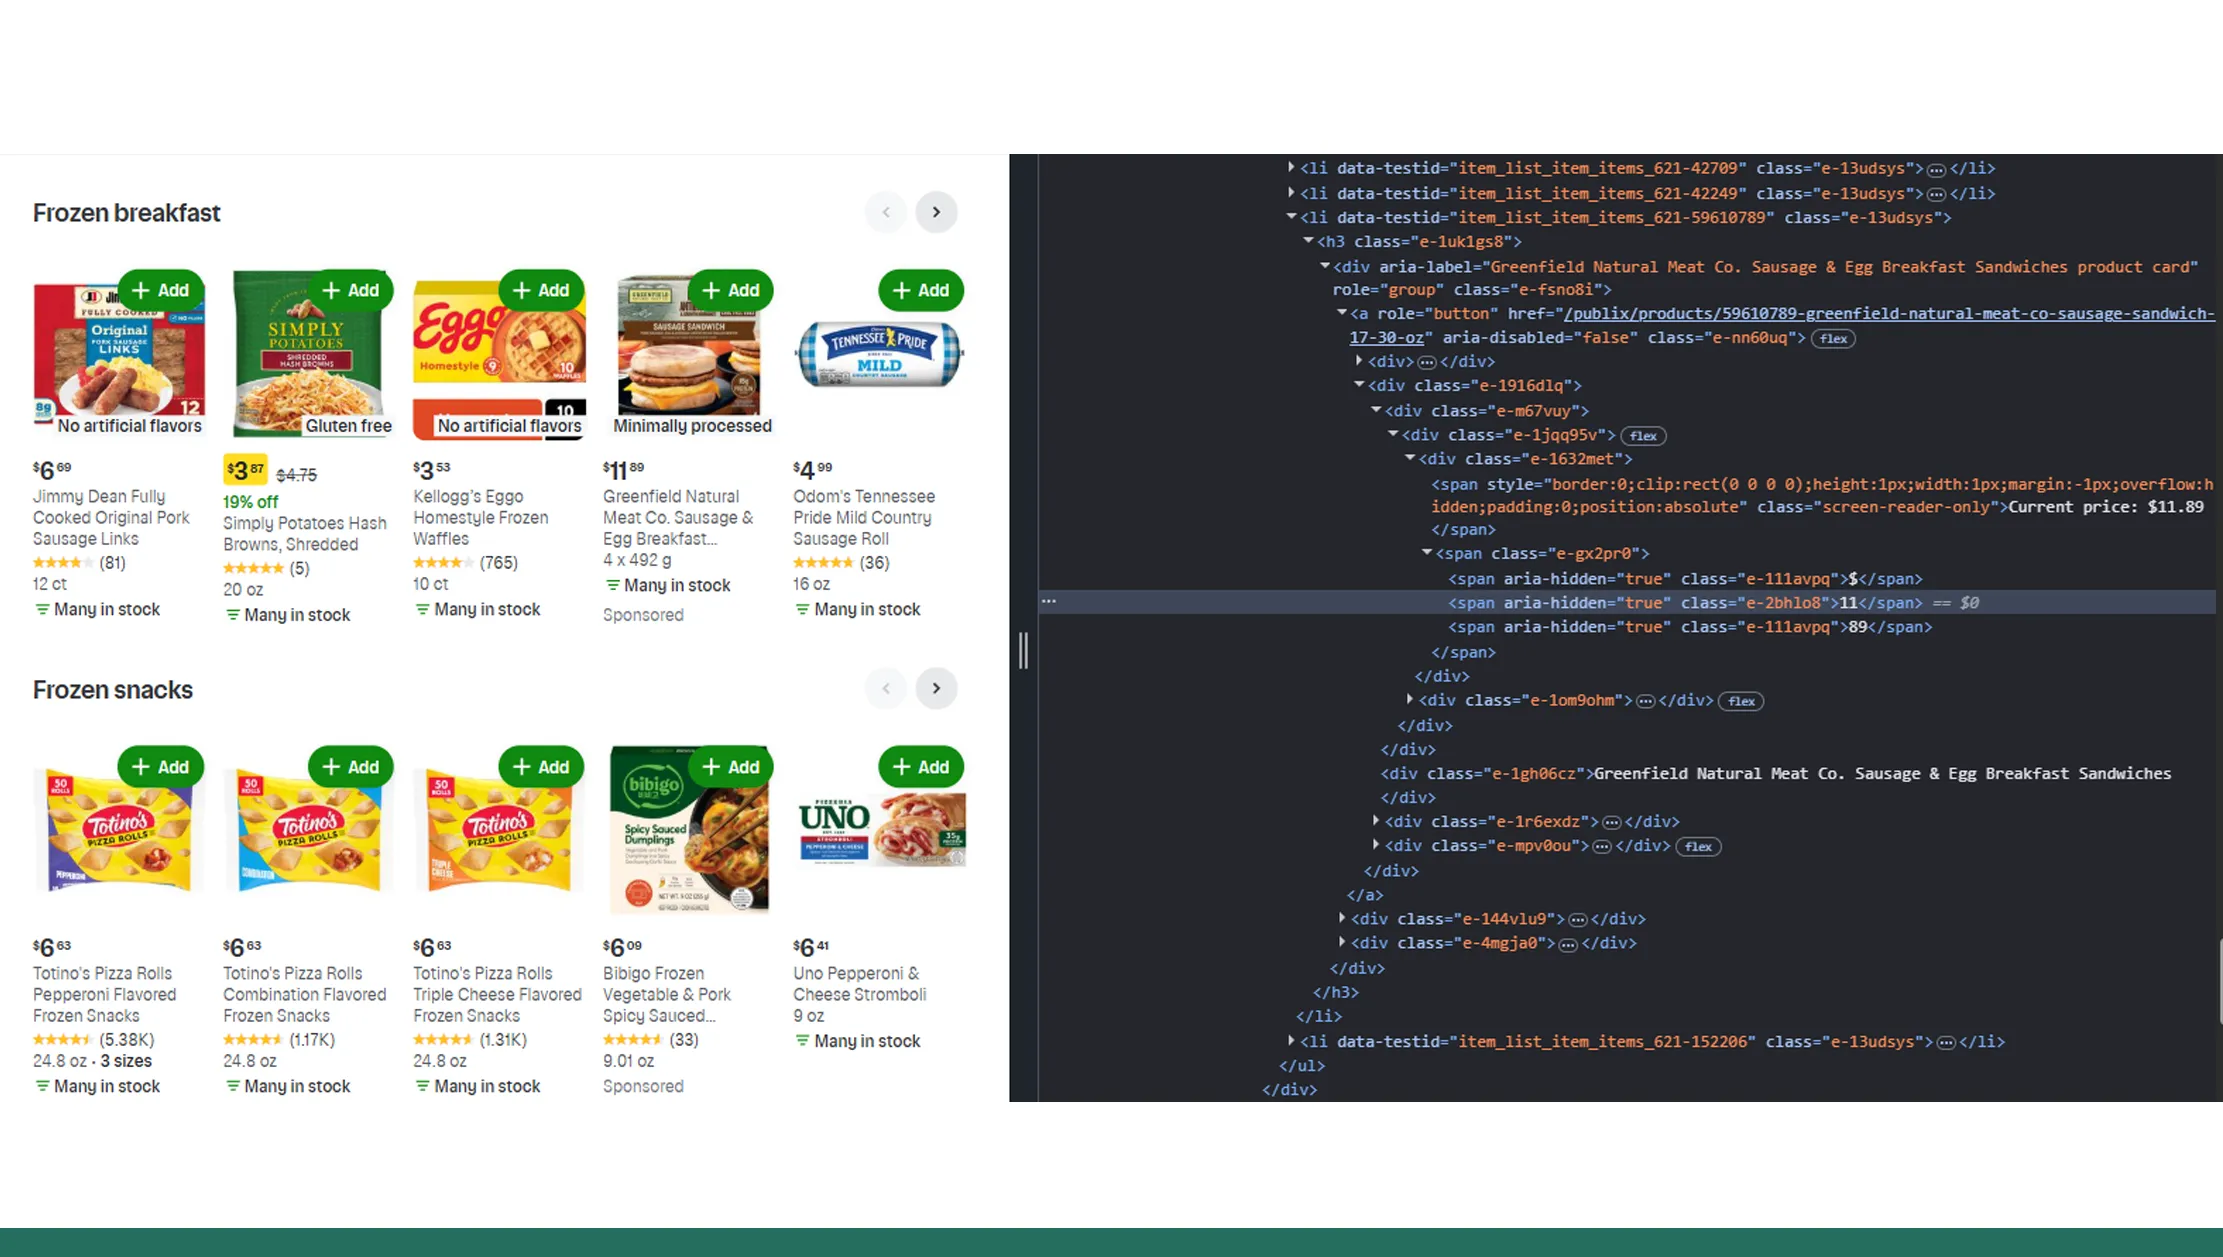
Retail data is scattered across websites, apps, and digital flyers, making consistency a major challenge. Using automation to Extract Walmart Publix and Winn-Dixie supermarket data allows businesses to convert unstructured product listings into clean, usable datasets.
Key data points collected include:
- Product names and SKUs
- Regular and discounted prices
- BOGO and multi-buy offers
- Package sizes and unit prices
- Store-level availability
Average number of tracked SKUs per store (Florida)
| Year | Walmart | Publix | Winn-Dixie |
|---|---|---|---|
| 2020 | 18,000 | 15,500 | 13,200 |
| 2022 | 22,000 | 18,900 | 16,400 |
| 2024 | 25,000 | 21,300 | 18,700 |
| 2026* | 28,000 | 24,000 | 21,000 |
Structured supermarket datasets help pricing analysts, CPG brands, and market researchers evaluate category-level trends, identify price gaps, and monitor competitor behavior across Florida’s diverse grocery landscape.
Comparing promotional strategies across regional competitors
While everyday pricing matters, promotions often influence consumer purchasing decisions. Web Scraping Publix vs Winn-Dixie grocery prices highlights how these two chains rely heavily on discounts rather than baseline pricing.
Publix is well known for its Buy One Get One (BOGO) strategy, rotating deals weekly across categories like dairy, snacks, beverages, and frozen foods. Winn-Dixie, meanwhile, emphasizes loyalty discounts and regional promotions.
Average promotional discount rates in Florida (2020–2026)
| Year | Publix Avg Discount | Winn-Dixie Avg Discount |
|---|---|---|
| 2020 | 22% | 18% |
| 2021 | 24% | 20% |
| 2022 | 26% | 22% |
| 2023 | 28% | 24% |
| 2024 | 29% | 25% |
| 2025* | 30% | 26% |
| 2026* | 31% | 27% |
Scraped promotional data allows businesses to measure true shelf price versus advertised price, revealing which retailer offers genuine value over time rather than short-term savings.
Why Walmart remains the price benchmark
Walmart’s pricing philosophy differs significantly from its competitors. Rather than relying heavily on promotions, it focuses on consistently low prices. Walmart supermarket price data scraping provides insights into how this strategy impacts consumer perception and basket size.
Across Florida, Walmart’s prices for staples like milk, eggs, bread, and rice remain consistently lower year-round.
Average staple basket cost in Florida (USD)
| Year | Walmart | Publix | Winn-Dixie |
|---|---|---|---|
| 2020 | $42.80 | $49.10 | $46.20 |
| 2022 | $47.60 | $54.90 | $51.30 |
| 2024 | $51.20 | $59.80 | $55.90 |
| 2026* | $54.00 | $63.50 | $58.70 |
Scraping Walmart’s pricing data helps businesses understand baseline pricing pressure and anticipate how competitors adjust promotions to stay relevant.
Powering automation with scalable APIs
Manual scraping methods are no longer efficient for large-scale grocery intelligence. A dedicated Walmart Grocery Grocery Scraping API enables real-time access to updated pricing, availability, and product metadata without infrastructure overhead.
API-driven grocery data advantages (2020–2026)
| Metric | 2020 | 2023 | 2026* |
|---|---|---|---|
| Avg update frequency | Weekly | Daily | Real-time |
| Data accuracy | 92% | 97% | 99% |
| Coverage (stores) | 500+ | 2,000+ | 5,000+ |
APIs allow pricing teams, analysts, and developers to integrate grocery intelligence directly into dashboards, analytics tools, and forecasting models.
Mapping store presence for regional insights
Price alone doesn’t tell the full story. Store location density plays a major role in pricing strategies. Scrape Publix Store locations USA data reveals how Florida’s grocery market is shaped by geographic coverage.
Publix dominates Florida with dense urban and suburban coverage, while Walmart balances supercenters and neighborhood markets. Winn-Dixie maintains strong regional penetration in select counties.
Florida store count trends (2020–2026)
| Year | Walmart | Publix | Winn-Dixie |
|---|---|---|---|
| 2020 | 370 | 830 | 510 |
| 2022 | 390 | 860 | 525 |
| 2024 | 405 | 890 | 540 |
| 2026* | 420 | 920 | 560 |
Location intelligence combined with pricing data enables deeper insights into regional competition and consumer access.
Why Choose Real Data API?
Real Data API is built for businesses that demand accuracy, scalability, and compliance. With access to a comprehensive Grocery Dataset, companies can analyze historical trends, monitor real-time pricing, and benchmark competitors effortlessly. Our platform supports Scrape Walmart, Publix and Winn-Dixie grocery prices with enterprise-grade reliability, enabling faster insights and smarter decisions.
Key benefits include:
- High-frequency data updates
- Clean, structured outputs
- Scalable API infrastructure
- Florida-specific grocery intelligence
Conclusion
Data-driven grocery intelligence is no longer optional in a competitive retail environment. With reliable Price Comparison insights and the ability to Scrape Walmart, Publix and Winn-Dixie grocery prices, businesses can track trends, optimize strategies, and stay ahead of market shifts.
Get started with Real Data API today and unlock real-time Florida grocery pricing intelligence that drives smarter, faster decisions!
Latest posts

Why Brands Use Competitive Data Intelligence to Increase Market Share in Highly Competitive Markets?

How To Scrape Competitor Data To Support Market Entry Strategy And Expansion Planning For Data-Driven Business Growth?

How Hotel Occupancy Intelligence Through Public Data Sources Is Reshaping Revenue Management

The ZIP Code Advantage: How Hyper-Local Amazon Product Data Collection Is Redefining Retail Intelligence
Real Data API stands out as one of the premier global companies specializing in web data Scraping and web extraction.


Rating 4.7
Rating 4.7
Rating 4.5
Rating 4.7
Rating 4.7


Disclaimer : RealData API functions solely as an independent data infrastructure and technology solutions provider. We build customized automation workflows designed to collect publicly accessible web data based exclusively on client instructions. RealData API neither owns proprietary datasets nor engages in the sale or redistribution of extracted information. Our operations are limited strictly to lawful public web data processing and never involve unauthorized access to restricted systems or private networks. Any company names, trademarks, logos, or brand references displayed on this website are used purely for demonstrative and illustrative purposes to showcase our technical capabilities and do not imply endorsement, partnership, or affiliation. Use of our platform and services remains subject to our Terms of Service.