Introduction
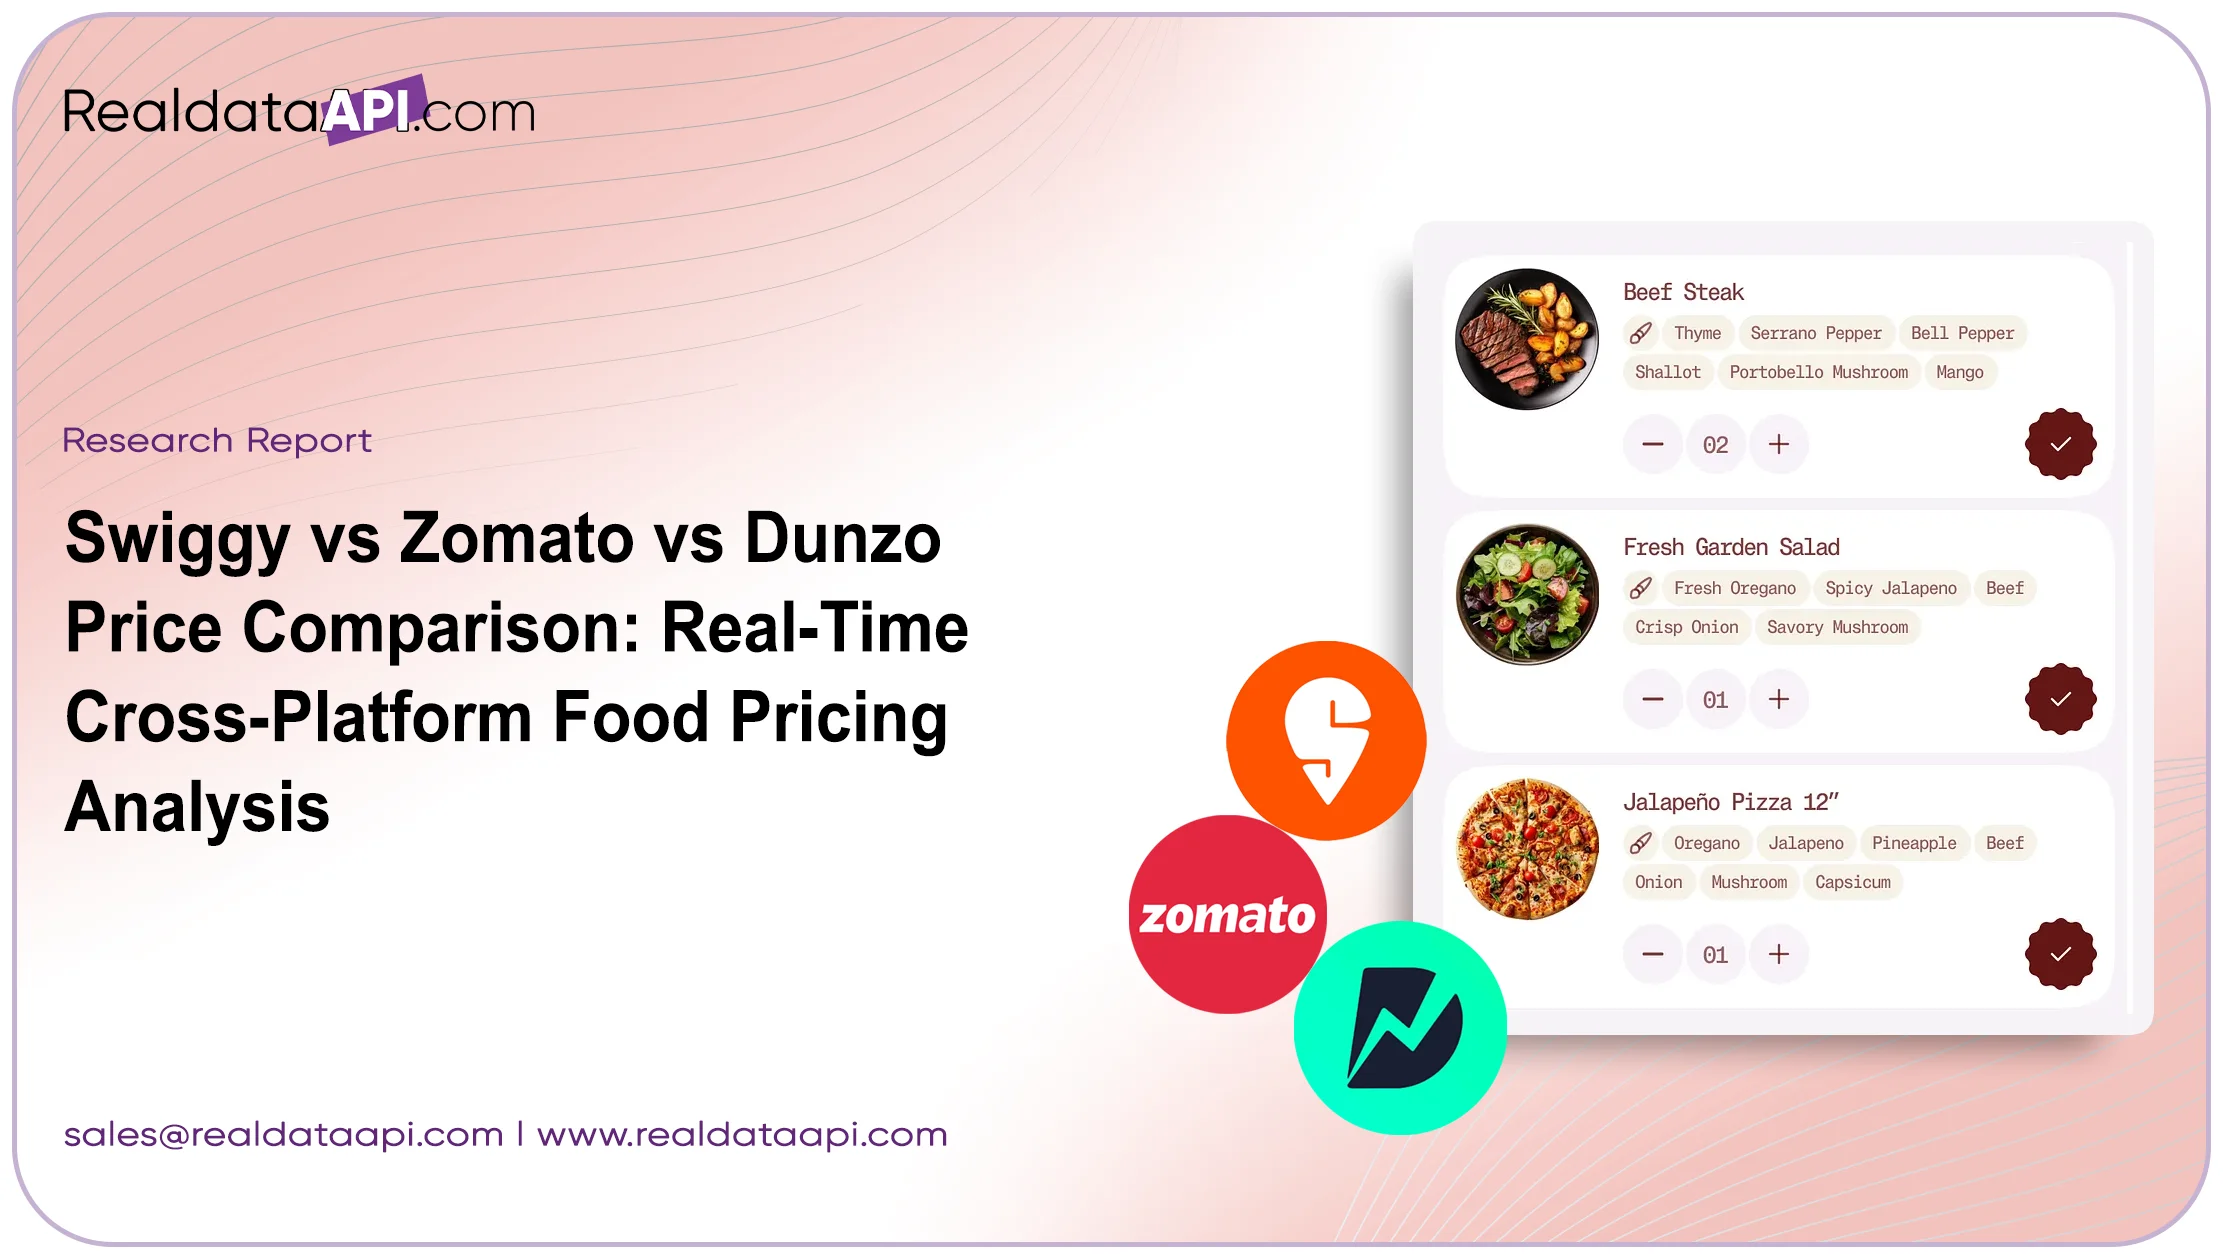
In today’s competitive food delivery market, accurate price comparison across platforms is crucial for restaurants, delivery apps, and market analysts. The Swiggy vs Zomato vs Dunzo Price Comparison report leverages Real-Time Restaurant Price Scraper API and Swiggy Scraper tools to collect live menu pricing, delivery charges, and promotional offers. By integrating Zomato Delivery API and a Cross-Platform Food Price Tracker, this research enables businesses to make informed pricing, marketing, and menu decisions.
Using Food Delivery Price Comparison Tool features, the report provides insights on cost variations, discounts, and platform-specific pricing strategies. With Compare Food Prices on Swiggy & Zomato, stakeholders can monitor consumer trends, optimize delivery fees, and enhance profitability. Additionally, Scrape Menu Prices from Swiggy & Dunzo ensures complete visibility into cross-platform pricing, while Zomato vs Swiggy Menu Pricing Intelligence allows businesses to benchmark competitors effectively. The Swiggy vs Zomato vs Dunzo Price Comparison serves as a comprehensive guide for pricing optimization and strategic planning in real-time.
Average Menu Prices Comparison
Table 1: Average Menu Prices (INR) Across Platforms
| Year | Swiggy | Zomato | Dunzo | Analysis |
|---|---|---|---|---|
| 2020 | 250 | 245 | 260 | Dunzo shows slightly higher pricing; Swiggy & Zomato remain competitive. |
| 2021 | 260 | 255 | 265 | Swiggy gradually increases; price gap with Zomato remains small. |
| 2022 | 270 | 260 | 270 | Pricing parity between Swiggy & Dunzo; Zomato slightly lower. |
| 2023 | 280 | 270 | 275 | Swiggy leads on higher-value orders; Zomato keeps competitive. |
| 2024 | 290 | 280 | 280 | Dunzo stabilizes; Swiggy slightly above market average. |
| 2025 | 300 | 290 | 285 | Swiggy dominates high-end pricing; Zomato & Dunzo balanced. |
Analysis: The Swiggy vs Zomato vs Dunzo Price Comparison shows that Swiggy often leads with slightly higher menu prices, while Zomato and Dunzo maintain competitive mid-range pricing.
Delivery Charges & Service Fees Analysis
Table 2: Average Delivery Charges (INR)
| Year | Swiggy | Zomato | Dunzo | Analysis |
|---|---|---|---|---|
| 2020 | 30 | 28 | 35 | Dunzo higher delivery fees; Zomato lowest. |
| 2021 | 32 | 30 | 36 | Swiggy gradually increases; Zomato remains cost-effective. |
| 2022 | 35 | 32 | 38 | Delivery charges rising across all platforms. |
| 2023 | 37 | 34 | 40 | Dunzo charges premium; Swiggy maintains mid-level. |
| 2024 | 40 | 36 | 42 | Zomato competitive; Swiggy slightly higher. |
| 2025 | 42 | 38 | 45 | Overall upward trend; Swiggy vs Zomato vs Dunzo Price Comparison highlights differences. |
Analysis: The Swiggy vs Zomato vs Dunzo Price Comparison indicates Dunzo consistently charges higher delivery fees, while Zomato remains cost-efficient.
Discount & Promo Analysis
Table 3: Average Discounts (%)
| Year | Swiggy | Zomato | Dunzo | Analysis |
|---|---|---|---|---|
| 2020 | 10 | 12 | 8 | Zomato more aggressive on promotions. |
| 2021 | 11 | 13 | 9 | Discount gap slightly increases. |
| 2022 | 12 | 14 | 10 | Swiggy catching up with promotions. |
| 2023 | 13 | 15 | 10 | Zomato remains promo leader. |
| 2024 | 12 | 14 | 11 | Dunzo improves customer engagement. |
| 2025 | 13 | 15 | 12 | Promotions crucial for user retention. |
Analysis: The Swiggy vs Zomato vs Dunzo Price Comparison reveals Zomato consistently leverages higher discounts, impacting customer choice.
Popular Menu Item Price Trends
Table 4: Selected Menu Items Average Prices (INR)
| Item | Swiggy | Zomato | Dunzo | Analysis |
|---|---|---|---|---|
| Burger | 120 | 115 | 125 | Dunzo slightly higher; Swiggy competitive. |
| Pizza | 350 | 340 | 355 | Price alignment across platforms; Swiggy premium. |
| Biryani | 220 | 215 | 225 | Dunzo leads; Swiggy mid-range. |
| Sandwich | 150 | 145 | 155 | Pricing parity; minor differences. |
Analysis: Menu-specific analysis supports strategic pricing, revealing how Swiggy vs Zomato vs Dunzo Price Comparison impacts food selection.
Peak Hour Pricing Insights
Table 5: Price Surge During Peak Hours (%)
| Year | Swiggy | Zomato | Dunzo | Analysis |
|---|---|---|---|---|
| 2020 | 5 | 4 | 6 | Dunzo premium during peak hours. |
| 2021 | 6 | 5 | 7 | Swiggy slightly increases surge pricing. |
| 2022 | 6 | 5 | 8 | Dunzo peak pricing continues upward. |
| 2023 | 7 | 6 | 9 | Zomato competitive. |
| 2024 | 7 | 6 | 9 | Swiggy mid-tier surge; Dunzo higher. |
| 2025 | 8 | 6 | 10 | Swiggy vs Zomato vs Dunzo Price Comparison shows Dunzo consistently surges highest. |
Geographic Pricing Variations
Table 6: Average Prices Across Cities (INR)
| City | Swiggy | Zomato | Dunzo | Analysis |
|---|---|---|---|---|
| Delhi | 280 | 270 | 290 | Dunzo premium in metro regions. |
| Mumbai | 300 | 290 | 305 | Pricing differences aligned with demand. |
| Bangalore | 270 | 265 | 275 | Swiggy slightly higher; Zomato competitive. |
| Hyderabad | 260 | 255 | 265 | Consistent trends across platforms. |
Analysis: Geographic pricing highlights regional strategy differences and reinforces the Swiggy vs Zomato vs Dunzo Price Comparison insights.
Conclusion
The Swiggy vs Zomato vs Dunzo Price Comparison provides actionable insights for restaurants, delivery platforms, and analysts to monitor menu pricing, delivery charges, and promotions in real time. Leveraging Cross-Platform Food Price Tracker, Food Delivery Price Comparison Tool, and Real-Time Restaurant Price Scraper API, stakeholders can optimize pricing strategies, enhance profitability, and stay competitive.
Unlock real-time pricing intelligence today—monitor menus, compare platforms, and drive smarter food delivery decisions with our Swiggy vs Zomato vs Dunzo Price Comparison solutions!
Latest posts

Industry-specific data APIs for businesses - Transforming Data Collection, Analytics, and Competitive Monitoring
The Legal Edge: How Law Firm Data Collection from Martindale Is Powering the Next Generation of Legal Intelligence
The Complete Guide to Web Scraping Grocery Data from Sobeys

How to Scrape Market and Competitor Data for Startup Growth Strategies and Faster Business Scaling?
Real Data API stands out as one of the premier global companies specializing in web data Scraping and web extraction.


Rating 4.7
Rating 4.7
Rating 4.5
Rating 4.7
Rating 4.7


Disclaimer : RealData API functions solely as an independent data infrastructure and technology solutions provider. We build customized automation workflows designed to collect publicly accessible web data based exclusively on client instructions. RealData API neither owns proprietary datasets nor engages in the sale or redistribution of extracted information. Our operations are limited strictly to lawful public web data processing and never involve unauthorized access to restricted systems or private networks. Any company names, trademarks, logos, or brand references displayed on this website are used purely for demonstrative and illustrative purposes to showcase our technical capabilities and do not imply endorsement, partnership, or affiliation. Use of our platform and services remains subject to our Terms of Service.