
Introduction
Modern businesses increasingly depend on live analytics and visual reporting systems to improve transparency, accelerate decision-making, and enhance client communication. Companies across industries now require scalable solutions capable of converting raw digital information into actionable visual intelligence. Organizations focused on building interactive dashboards for client reporting using scraped data can deliver faster insights, automate reporting workflows, and improve operational visibility significantly.
Interactive dashboards powered by automated extraction systems help businesses track competitor pricing, customer behavior, inventory availability, market trends, and operational performance in real time. These dashboards allow organizations to centralize large volumes of structured information into accessible and visually engaging reporting environments.
A scalable Web Scraping API plays a central role in dashboard automation by enabling continuous extraction and delivery of structured data from websites, marketplaces, and digital platforms. APIs simplify integration with analytics systems, BI platforms, and reporting tools.
Between 2020 and 2026, global investment in cloud analytics, AI-driven reporting systems, and data visualization platforms has grown rapidly. Businesses increasingly prioritize real-time dashboards capable of supporting predictive analytics, automated reporting, and client-facing intelligence systems.
As competition intensifies across digital industries, organizations that adopt scalable dashboard infrastructures gain stronger operational agility, improved reporting accuracy, and enhanced customer engagement capabilities.
Delivering Smarter Reporting Experiences
Client reporting has evolved beyond static spreadsheets and manual updates. Modern organizations require dynamic visualization systems capable of presenting continuously updated intelligence in a user-friendly format.
Businesses increasingly create client-facing dashboards for scraped data to improve reporting transparency and provide clients with live operational insights. Interactive dashboards help organizations simplify complex datasets while enabling faster analysis and decision-making.
Global Dashboard Analytics Market (2020–2026)
| Global Dashboard Analytics Market (2020–2026) | Market Size ($ Billion) |
|---|---|
| 2020 | 21.4 |
| 2021 | 24.9 |
| 2022 | 29.3 |
| 2023 | 34.6 |
| 2024 | 40.8 |
| 2025 | 47.5 |
| 2026 | 55.2 |
Client-facing dashboards commonly display:
- Competitor pricing intelligence
- Product performance metrics
- Inventory monitoring
- Customer sentiment analysis
- Sales and conversion trends
- Operational KPIs
Organizations in retail and eCommerce use live dashboards to provide clients with instant visibility into pricing fluctuations and market activity. Financial firms deliver portfolio analytics and investment monitoring through real-time visualization systems.
Interactive dashboards also improve collaboration by allowing clients to customize filters, reporting views, and performance metrics according to business objectives.
As enterprises increasingly adopt cloud-native analytics environments, dashboard accessibility and scalability continue improving across industries.
The growing demand for real-time reporting between 2024 and 2026 is expected to further accelerate investment in client-facing visualization systems.
Integrating Analytics Platforms with Live Data

Modern reporting systems require seamless integration between extraction infrastructures, APIs, and business intelligence platforms. APIs play a crucial role in ensuring reliable and automated data synchronization across analytics environments.
Organizations increasingly connect scraped data to BI dashboards for clients to maintain continuous visibility into business operations and market performance. API-driven integrations help businesses automate reporting workflows while minimizing manual processing requirements.
API-Based Analytics Adoption Trends (2020–2026)
| Year | Enterprises Using API-Driven Dashboards |
|---|---|
| 2020 | 36% |
| 2021 | 44% |
| 2022 | 53% |
| 2023 | 61% |
| 2024 | 69% |
| 2025 | 77% |
| 2026 | 85% |
Modern dashboard ecosystems often include:
- REST and GraphQL APIs
- Real-time event streaming systems
- Cloud-based data warehouses
- ETL and ELT pipelines
- Automated synchronization frameworks
Retail organizations integrate APIs with platforms like Tableau, Power BI, and Looker to monitor competitor pricing and customer engagement continuously.
Financial companies use API-driven dashboards for portfolio tracking, fraud detection, and market intelligence visualization.
These integrations improve scalability by enabling multiple departments and stakeholders to access structured information simultaneously. APIs also help organizations maintain reporting consistency across global operations.
As real-time analytics becomes increasingly important, API-driven dashboard ecosystems will continue expanding rapidly over the next several years.
Supporting Faster Decision-Making Through Live Insights

Businesses today operate in rapidly changing digital environments where delayed reporting can negatively impact performance and competitiveness. Real-time dashboards help organizations respond quickly to operational changes and market shifts.
Enterprises increasingly build real-time dashboards for client insights to improve responsiveness and provide instant access to performance intelligence. These systems continuously process incoming information and display updated metrics with minimal latency.
Real-Time Analytics Adoption Growth (2020–2026)
| Year | Enterprises Using Real-Time Dashboards |
|---|---|
| 2020 | 33% |
| 2021 | 41% |
| 2022 | 50% |
| 2023 | 59% |
| 2024 | 68% |
| 2025 | 76% |
| 2026 | 84% |
Real-time dashboard capabilities include:
- Instant KPI monitoring
- Automated anomaly detection
- Dynamic chart updates
- Live alert systems
- Predictive analytics integrations
Retailers use real-time dashboards to monitor flash sales, inventory changes, and customer demand fluctuations instantly. Logistics companies track shipment movement, delivery delays, and fleet performance continuously.
Streaming analytics technologies such as Kafka and Spark Streaming often support these infrastructures by enabling low-latency data processing and synchronization.
AI-powered forecasting tools are also becoming integrated into dashboard systems, helping businesses anticipate market shifts and customer behavior trends more accurately.
Real-time analytics environments significantly improve operational agility and decision-making efficiency across industries.
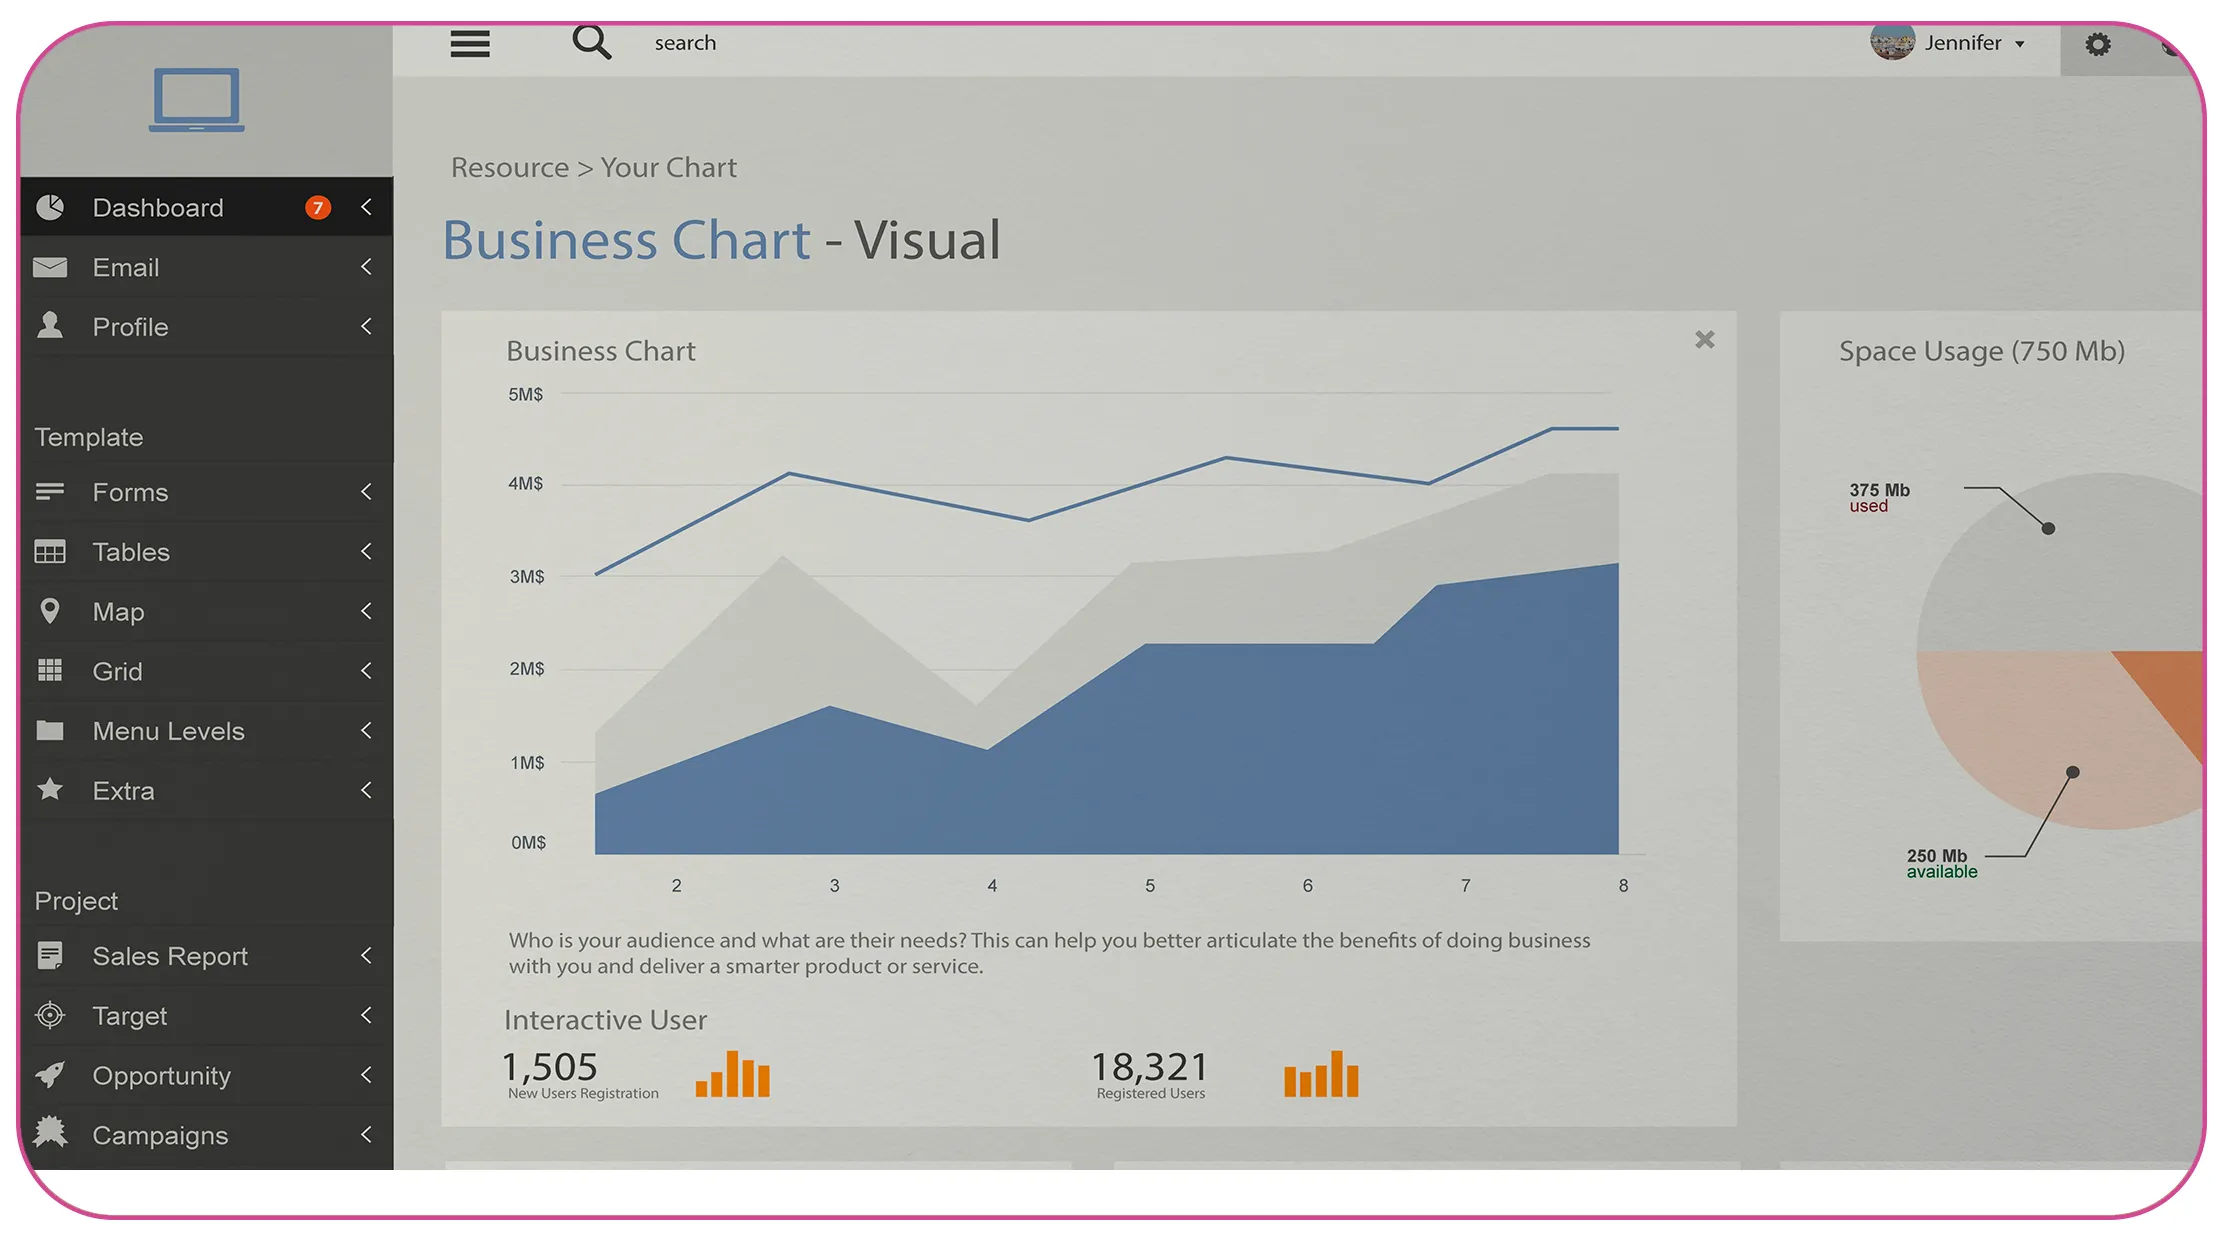
Improving Data Clarity Through Visualization

Raw data alone provides limited value unless businesses can present it in a clear, structured, and visually meaningful format. Effective visualization systems help organizations transform complex datasets into actionable business intelligence.
Modern enterprises increasingly prioritize visualizing scraped data for business clients to simplify reporting and improve data interpretation. Visualization technologies allow stakeholders to identify patterns, trends, and anomalies more efficiently.
Enterprise Visualization Technology Growth (2020–2026)
| Year | Global Visualization Software Market ($ Billion) |
|---|---|
| 2020 | 8.6 |
| 2021 | 10.1 |
| 2022 | 12.0 |
| 2023 | 14.4 |
| 2024 | 17.3 |
| 2025 | 20.6 |
| 2026 | 24.5 |
Businesses commonly use:
- Interactive charts and graphs
- Geographic heat maps
- KPI scorecards
- Predictive analytics panels
- Real-time monitoring widgets
Retail companies visualize product demand, competitor pricing, and customer purchasing trends to optimize inventory and pricing strategies.
Healthcare organizations use dashboards to monitor patient data, resource allocation, and operational performance across facilities.
Visualization systems improve communication between businesses and clients by making analytical insights easier to understand and act upon.
As AI-driven analytics and automation technologies continue evolving, visualization platforms are expected to become increasingly interactive and predictive between 2024 and 2026.
Scaling Automation Through Managed Extraction Systems

Maintaining large-scale extraction and dashboard infrastructures internally can require significant engineering resources. Many organizations therefore adopt managed solutions to simplify operations and improve scalability.
Professional Web Scraping Services help businesses automate extraction, synchronization, and reporting workflows while reducing infrastructure management complexity. These services support continuous data collection across websites, marketplaces, and digital platforms.
Managed Data Extraction Market Growth (2020–2026)
| Year | Market Size ($ Billion) |
|---|---|
| 2020 | 4.8 |
| 2021 | 6.0 |
| 2022 | 7.5 |
| 2023 | 9.5 |
| 2024 | 11.9 |
| 2025 | 14.7 |
| 2026 | 18.0 |
Managed extraction providers commonly offer:
- Automated crawling systems
- Proxy rotation and anti-block management
- Real-time API integrations
- Data normalization frameworks
- Cloud-based scalability
- Monitoring and alert systems
Retailers use managed extraction services to automate competitor tracking and market intelligence reporting. Travel companies analyze pricing and availability trends across booking platforms using scalable extraction infrastructures.
Managed services reduce operational overhead while improving extraction consistency and dashboard reliability.
As websites continue implementing advanced anti-bot technologies, managed service providers are becoming increasingly important for enterprise analytics operations.
Enabling Large-Scale Monitoring and Discovery

Real-time dashboards often depend on enterprise-scale crawling systems capable of continuously discovering and monitoring large volumes of digital content. Large-scale crawling helps businesses maintain accurate and updated reporting environments.
Advanced Enterprise Web Crawling systems support continuous indexing, extraction, and monitoring across marketplaces, social platforms, news portals, and competitor websites.
Enterprise Crawling Adoption Trends (2020–2026)
| Year | Enterprises Using Large-Scale Crawlers |
|---|---|
| 2020 | 35% |
| 2021 | 43% |
| 2022 | 51% |
| 2023 | 60% |
| 2024 | 68% |
| 2025 | 76% |
| 2026 | 84% |
Enterprise crawling infrastructures typically include:
- Distributed crawler nodes
- Dynamic rendering engines
- AI-driven content prioritization
- URL scheduling systems
- Automated indexing frameworks
Retail businesses crawl competitor product pages and promotional campaigns continuously to support pricing intelligence dashboards.
Financial organizations monitor economic reports, market news, and investment trends to improve forecasting and reporting accuracy.
AI-enhanced crawling systems improve efficiency by automatically identifying high-value content and optimizing crawl performance.
As digital ecosystems continue expanding rapidly, enterprise crawling will remain essential for maintaining scalable dashboard intelligence infrastructures.
Why Choose Real Data API?
Real Data API provides enterprise-grade solutions designed to support organizations focused on building interactive dashboards for client reporting using scraped data. Businesses require scalable extraction infrastructures, reliable APIs, and continuously updated datasets to power modern analytics ecosystems effectively.
The platform offers advanced extraction systems, scalable dashboard integrations, automated synchronization frameworks, and structured Web Scraping Datasets optimized for real-time analytics and reporting operations.
Key advantages include:
- Real-time data extraction and delivery
- Enterprise-scale crawling capabilities
- Automated dashboard synchronization
- Scalable cloud-based infrastructure
- Structured analytics-ready datasets
- Advanced anti-block management
- API-first integration support
Real Data API helps organizations improve reporting efficiency, accelerate analytics workflows, and deliver highly responsive client-facing intelligence systems.
Conclusion
Modern enterprises increasingly rely on live analytics and automated visualization systems to improve operational transparency and support faster decision-making. Organizations focused on building interactive dashboards for client reporting using scraped data gain stronger analytical capabilities, improved client engagement, and enhanced business intelligence performance.
Between 2020 and 2026, growing investment in AI-driven analytics, cloud-native reporting systems, and scalable extraction infrastructures continues accelerating dashboard adoption across industries. Businesses now require highly responsive reporting environments capable of processing and visualizing continuously changing information in real time.
From enterprise crawling to managed extraction services and structured datasets, interactive dashboards have become a foundational component of modern digital reporting ecosystems.
Ready to transform your client reporting systems with real-time analytics and automated dashboards? Connect with Real Data API today and build scalable, intelligent reporting solutions powered by advanced web scraping and live data automation!
Latest posts

Why Brands Use Competitive Data Intelligence to Increase Market Share in Highly Competitive Markets?

How To Scrape Competitor Data To Support Market Entry Strategy And Expansion Planning For Data-Driven Business Growth?

How Hotel Occupancy Intelligence Through Public Data Sources Is Reshaping Revenue Management

The ZIP Code Advantage: How Hyper-Local Amazon Product Data Collection Is Redefining Retail Intelligence
Real Data API stands out as one of the premier global companies specializing in web data Scraping and web extraction.


Rating 4.7
Rating 4.7
Rating 4.5
Rating 4.7
Rating 4.7


Disclaimer : RealData API functions solely as an independent data infrastructure and technology solutions provider. We build customized automation workflows designed to collect publicly accessible web data based exclusively on client instructions. RealData API neither owns proprietary datasets nor engages in the sale or redistribution of extracted information. Our operations are limited strictly to lawful public web data processing and never involve unauthorized access to restricted systems or private networks. Any company names, trademarks, logos, or brand references displayed on this website are used purely for demonstrative and illustrative purposes to showcase our technical capabilities and do not imply endorsement, partnership, or affiliation. Use of our platform and services remains subject to our Terms of Service.