Introduction
Beauty brands lose revenue when they fail to track competitor pricing, discount timing, trending SKUs, and consumer sentiment across marketplaces like Nykaa, Amazon, and Flipkart. The Indian beauty industry is becoming increasingly competitive, and businesses now depend on data-driven intelligence to stay ahead in ecommerce marketplaces.
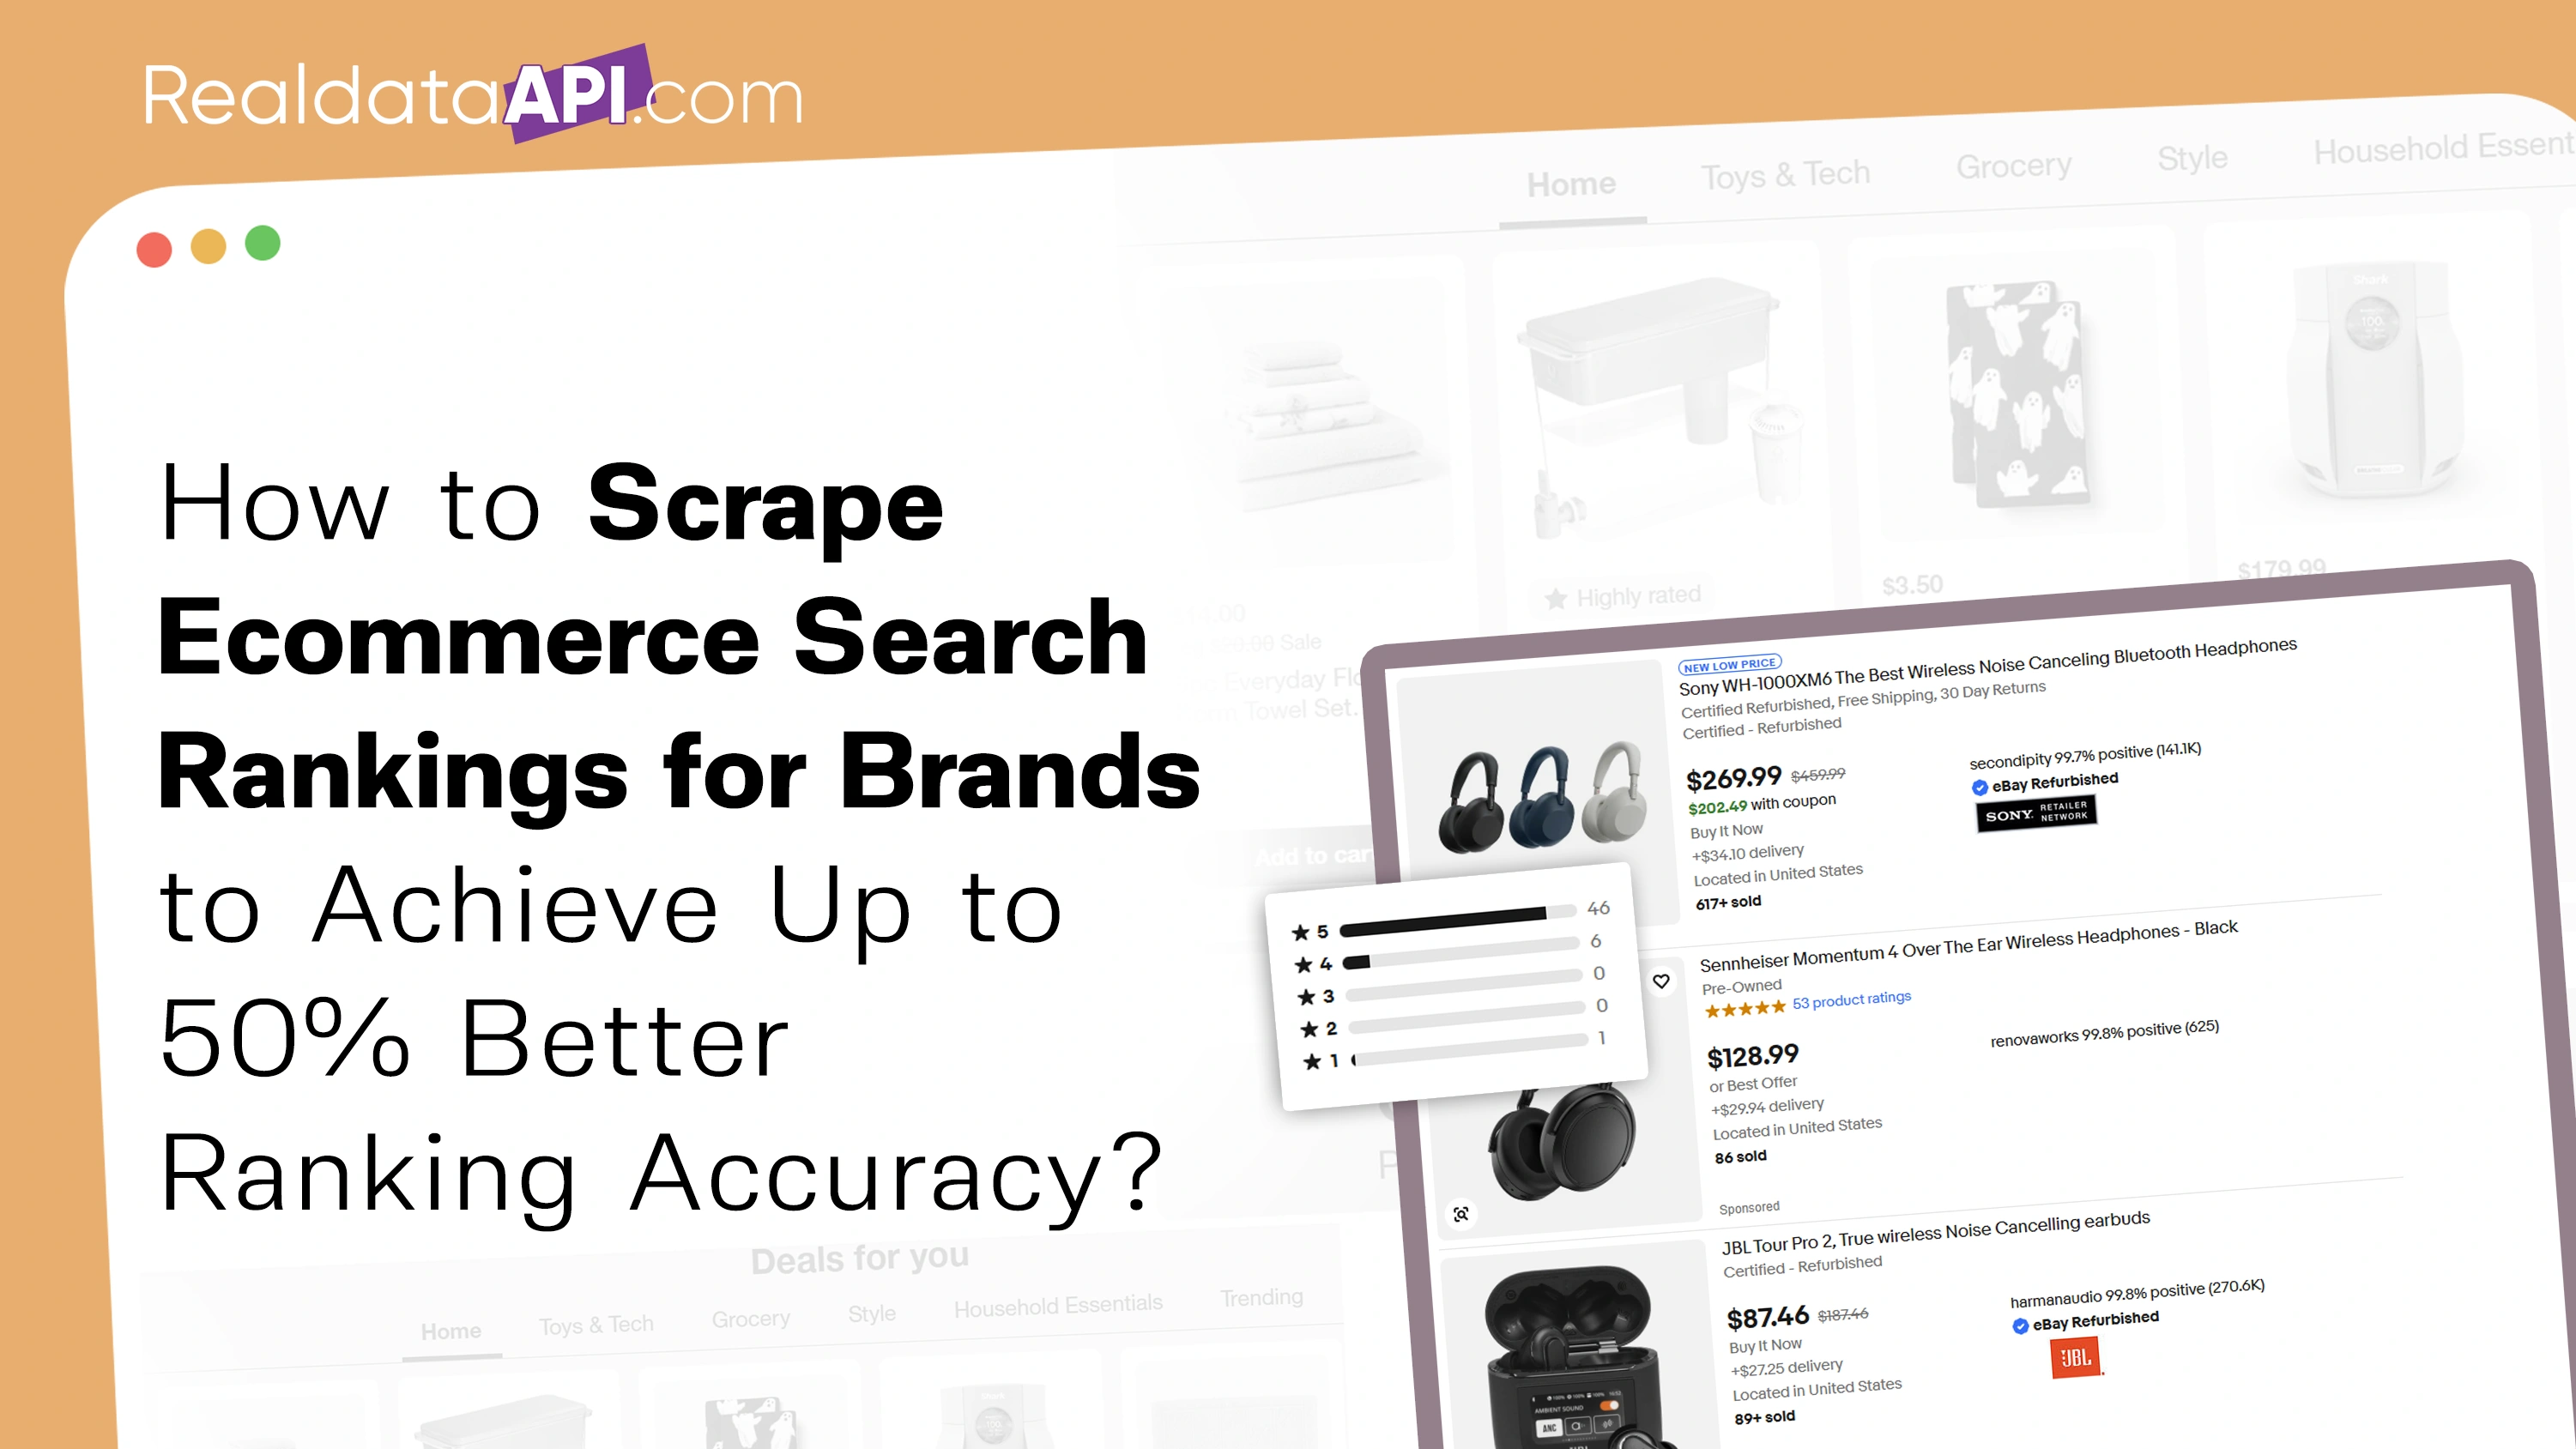
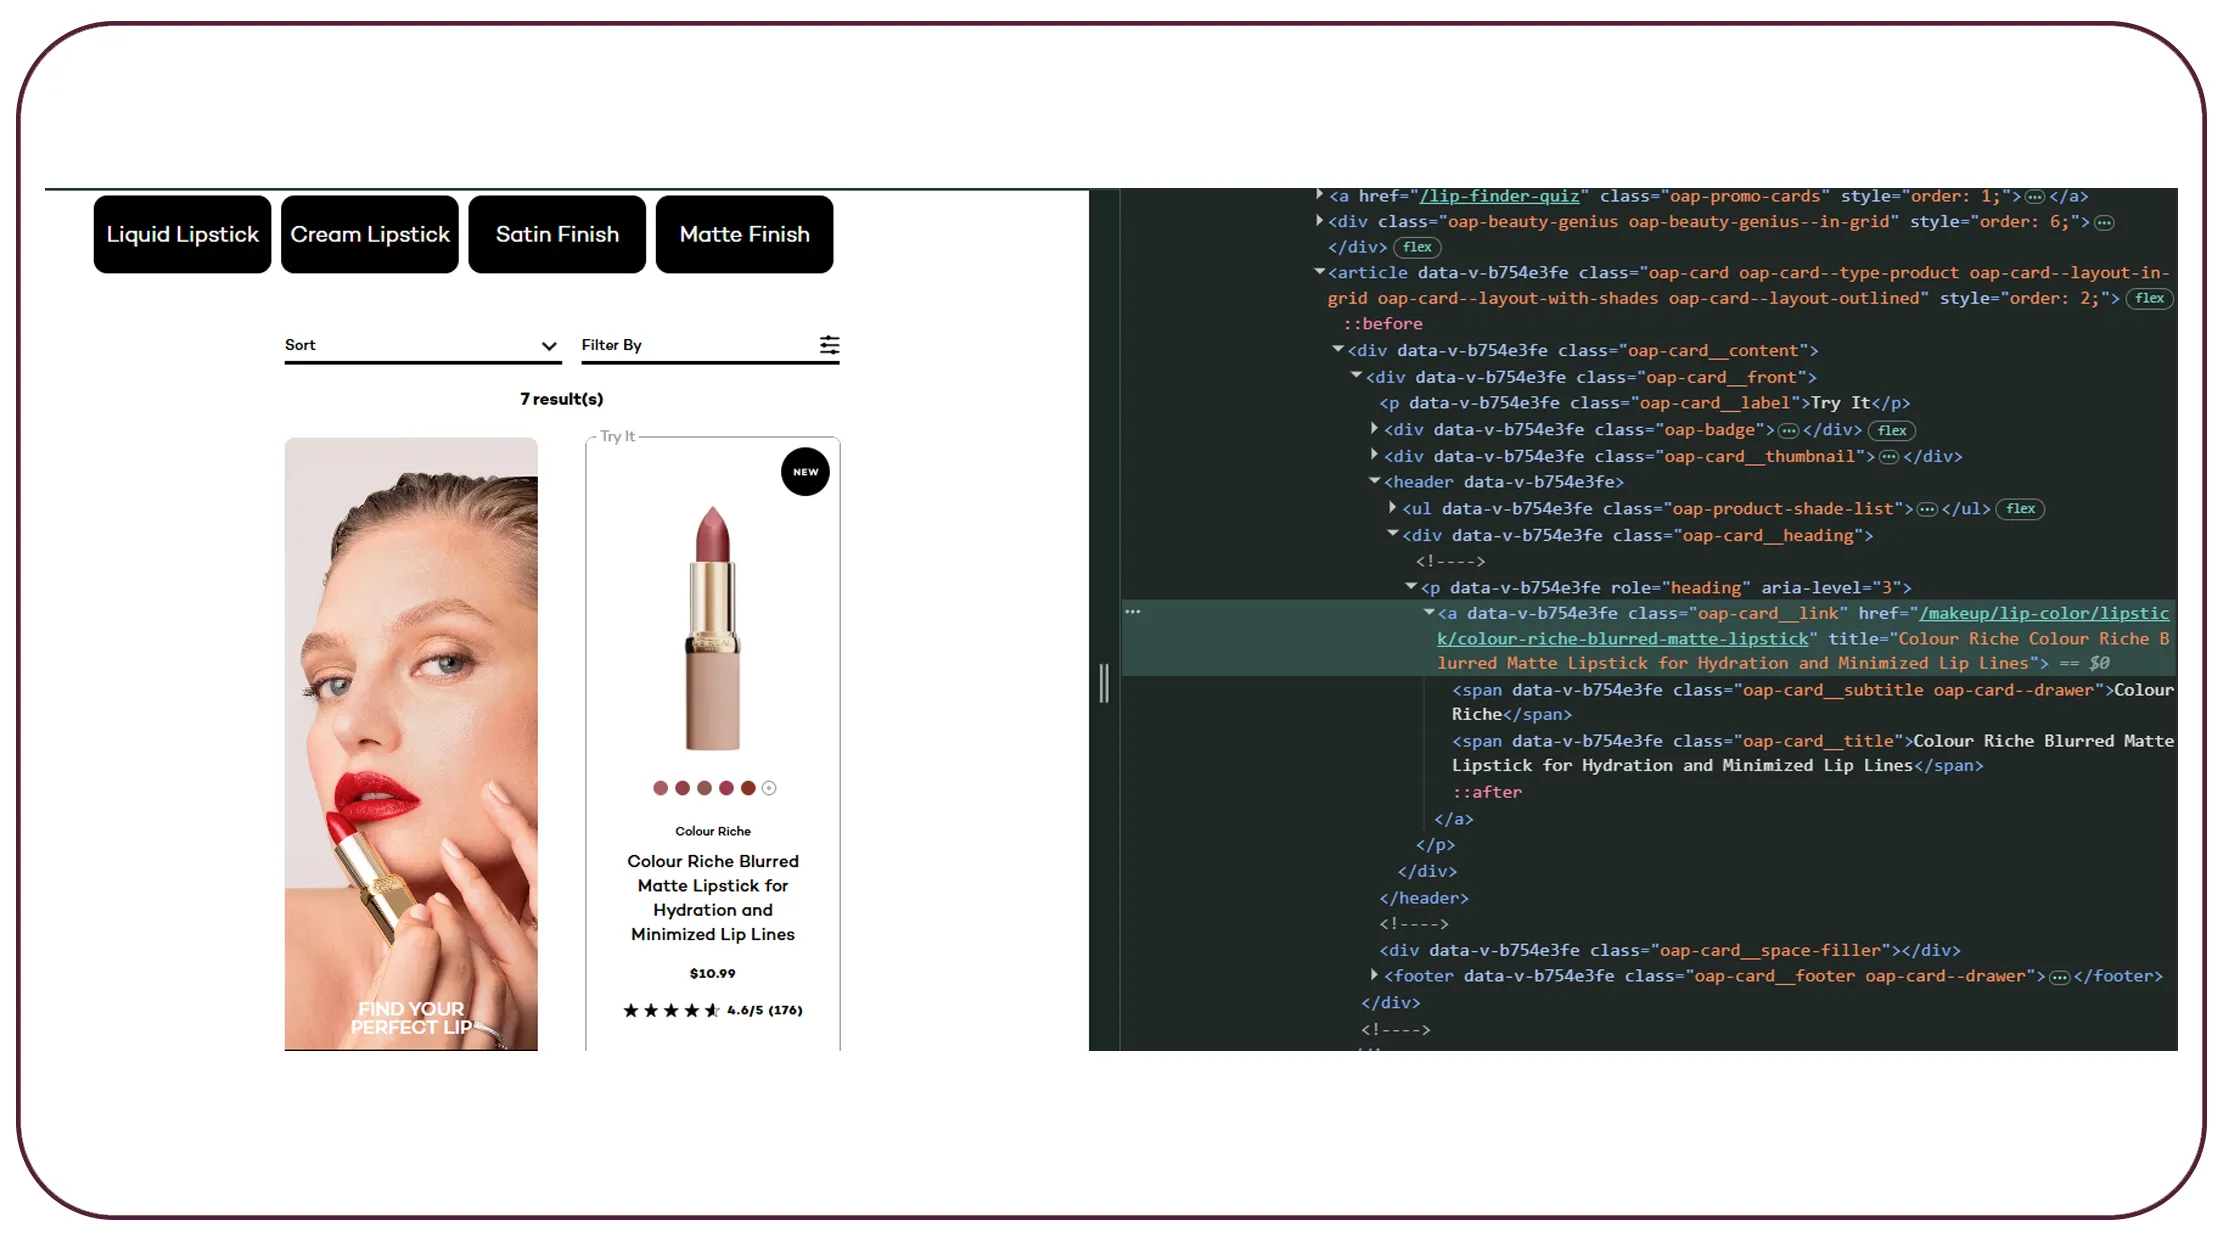
Today, companies use web scraping to analyze top 10 makeup brands in India to monitor pricing strategies, identify fast-selling products, evaluate consumer preferences, and track market positioning across multiple online channels. Using a scalable Web Scraping API, beauty brands can extract large volumes of ecommerce data in real time and transform raw product information into actionable business intelligence.
Brands can unlock insights such as:
- Real-time pricing trends
- Product demand forecasting
- Competitor discount monitoring
- Review sentiment analysis
- SKU expansion tracking
- Influencer campaign visibility
The top makeup brands analyzed throughout this blog include:
- Nykaa
- Maybelline
- L'Oreal Paris
- Lakme
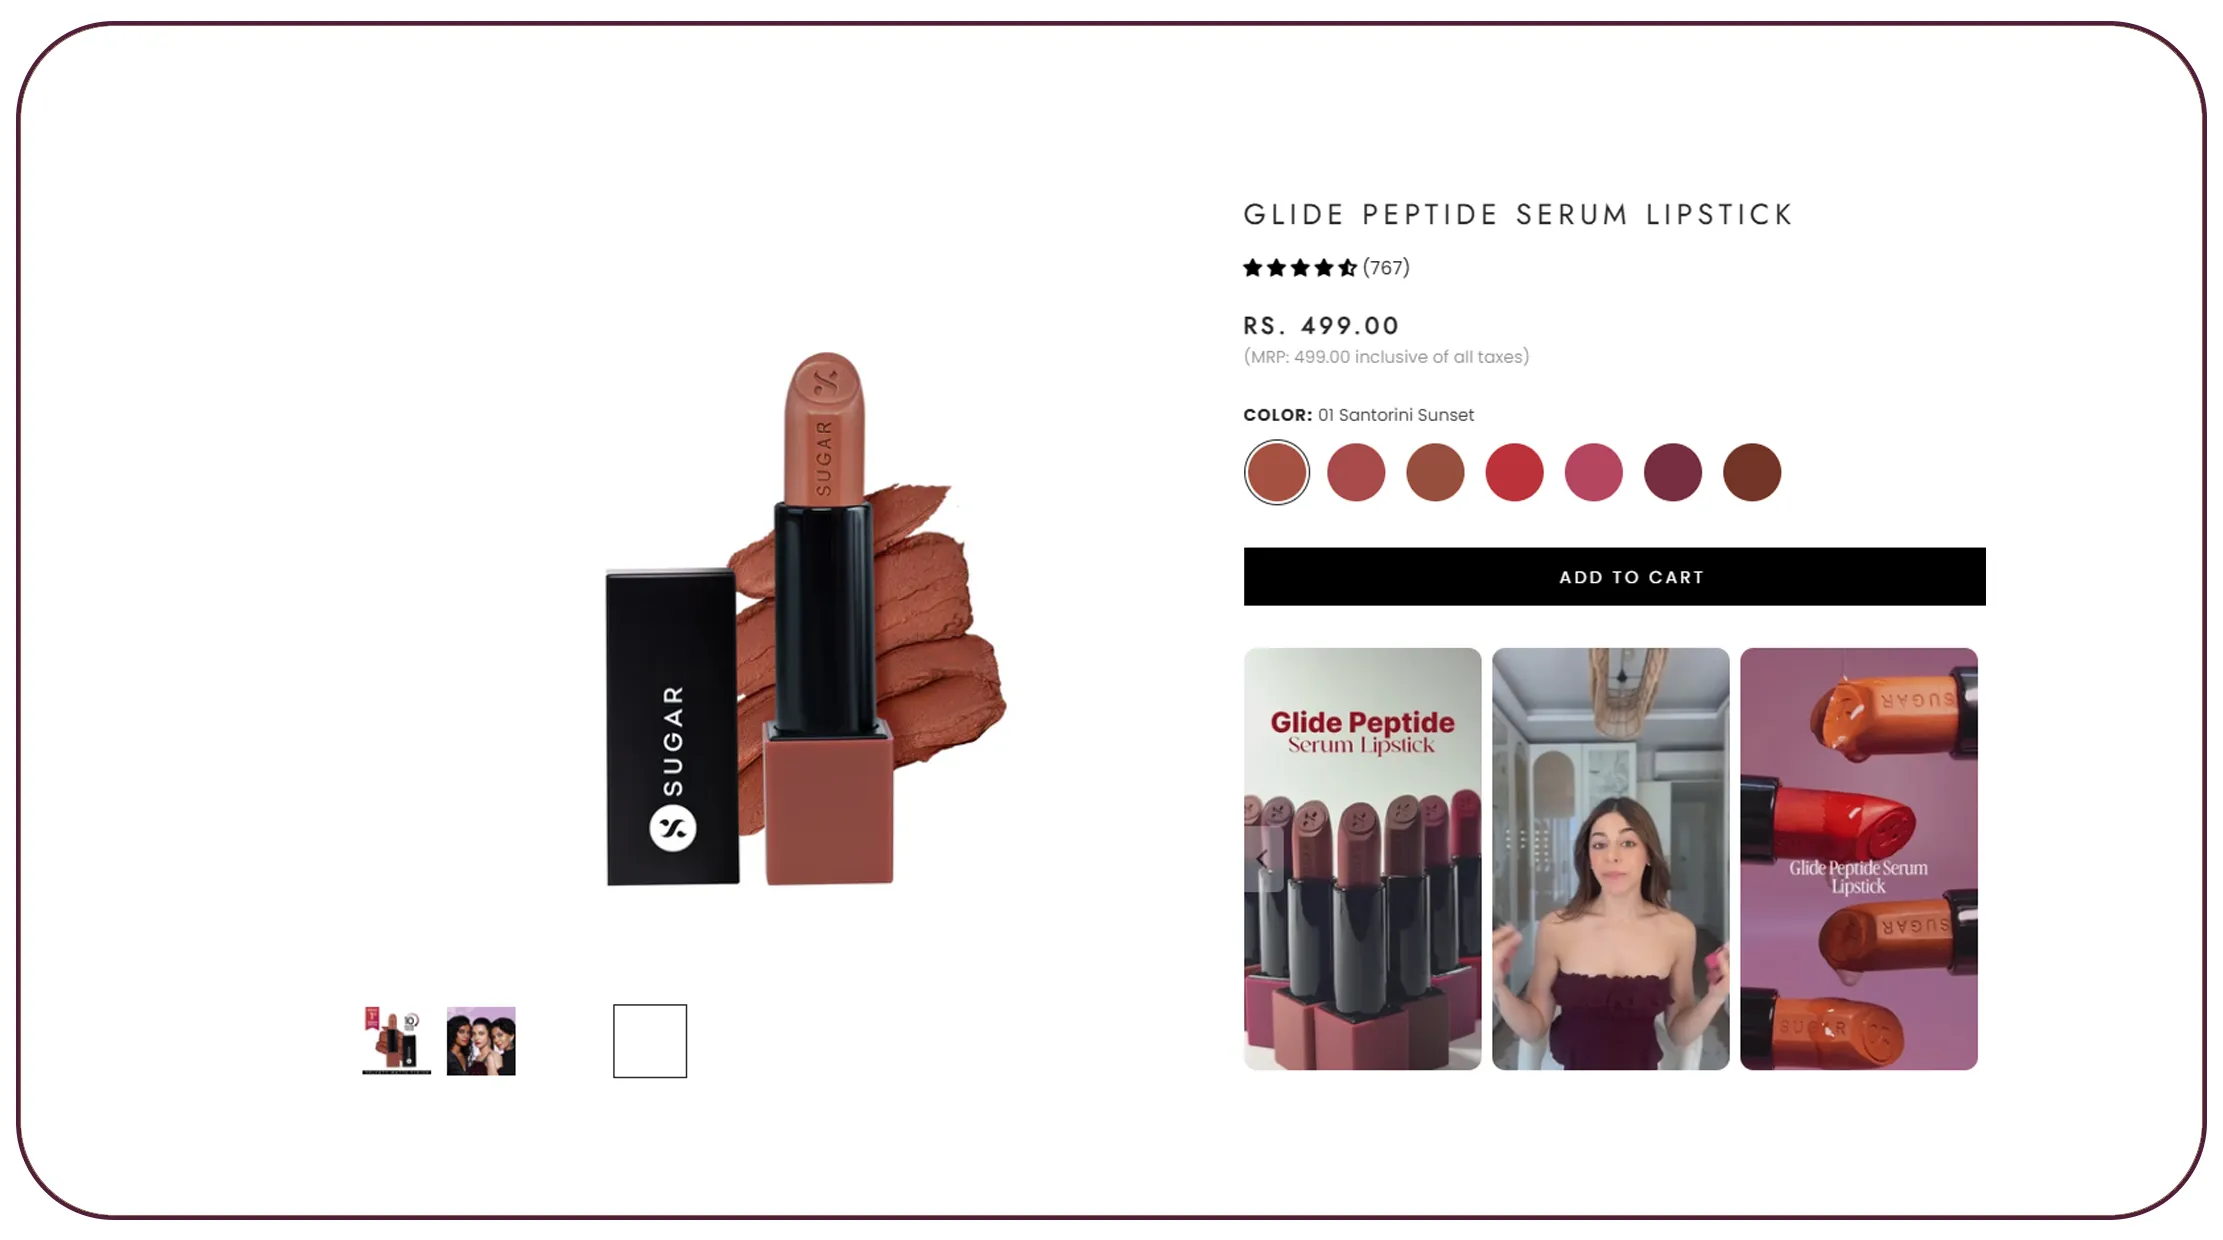
- Sugar Cosmetics
- Faces Canada
- Colorbar
- MAC
- Huda Beauty
- PAC
How Beauty Brands Use Retail Data Scraping to Predict Makeup Trends and Improve Sales Performance
The beauty industry changes rapidly due to shifting consumer preferences, influencer marketing, and seasonal demand spikes. Businesses increasingly rely on beauty product analytics using web scraping for Indian makeup brands to understand market dynamics and improve sales performance.
Beauty retailers analyze:
- Trending product categories
- Product launch frequency
- Marketplace pricing changes
- Consumer engagement
- Bestseller movement
These insights help brands forecast demand and optimize inventory management strategies across ecommerce channels.
Makeup Brand Performance Comparison
| Brand | Avg Monthly Searches | Bestseller Categories | Avg Marketplace Rating |
|---|---|---|---|
| Nykaa | 880K | Skincare, Lipsticks | 4.5 |
| Maybelline | 760K | Foundations, Mascara | 4.4 |
| L'Oreal Paris | 710K | Haircare, Makeup | 4.3 |
| Lakme | 690K | Face Makeup | 4.2 |
| Sugar Cosmetics | 620K | Lip Products | 4.4 |
| Faces Canada | 420K | Eye Makeup | 4.1 |
| Colorbar | 390K | Nail Products | 4.2 |
| MAC | 540K | Luxury Makeup | 4.6 |
| Huda Beauty | 510K | Premium Cosmetics | 4.5 |
| PAC | 280K | Professional Makeup | 4.3 |
Retailers use scraped ecommerce data to identify emerging beauty trends before competitors. This improves campaign planning, stock allocation, and digital marketing performance.
What Challenges Do Beauty Brands Face in Ecommerce Marketplaces?
The Indian beauty market faces increasing complexity due to marketplace competition and evolving consumer behavior. Businesses perform Indian beauty market trend analysis using cosmetic product data scraping to solve operational and marketing challenges.
Beauty brands face:
- SKU explosion
- Pricing wars
- Fake reviews
- Inventory mismatch
- Trend volatility
- Discount dependency
Between 2020 and 2026, ecommerce beauty catalogs expanded rapidly as brands launched new product variants and influencer-driven collections.
Ecommerce Marketplace Challenges
| Brand | SKU Count | Avg Discount Rate | Fake Review Risk | Inventory Complexity |
|---|---|---|---|---|
| Nykaa | 18,000 | 28% | Medium | High |
| Maybelline | 12,500 | 22% | Medium | High |
| L'Oreal Paris | 14,000 | 24% | Medium | High |
| Lakme | 10,800 | 20% | Low | Medium |
| Sugar Cosmetics | 8,900 | 31% | Medium | Medium |
| Faces Canada | 6,500 | 26% | Medium | Medium |
| Colorbar | 5,800 | 18% | Low | Medium |
| MAC | 4,400 | 12% | Low | Low |
| Huda Beauty | 4,900 | 15% | Medium | Low |
| PAC | 3,700 | 19% | Low | Medium |
Consumers increasingly compare products across marketplaces before purchasing. This creates omnichannel pricing pressure and forces brands to maintain consistent product information everywhere.
Brands that fail to track marketplace changes often experience lower customer trust and reduced conversion rates.
How Does Web Scraping Help Track Makeup Pricing and Promotions?
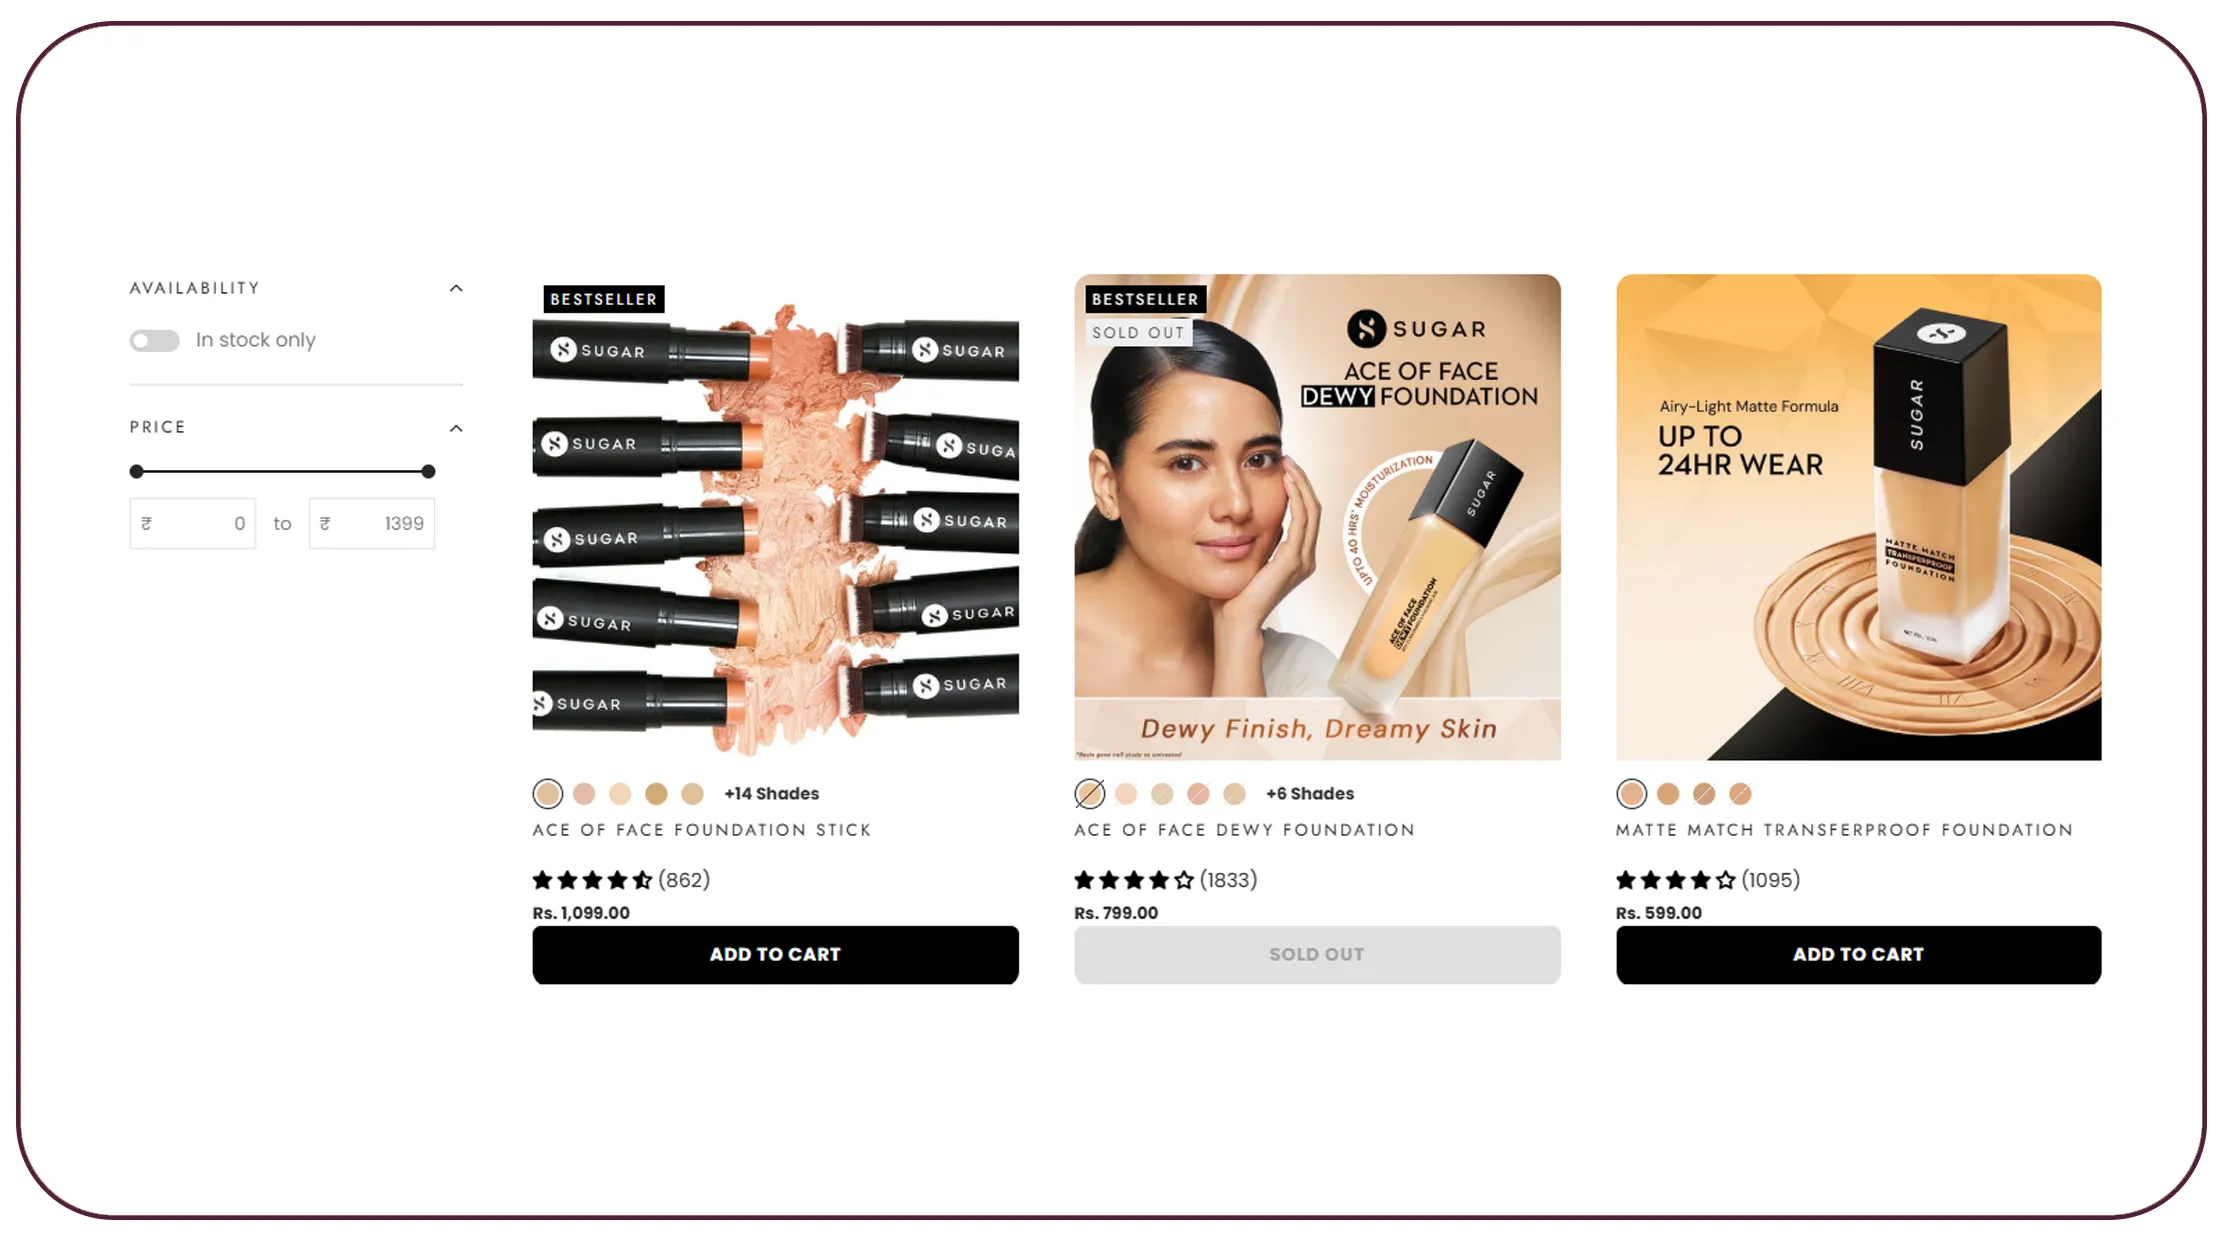
Beauty brands require real-time visibility into competitor pricing and promotional campaigns. Businesses use top makeup brand competitor analysis through web scraping to monitor discounts, flash sales, and pricing strategies across ecommerce platforms.
Web scraping helps brands track:
- Real-time pricing intelligence
- Bundle offers
- Seasonal campaigns
- Marketplace discounts
- Product launch promotions
Makeup Pricing and Promotion Analysis
| Brand | Avg Discount | Flash Sale Frequency | Marketplace Presence |
|---|---|---|---|
| Nykaa | 30% | High | Nykaa, Amazon, Flipkart |
| Maybelline | 24% | High | Amazon, Nykaa |
| L'Oreal Paris | 26% | Medium | Nykaa, Flipkart |
| Lakme | 21% | Medium | Amazon, Nykaa |
| Sugar Cosmetics | 34% | High | Nykaa, Amazon |
| Faces Canada | 28% | Medium | Flipkart, Amazon |
| Colorbar | 19% | Low | Nykaa |
| MAC | 12% | Low | Nykaa, Sephora |
| Huda Beauty | 16% | Medium | Nykaa |
| PAC | 18% | Low | Amazon |
Retailers use this intelligence to optimize discount timing and improve pricing competitiveness. Marketplace monitoring also helps brands avoid pricing inconsistencies across multiple platforms.
Brands that automate promotional tracking can respond faster to competitor campaigns and maximize ecommerce profitability.
Which Product Categories Are Growing Fastest in the Beauty Industry?
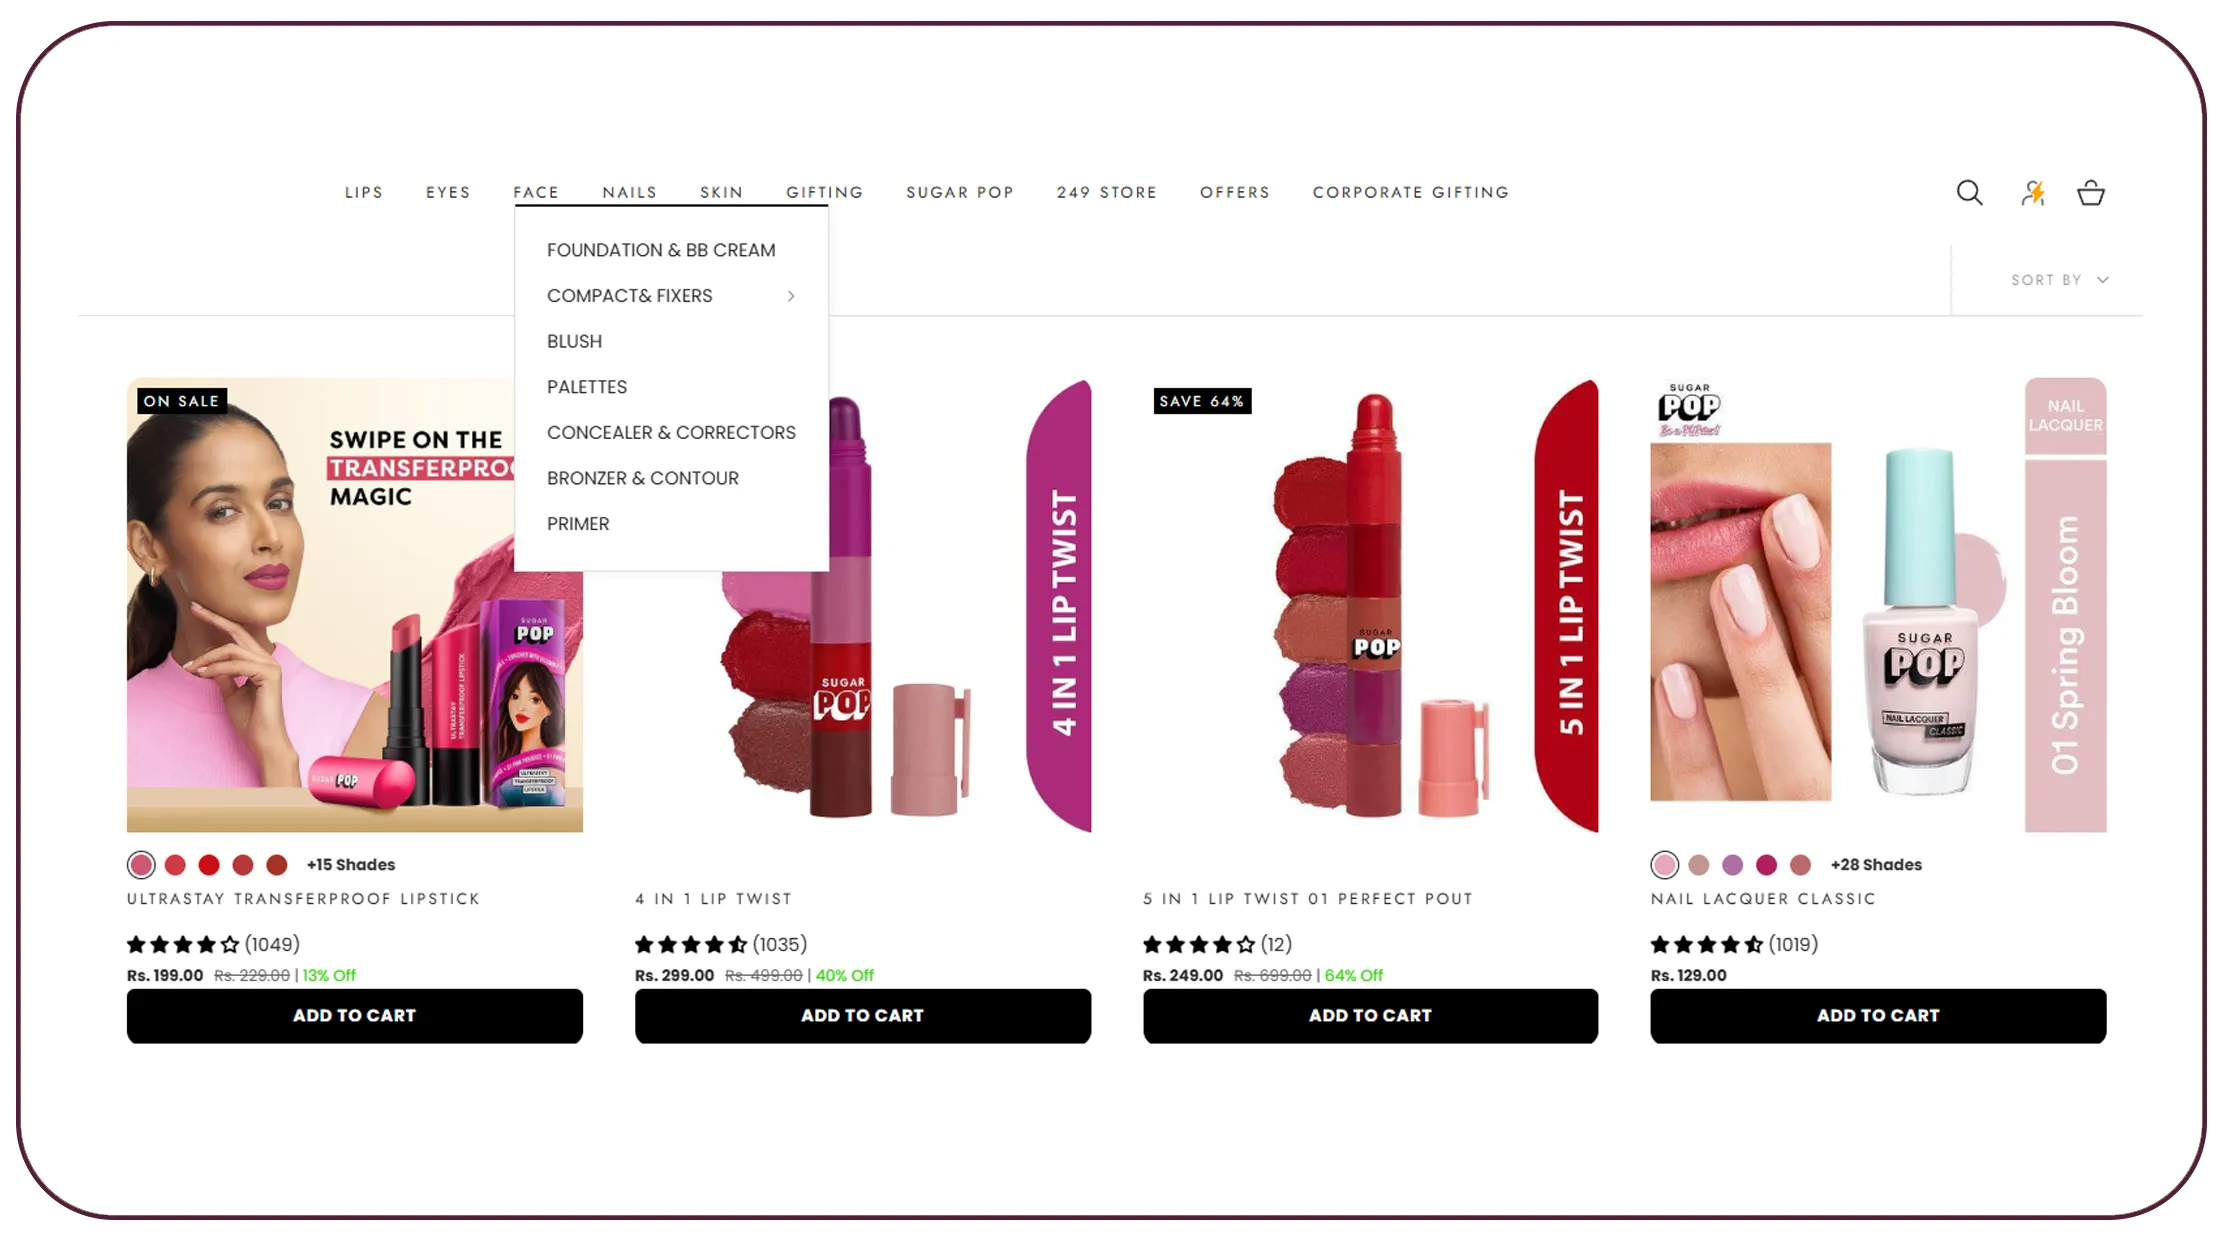
The Indian beauty industry continues expanding due to rising ecommerce adoption and changing consumer preferences. Businesses use data extraction tools to Scrape consumer buying trends in Indian beauty industry and identify fast-growing product segments.
The fastest-growing beauty categories include:
- Lip products
- Korean skincare
- Clean beauty
- Vegan cosmetics
- Men's grooming
- Luxury makeup
Beauty Category Growth Trends (2020–2026)
| Category | 2020 Growth | 2023 Growth | 2026 Projected Growth |
|---|---|---|---|
| Lip Products | 12% | 21% | 34% |
| Korean Skincare | 8% | 18% | 29% |
| Clean Beauty | 5% | 15% | 27% |
| Vegan Cosmetics | 4% | 14% | 25% |
| Men's Grooming | 9% | 19% | 31% |
| Luxury Makeup | 10% | 22% | 36% |
Brands use ecommerce trend analysis to identify emerging customer interests and optimize product launches accordingly.
For example:
- Nykaa expanded skincare collections
- Sugar Cosmetics increased vegan product offerings
- MAC strengthened premium makeup positioning
- Huda Beauty focused on influencer-driven launches
Trend forecasting allows businesses to improve inventory planning and reduce slow-moving stock.
How Do Consumer Reviews Influence Makeup Sales?
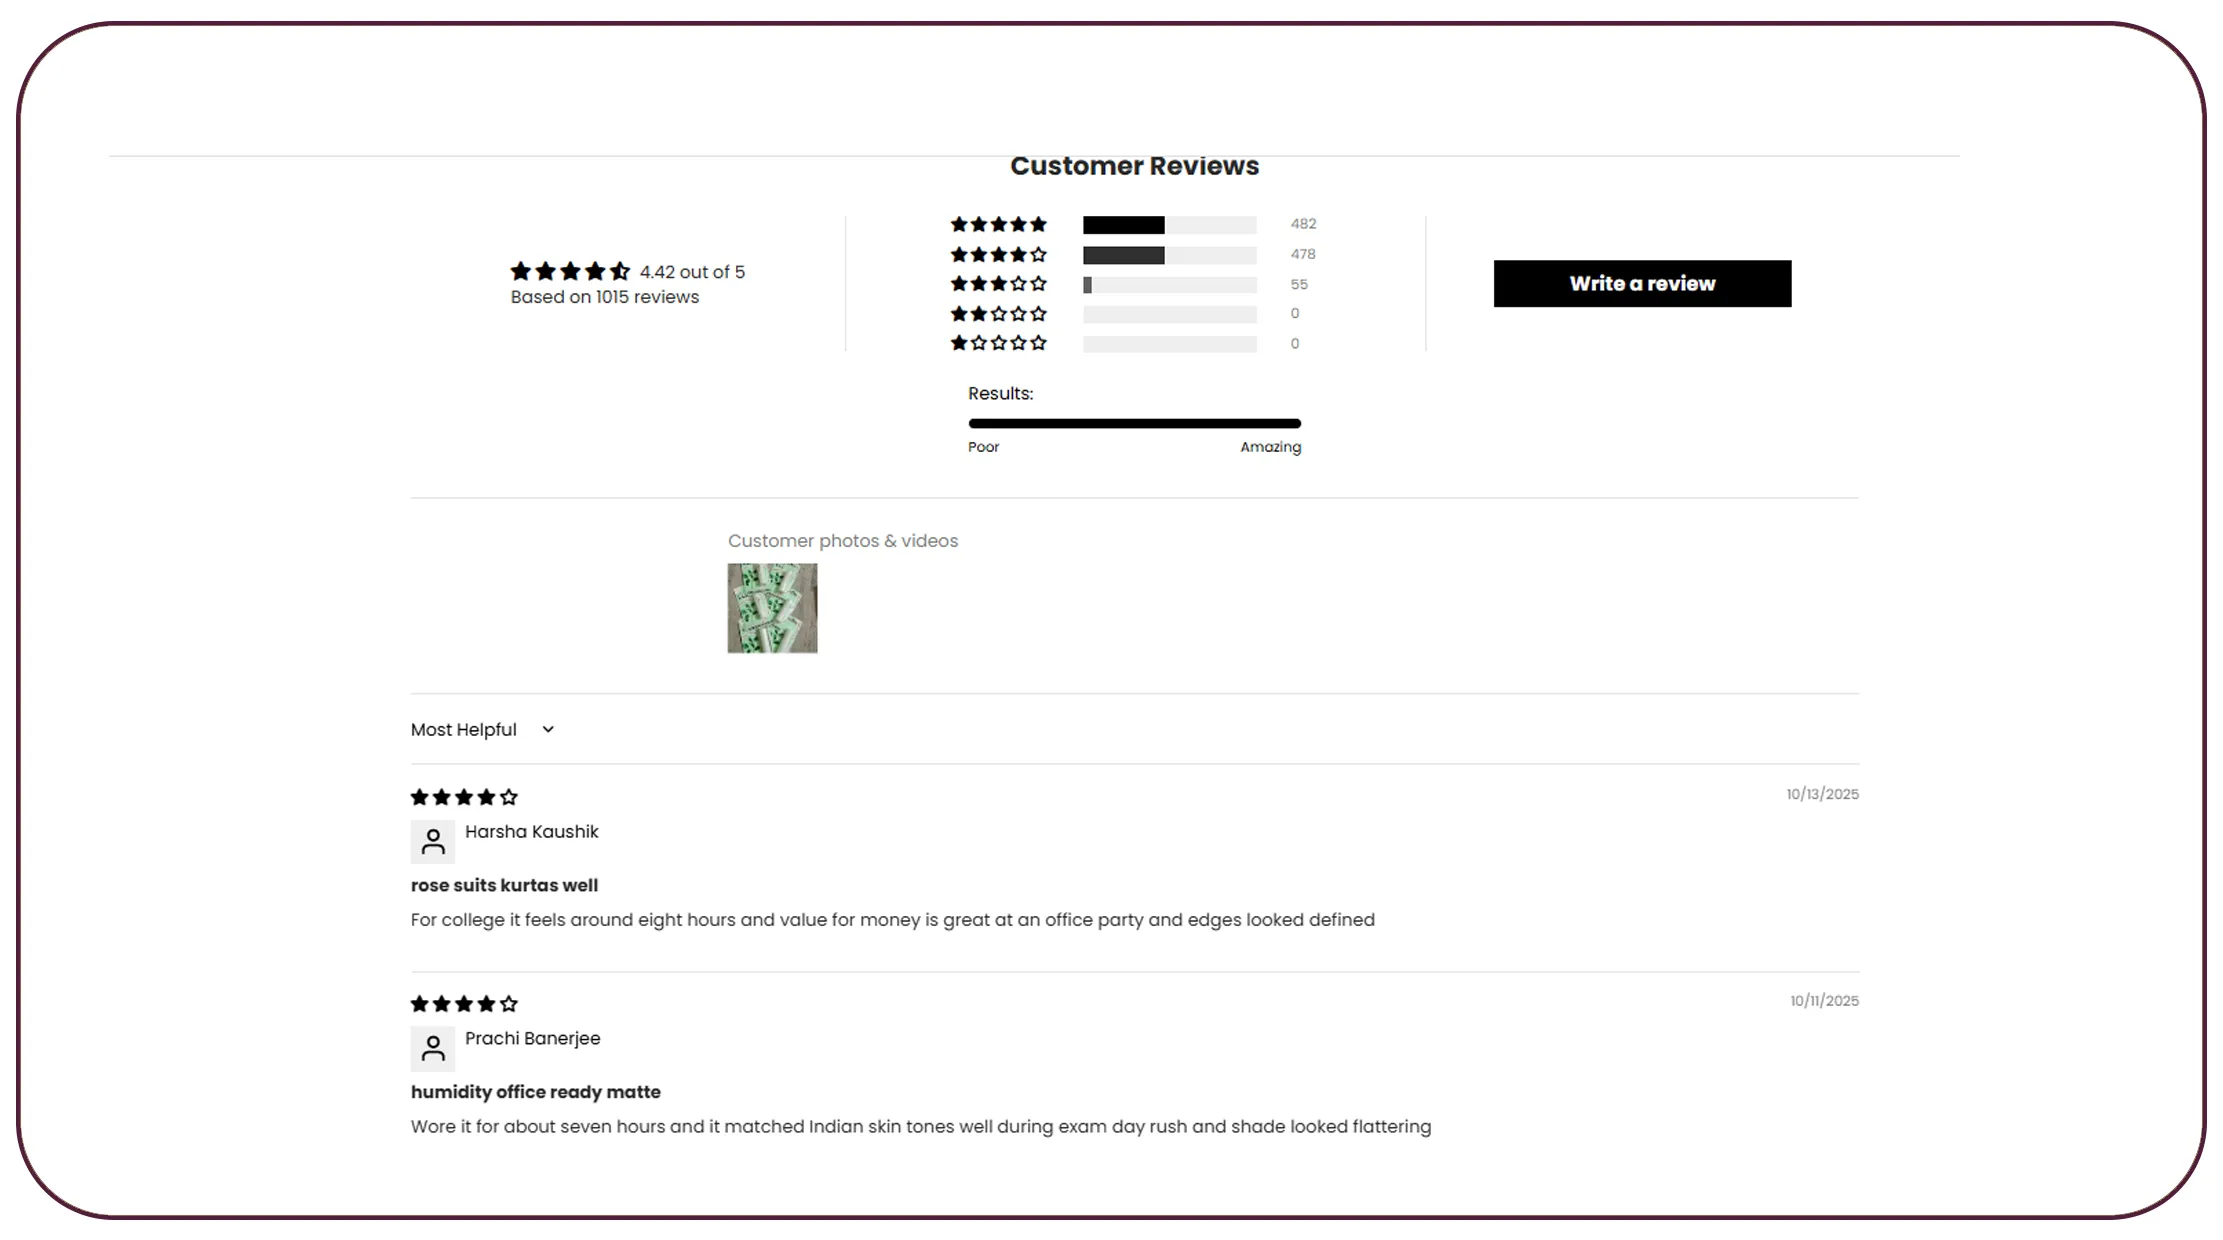
Online reviews strongly influence beauty purchasing decisions. Brands increasingly rely on Web Scraping Services to collect and analyze review sentiment across ecommerce platforms.
Businesses evaluate:
- Rating trends
- Sentiment analysis
- Influencer impact
- Review keywords
- Negative feedback clustering
Popular review keywords include:
- "long-lasting"
- "shade mismatch"
- "skin irritation"
Consumer Review Sentiment Analysis
| Brand | Avg Rating | Positive Sentiment | Negative Review Frequency |
|---|---|---|---|
| Nykaa | 4.5 | 82% | 9% |
| Maybelline | 4.4 | 79% | 11% |
| L'Oreal Paris | 4.3 | 77% | 13% |
| Lakme | 4.2 | 74% | 15% |
| Sugar Cosmetics | 4.4 | 81% | 10% |
| Faces Canada | 4.1 | 71% | 17% |
| Colorbar | 4.2 | 73% | 15% |
| MAC | 4.6 | 86% | 6% |
| Huda Beauty | 4.5 | 84% | 7% |
| PAC | 4.3 | 76% | 12% |
Review analysis helps brands identify product quality issues and improve customer satisfaction. Negative review clustering also helps businesses detect recurring complaints earlier.
Brands use influencer engagement metrics alongside review analytics to understand how creator campaigns impact product sentiment and sales performance.
How Can Brands Use Competitive Intelligence to Improve Market Share?
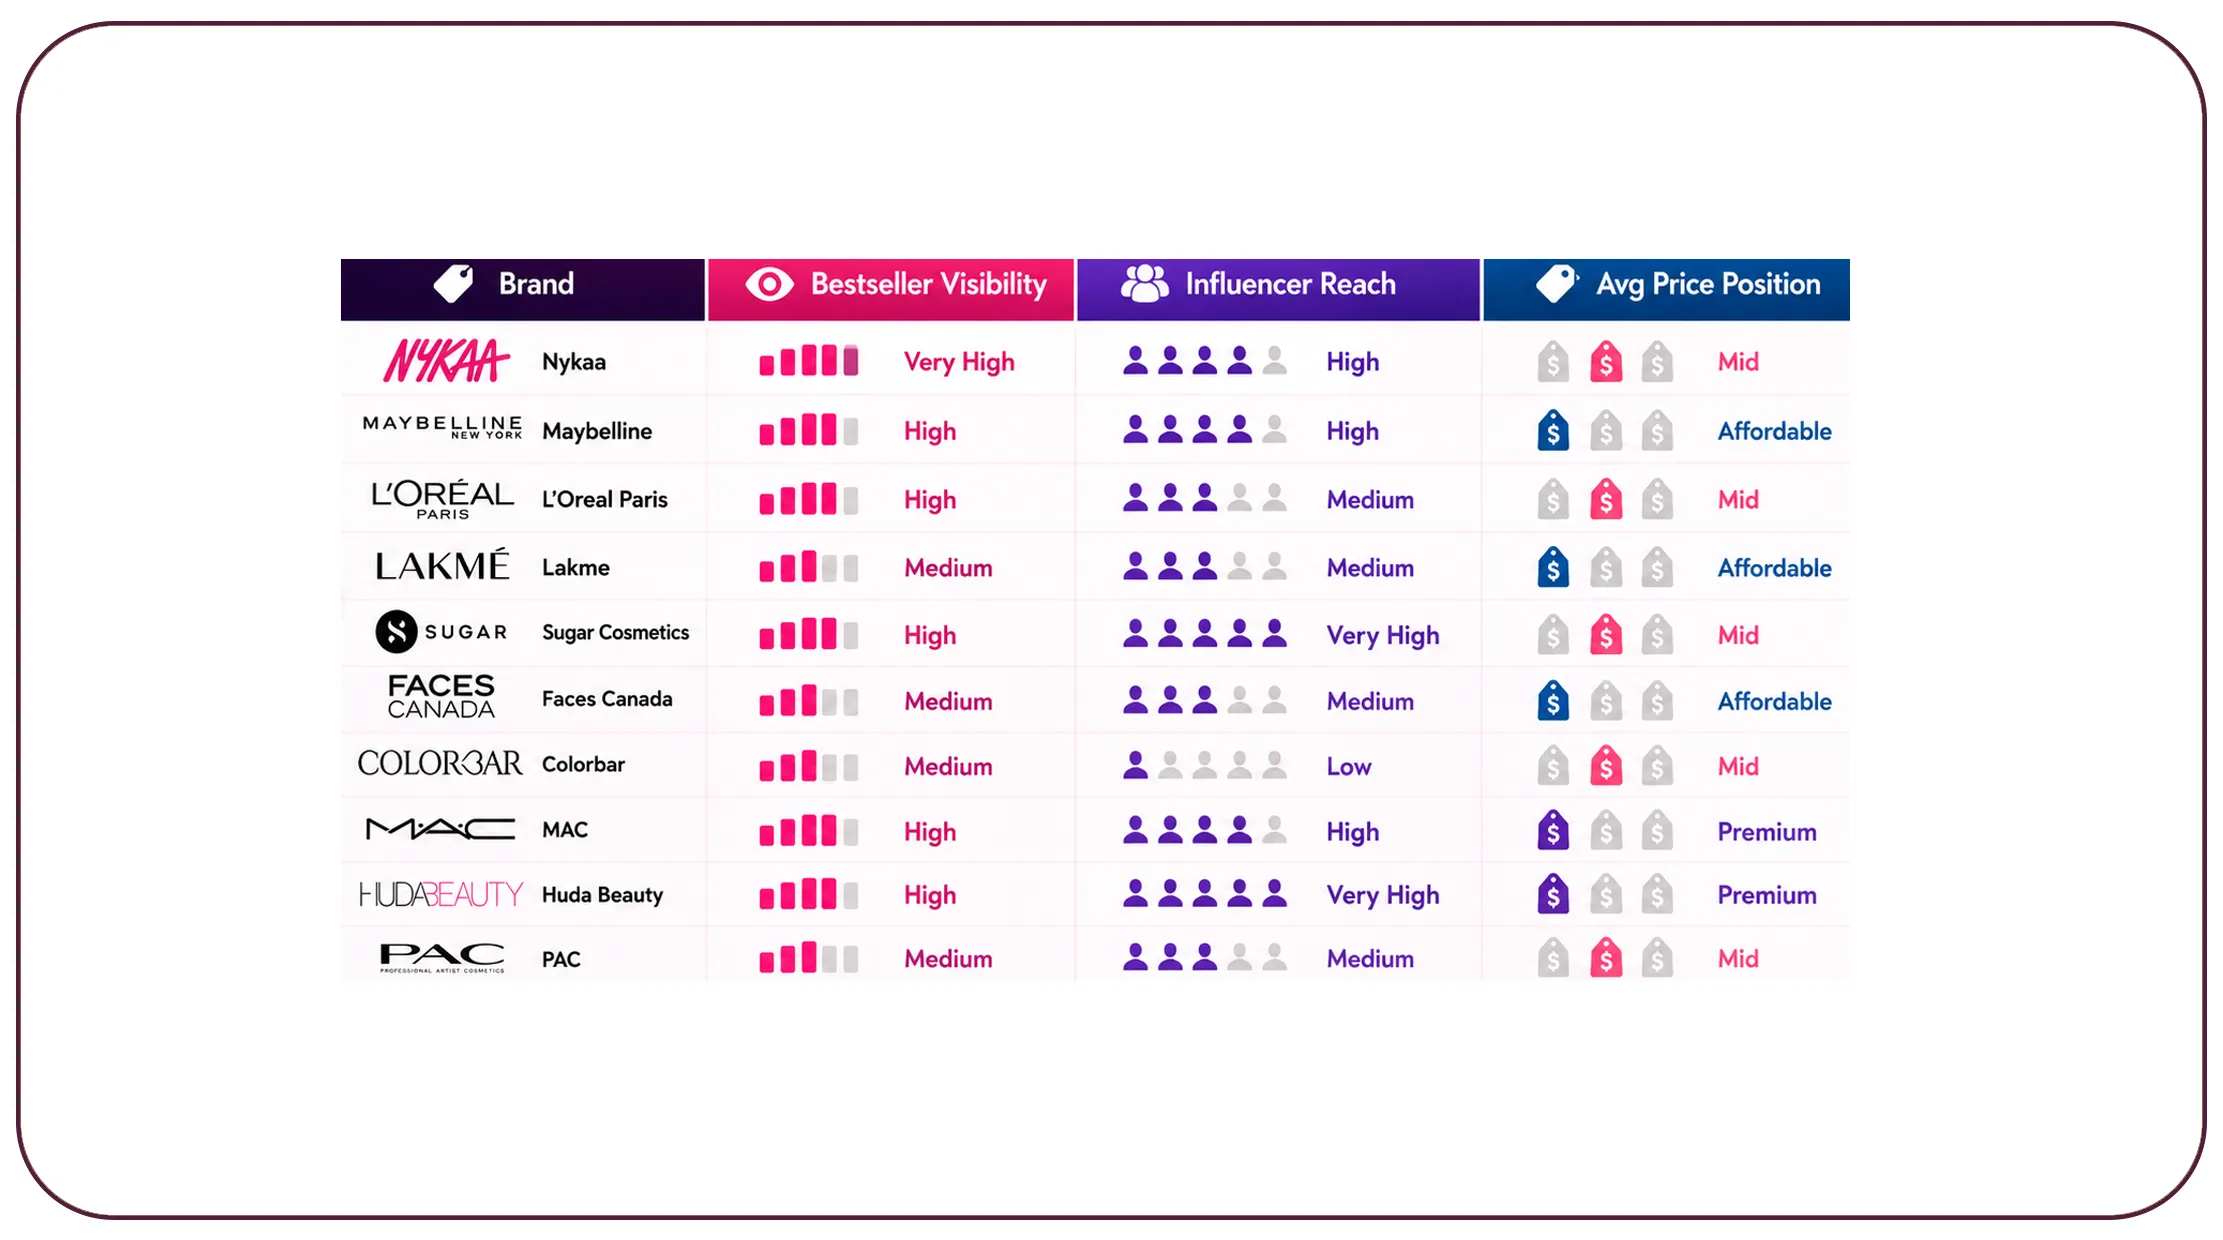
Competitive intelligence is now essential for ecommerce growth. Businesses use Fashion & Apparel Datasets combined with beauty marketplace data to benchmark competitors and optimize brand positioning.
Brands analyze:
- Competitor benchmarking
- Price positioning
- Bestseller tracking
- Product launch monitoring
- Influencer campaign tracking
Competitive Market Share Indicators
| Brand | Bestseller Visibility | Influencer Reach | Avg Price Position |
|---|---|---|---|
| Nykaa | Very High | High | Mid |
| Maybelline | High | High | Affordable |
| L'Oreal Paris | High | Medium | Mid |
| Lakme | Medium | Medium | Affordable |
| Sugar Cosmetics | High | Very High | Mid |
| Faces Canada | Medium | Medium | Affordable |
| Colorbar | Medium | Low | Mid |
| MAC | High | High | Premium |
| Huda Beauty | High | Very High | Premium |
| PAC | Medium | Medium | Mid |
Brands that continuously monitor competitors can quickly identify pricing gaps and emerging market opportunities.
Competitive benchmarking also supports:
- Smarter campaign planning
- Improved customer targeting
- Better product positioning
- Faster market response
How AI and Predictive Analytics Are Transforming Beauty Ecommerce
Artificial intelligence is rapidly changing ecommerce analytics. Businesses increasingly use Fashion Scraping API solutions combined with AI-powered analytics to automate trend forecasting and customer intelligence.
AI-driven beauty analytics supports:
- AI demand forecasting
- Trend prediction
- Generative AI product tagging
- Dynamic pricing
- Personalized recommendations
AI Adoption in Beauty Ecommerce (2020–2026)
| Brand | AI Recommendation Usage | Dynamic Pricing Adoption | Personalization Score |
|---|---|---|---|
| Nykaa | High | High | 89% |
| Maybelline | Medium | Medium | 81% | L'Oreal Paris | High | Medium | 84% |
| Lakme | Medium | Medium | 76% |
| Sugar Cosmetics | High | High | 87% |
| Faces Canada | Medium | Low | 72% |
| Colorbar | Low | Low | 68% |
| MAC | High | Medium | 85% |
| Huda Beauty | High | High | 90% |
| PAC | Medium | Low | 70% |
AI-powered analytics improves customer targeting and product recommendations while reducing manual workload for ecommerce teams.
Brands that adopt predictive analytics gain stronger forecasting accuracy and higher ecommerce conversion rates.
Which Hidden Metrics Reveal the True Competitive Position of Makeup Brands?
Modern beauty intelligence goes beyond pricing and discounts. Businesses use web scraping to analyze top 10 makeup brands in India to uncover deeper performance metrics that influence long-term market leadership.
Key intelligence metrics include:
Share-Of-Search
Share-of-search measures how often consumers search for a makeup brand compared to competitors across ecommerce platforms and search engines. Higher share-of-search usually indicates stronger brand awareness and future sales potential. Beauty brands use this metric to evaluate digital visibility, identify rising competitors, and optimize marketing campaigns for better customer acquisition and marketplace dominance.
Category Growth Velocity
Category growth velocity tracks how quickly specific beauty categories such as lipsticks, skincare, vegan cosmetics, or luxury makeup are expanding over time. Brands analyze this metric to identify fast-growing product segments and forecast future consumer demand. Faster category growth often signals emerging trends, helping businesses improve inventory planning and product launch strategies.
Sentiment Score
Sentiment score measures overall customer opinion by analyzing reviews, ratings, social media mentions, and influencer discussions. Positive sentiment usually reflects customer satisfaction and stronger purchase intent, while negative sentiment highlights product quality issues or customer dissatisfaction. Beauty brands use sentiment analysis to improve products, refine campaigns, and strengthen customer engagement strategies.
Out-of-Stock Frequency
Out-of-stock frequency measures how often products become unavailable across ecommerce platforms. Frequent stock shortages may indicate high demand, weak supply chain planning, or inaccurate forecasting. Beauty brands monitor this metric to improve inventory management, prevent lost sales opportunities, and ensure products remain consistently available during peak shopping periods and promotional campaigns.
Promotional Aggressiveness
Promotional aggressiveness evaluates how heavily brands rely on discounts, flash sales, coupon offers, and bundle promotions to drive sales. High promotional activity may increase short-term conversions but can reduce long-term profit margins and brand value. Businesses analyze this metric to benchmark competitor pricing strategies and optimize promotional planning more effectively.
SKU Expansion Rate
SKU expansion rate measures how quickly brands introduce new products, shades, bundles, or category variations into the market. Rapid SKU expansion helps brands capture emerging trends and target broader customer segments. However, excessive expansion may create inventory complexity and operational inefficiencies if product demand forecasting and catalog management are poorly optimized.
Cross-Marketplace Pricing Gaps
Cross-marketplace pricing gaps track price differences for the same product across platforms like Nykaa, Amazon, and Flipkart. Large pricing inconsistencies can confuse consumers and weaken brand trust. Beauty companies analyze these gaps to maintain pricing consistency, improve competitiveness, and prevent unauthorized sellers from disrupting marketplace pricing strategies.
Influencer Visibility Score
Influencer visibility score measures how frequently beauty brands appear in influencer content, social media campaigns, tutorials, and product recommendations. Higher visibility often increases consumer trust, engagement, and product discovery. Brands use this metric to evaluate influencer marketing effectiveness, optimize collaboration strategies, and identify creators driving the strongest ecommerce conversions.
Advanced Beauty Intelligence Metrics
| Brand | Share-of-Search | SKU Expansion Rate | Influencer Visibility Score |
|---|---|---|---|
| Nykaa | 21% | High | 88 |
| Maybelline | 18% | Medium | 81 |
| L'Oreal Paris | 16% | Medium | 79 |
| Lakme | 13% | Medium | 72 |
| Sugar Cosmetics | 14% | High | 91 |
| Faces Canada | 7% | Low | 63 |
| Colorbar | 5% | Low | 58 |
| MAC | 11% | Medium | 84 |
| Huda Beauty | 12% | High | 94 |
| PAC | 3% | Low | 55 |
These metrics help brands measure real competitive influence across ecommerce marketplaces.
Brands that monitor advanced intelligence indicators gain:
- Better forecasting accuracy
- Improved campaign effectiveness
- Faster market response
- Higher customer engagement
Why Choose Real Data API?
Real Data API helps businesses leverage web scraping to analyze top 10 makeup brands in India through scalable ecommerce intelligence and advanced marketplace analytics solutions.
Our solutions provide:
- Real-time pricing intelligence
- Consumer sentiment analysis
- Competitor benchmarking
- Product trend forecasting
- Ecommerce marketplace monitoring
- AI-powered beauty analytics
Businesses can transform raw ecommerce data into actionable insights that improve marketing performance, inventory planning, and customer engagement strategies.
Conclusion
The Indian beauty industry is becoming increasingly data-driven, and businesses using web scraping to analyze top 10 makeup brands in India gain significant advantages in pricing intelligence, trend forecasting, and competitive benchmarking.
As ecommerce competition grows across Nykaa, Amazon, and Flipkart, beauty brands that leverage scalable data extraction and AI-driven analytics will improve customer targeting, optimize product launches, and strengthen digital market positioning.
Want real-time beauty pricing intelligence, consumer sentiment analysis, and competitor tracking from marketplaces like Nykaa, Amazon, and Flipkart? Real Data API helps brands extract scalable ecommerce data for smarter beauty market decisions!
Latest posts

Web Scraping Competitor Product Monitoring Using Marketplace Data for Real-Time E-commerce Insights and Business Growth?
How to Scrape Product Intelligence Platform Using Marketplace Data to Help Brands Optimize Pricing, Inventory, and Product Strategy?
Why Companies scrape business data from Google Maps using keywords to Build Accurate Business Lists and Competitive Insights?
How Review scraping and monitoring services Help Businesses Track Customer Sentiment and Protect Brand Reputation in 2026?

How Real Estate Investment Insights Using RERA Data Scraping Help Investors Minimize Risk and Maximize Returns
Real Data API stands out as one of the premier global companies specializing in web data Scraping and web extraction.


Rating 4.7
Rating 4.7
Rating 4.5
Rating 4.7
Rating 4.7


Disclaimer : RealData API functions solely as an independent data infrastructure and technology solutions provider. We build customized automation workflows designed to collect publicly accessible web data based exclusively on client instructions. RealData API neither owns proprietary datasets nor engages in the sale or redistribution of extracted information. Our operations are limited strictly to lawful public web data processing and never involve unauthorized access to restricted systems or private networks. Any company names, trademarks, logos, or brand references displayed on this website are used purely for demonstrative and illustrative purposes to showcase our technical capabilities and do not imply endorsement, partnership, or affiliation. Use of our platform and services remains subject to our Terms of Service.