Introduction
Retailers are increasingly relying on data-driven technologies to improve pricing strategies, inventory management, customer engagement, and operational efficiency. One of the most effective approaches in 2026 is building grocery dashboards using Pick n Pay scraped data to gain real-time insights into grocery pricing, promotions, stock availability, and consumer purchasing behavior.
Modern retail businesses use automated scraping systems to collect structured data from online grocery platforms and delivery applications. With the help of the Pick n Pay ASAP! Quick Commerce Scraping API, companies can access high-frequency grocery data and transform it into visual dashboards for faster business intelligence and decision-making.
Interactive dashboards help retailers monitor competitor pricing, identify product demand trends, optimize promotional campaigns, and forecast inventory requirements more effectively. By combining automated extraction tools with visualization platforms, businesses can centralize grocery analytics into one scalable ecosystem.
As quick commerce and online grocery shopping continue to expand globally, retailers that leverage real-time grocery dashboards will gain stronger operational visibility, improved forecasting capabilities, and better competitive positioning in rapidly evolving digital retail markets.
Transforming Retail Operations with Smarter Visualization Systems
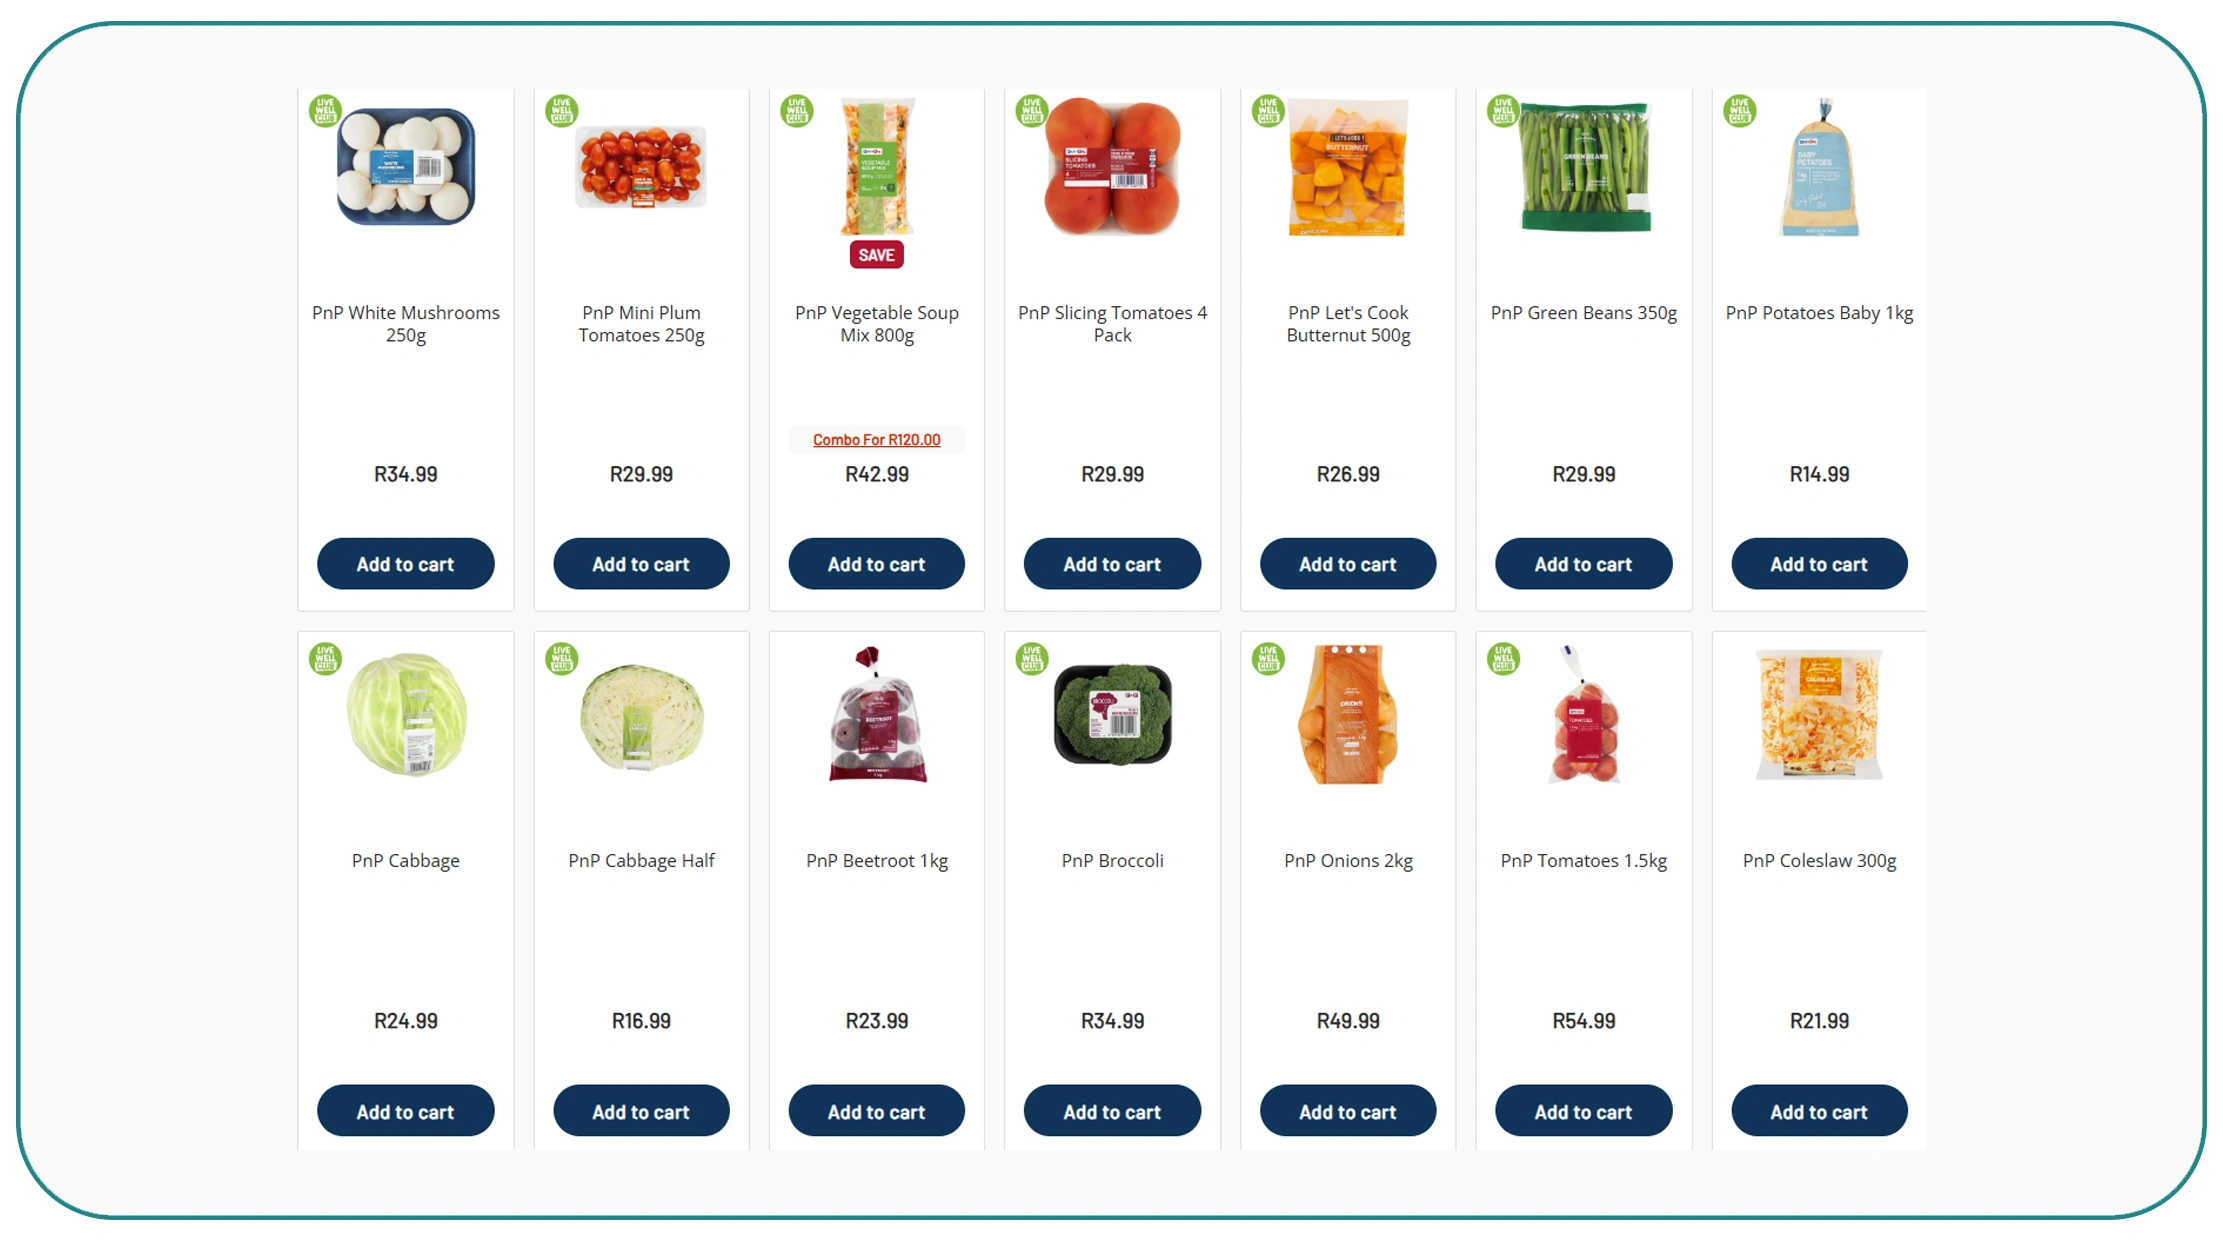
Retail businesses are rapidly adopting advanced dashboard technologies to centralize grocery insights and improve strategic planning. Organizations are now implementing grocery dashboard solutions powered by Pick n Pay supermarket data to monitor product pricing, discounts, customer demand, and inventory movements from a single interface.
Automated dashboards help retailers reduce manual reporting while improving data accuracy and operational speed. Teams can access real-time pricing analytics, promotional performance metrics, and category-level sales trends instantly. These insights support faster decision-making and improve coordination between procurement, sales, and marketing departments.
Retailers also use visualization tools to track regional pricing differences and monitor customer purchasing behavior more effectively. AI-powered dashboards convert large volumes of grocery data into easy-to-understand charts, heatmaps, and forecasting reports that simplify strategic analysis.
Grocery Dashboard Adoption Trends (2020–2026)
| Year | Retailers Using Grocery Dashboards | Improvement in Reporting Efficiency |
|---|---|---|
| 2020 | 26% | 21% |
| 2021 | 34% | 29% |
| 2022 | 43% | 38% |
| 2023 | 52% | 47% |
| 2024 | 62% | 56% |
| 2025 | 71% | 65% |
| 2026 | 81% | 74% |
Key benefits include:
- Centralized grocery analytics access
- Faster inventory tracking
- Better promotional performance monitoring
- Improved pricing visibility
- Enhanced operational collaboration
Retailers leveraging dashboard solutions gain more control over business performance while improving customer responsiveness and pricing accuracy.
Accelerating Pricing Intelligence Through Automation
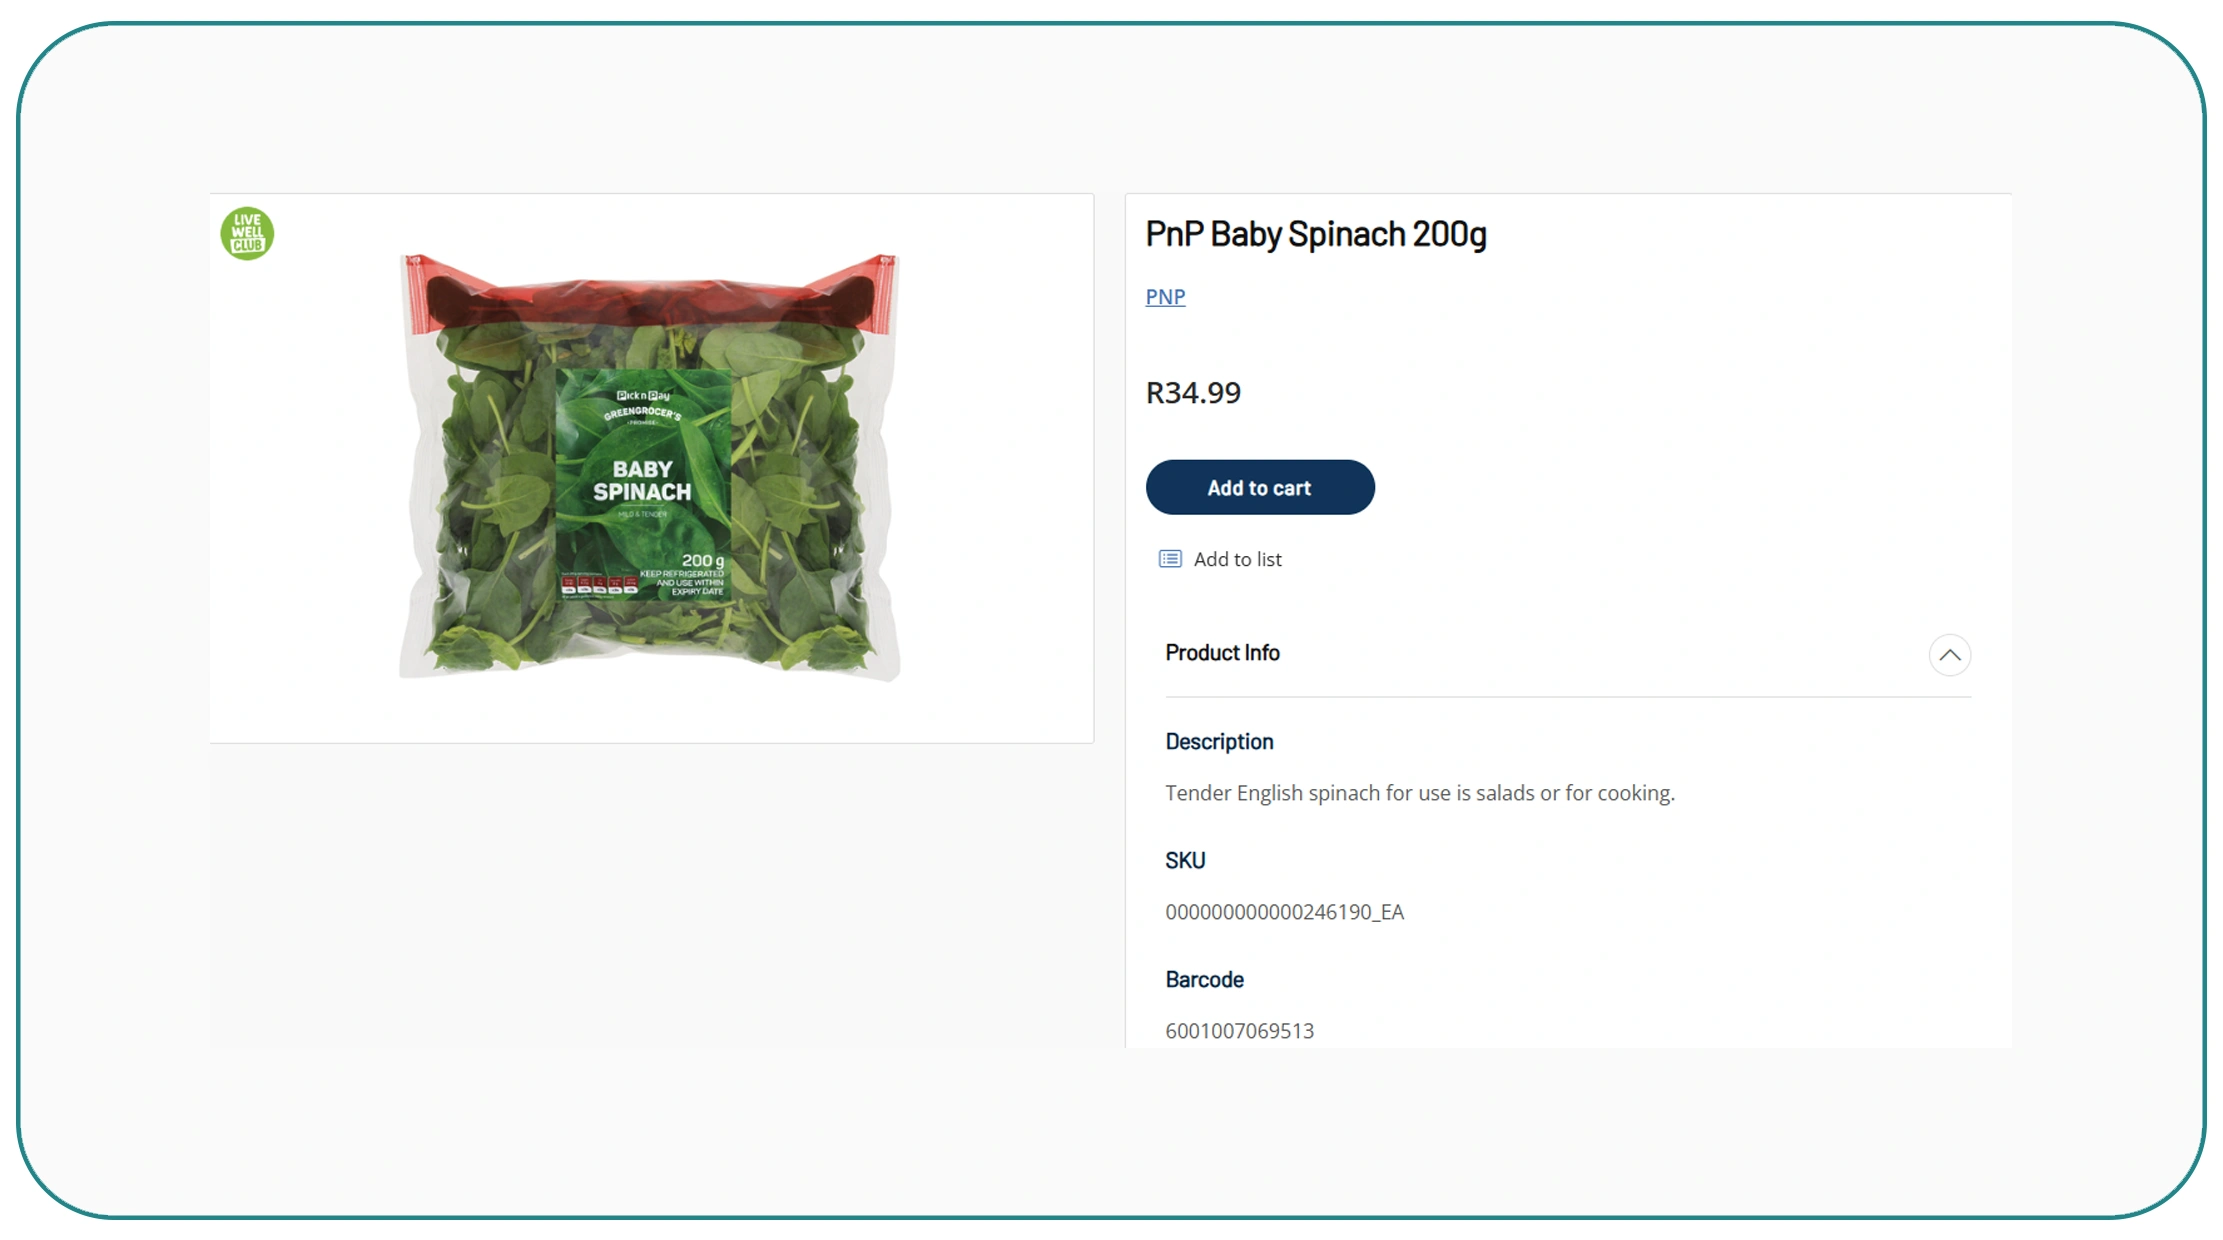
Real-time pricing visibility has become essential in highly competitive grocery markets. Businesses now depend on Real-time supermarket price monitoring with Pick n Pay data scraping to capture pricing fluctuations, promotional updates, and stock availability across digital retail channels.
Automated price monitoring tools collect grocery data continuously, allowing retailers to react instantly to market changes. This helps businesses improve dynamic pricing strategies, optimize margins, and strengthen customer retention. Real-time alerts also notify decision-makers when competitors change prices or launch promotions.
Retailers can compare pricing performance across multiple product categories and locations using interactive dashboards. This enables more accurate benchmarking and supports data-driven promotional planning.
Automation significantly reduces the need for manual price checks while improving the consistency and speed of data collection. Retailers can also monitor inflation impacts and identify high-demand products more efficiently.
Supermarket Price Monitoring Statistics (2020–2026)
| Year | Retailers Using Real-Time Price Monitoring | Increase in Pricing Accuracy |
|---|---|---|
| 2020 | 28% | 22% |
| 2021 | 36% | 31% |
| 2022 | 45% | 40% |
| 2023 | 54% | 49% |
| 2024 | 63% | 58% |
| 2025 | 72% | 67% |
| 2026 | 82% | 76% |
Major advantages include:
- Real-time competitor price tracking
- Faster promotional optimization
- Improved pricing consistency
- Better inflation analysis
- Enhanced margin management
Retailers using automated pricing intelligence systems improve operational agility and respond more effectively to changing market conditions.
Understanding Consumer Demand Through Advanced Trend Analytics
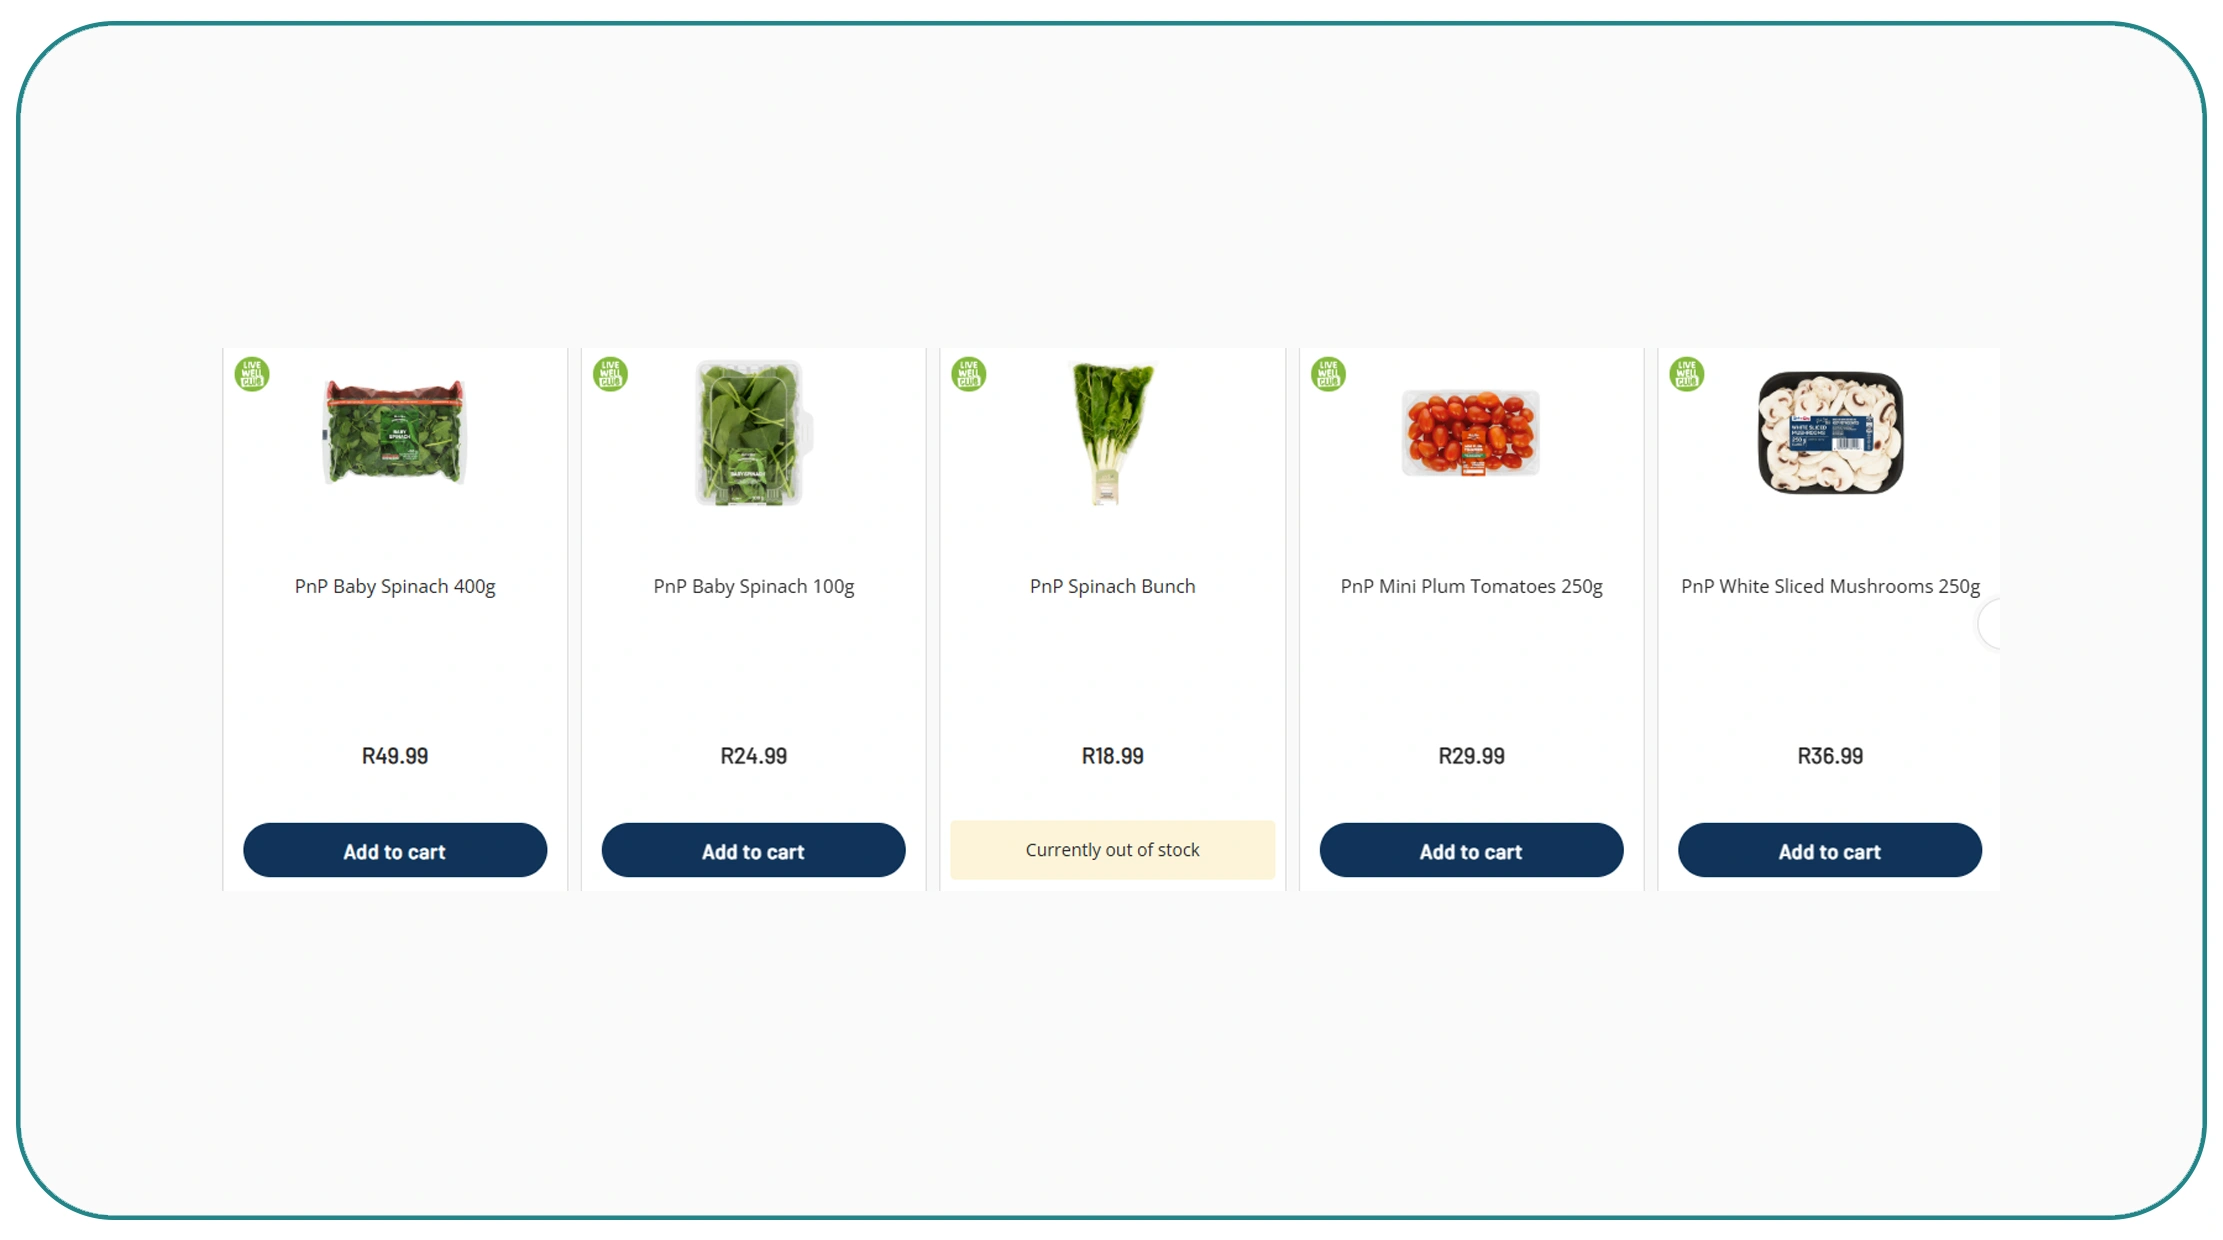
Consumer buying behavior changes rapidly due to seasonal demand, inflation, promotions, and market trends. Retailers increasingly use FMCG and grocery trend monitoring using Pick n Pay data extraction to identify purchasing patterns and optimize product strategies.
Automated trend analytics tools collect data related to product availability, sales trends, category demand, and promotional activity. Retailers can analyze this information through dashboards to identify high-performing products and anticipate future customer demand more accurately.
Trend monitoring also helps businesses optimize inventory allocation and reduce stock shortages. Retailers can forecast peak demand periods and improve supply chain efficiency using historical and real-time grocery data.
Machine learning algorithms further enhance analytics by identifying hidden patterns and customer preferences. Businesses can use these insights to improve category management, launch targeted promotions, and enhance customer experience.
Grocery Trend Monitoring Growth (2020–2026)
| Year | Retailers Using Trend Monitoring | Improvement in Demand Forecasting |
|---|---|---|
| 2020 | 24% | 20% |
| 2021 | 33% | 28% |
| 2022 | 42% | 37% |
| 2023 | 51% | 46% |
| 2024 | 61% | 56% |
| 2025 | 71% | 66% |
| 2026 | 81% | 75% |
Key business benefits include:
- Better product demand forecasting
- Improved inventory planning
- Enhanced customer trend analysis
- Faster category optimization
- Reduced stock shortages
Retailers that invest in advanced trend analytics gain stronger visibility into consumer behavior and evolving market conditions.
Centralizing Structured Retail Information for Smarter Decisions
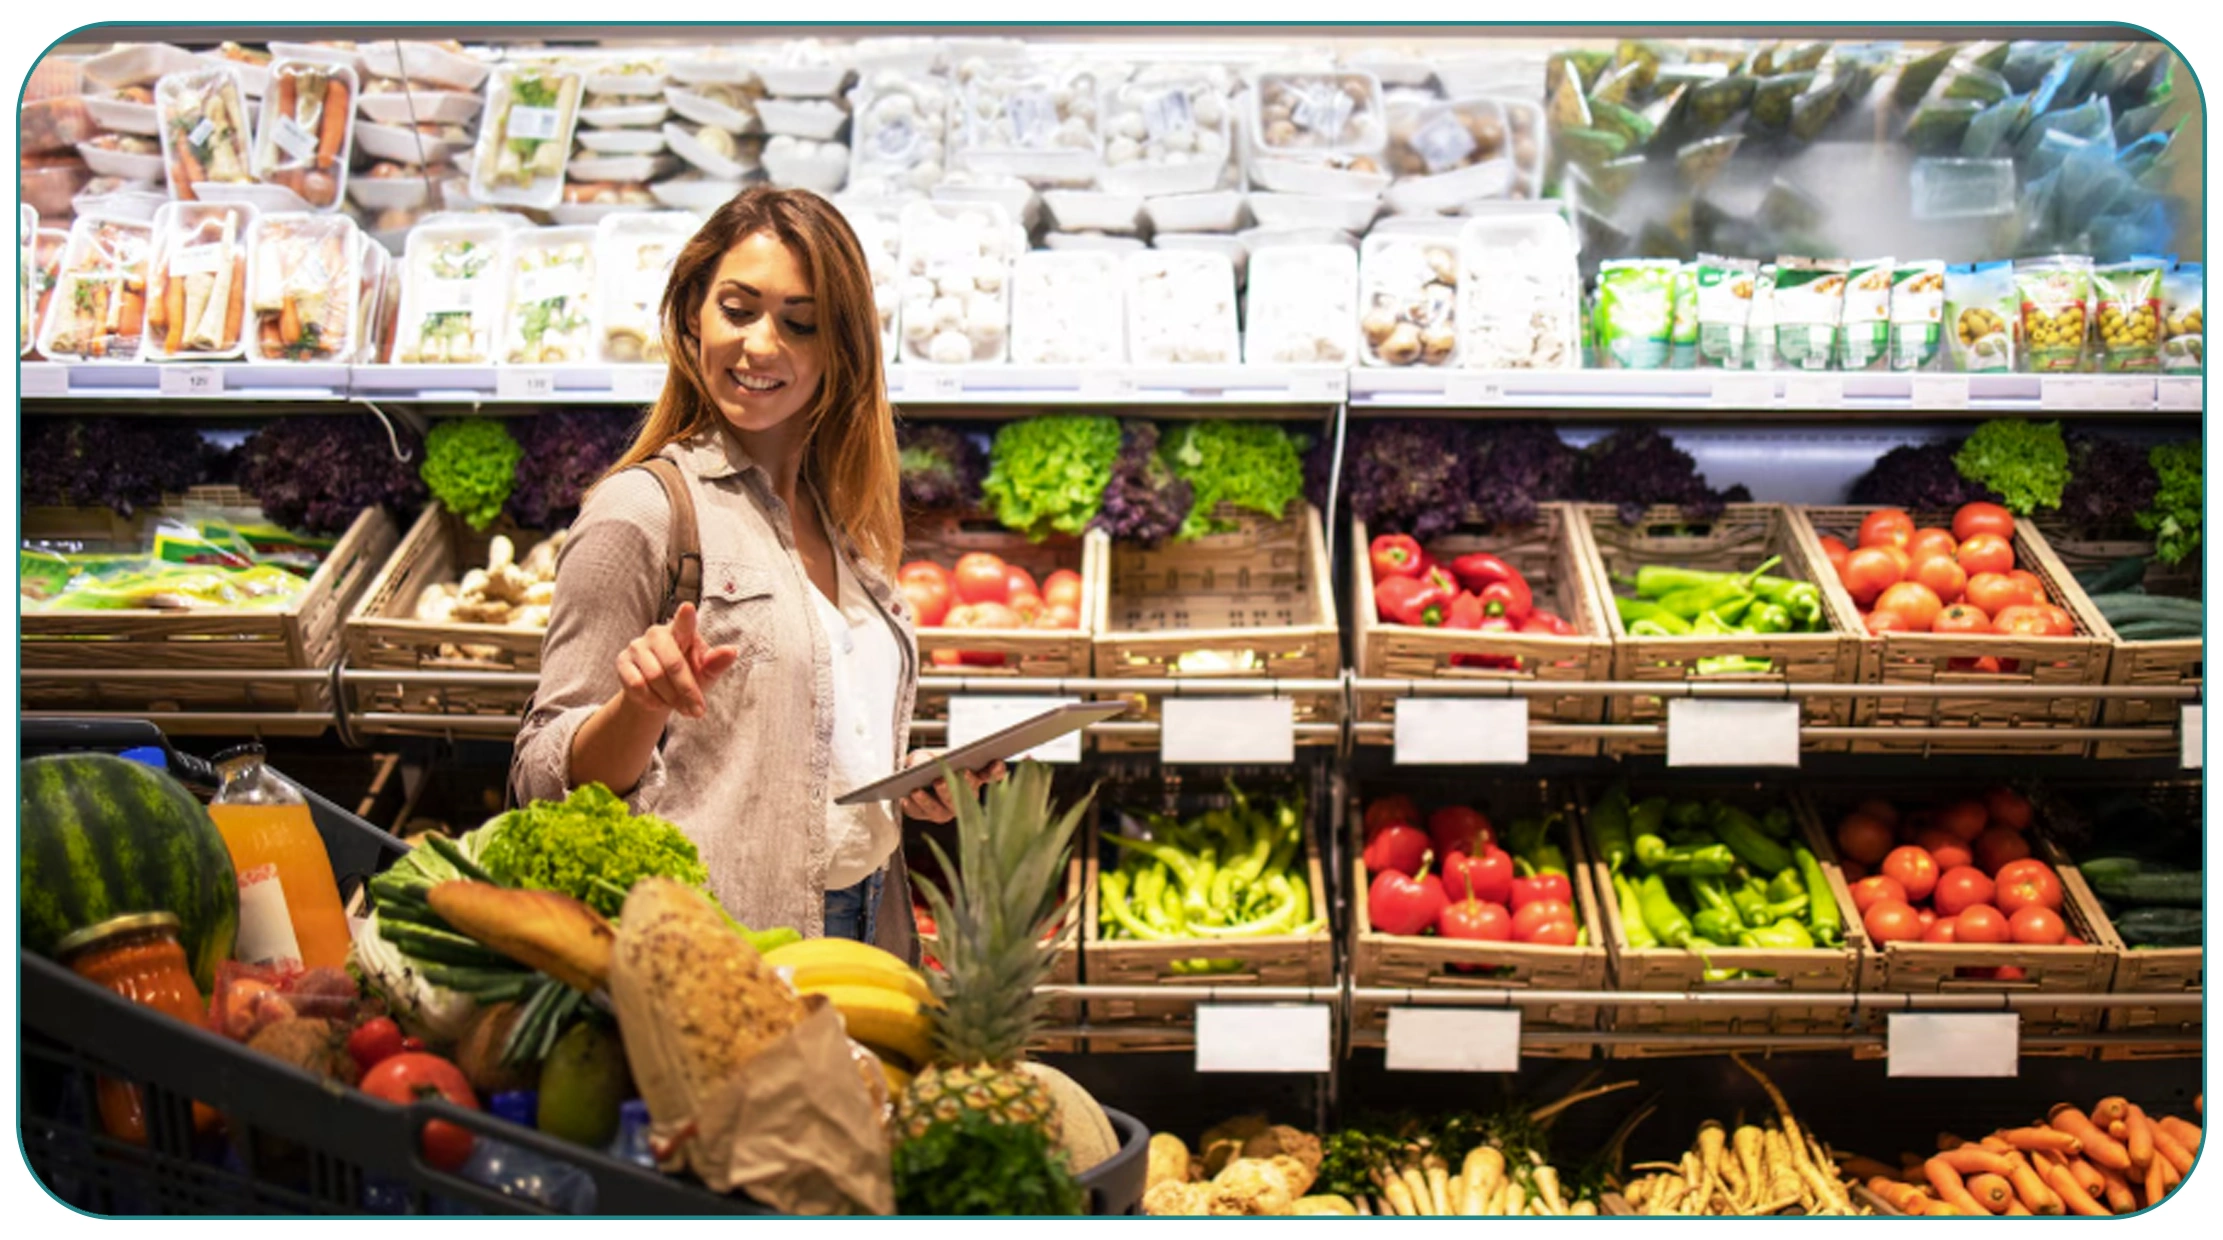
Retailers need structured and scalable information systems to support analytics and reporting operations. Businesses increasingly rely on a high-quality Grocery Dataset to power dashboards, forecasting tools, and pricing intelligence systems.
Structured grocery datasets contain detailed product information, including pricing, availability, promotions, category classification, and regional market trends. Retailers use these datasets to train AI models, optimize supply chain strategies, and improve business forecasting accuracy.
Dashboards built on centralized datasets provide real-time visibility into product performance and operational metrics. Retailers can identify sales opportunities, track seasonal demand shifts, and improve inventory allocation more efficiently.
Data standardization also improves collaboration between departments by ensuring consistent reporting across procurement, marketing, finance, and operations teams.
Grocery Dataset Utilization Trends (2020–2026)
| Year | Businesses Using Structured Grocery Datasets | Increase in Forecast Accuracy |
|---|---|---|
| 2020 | 27% | 23% |
| 2021 | 35% | 31% |
| 2022 | 44% | 40% |
| 2023 | 53% | 49% |
| 2024 | 63% | 58% |
| 2025 | 72% | 67% |
| 2026 | 82% | 76% |
Important advantages include:
- Centralized grocery analytics
- Better forecasting accuracy
- Improved cross-department collaboration
- Enhanced product categorization
- Faster operational reporting
Retailers using structured datasets improve business intelligence capabilities and streamline decision-making processes.
Expanding Retail Intelligence Through Advanced Automation
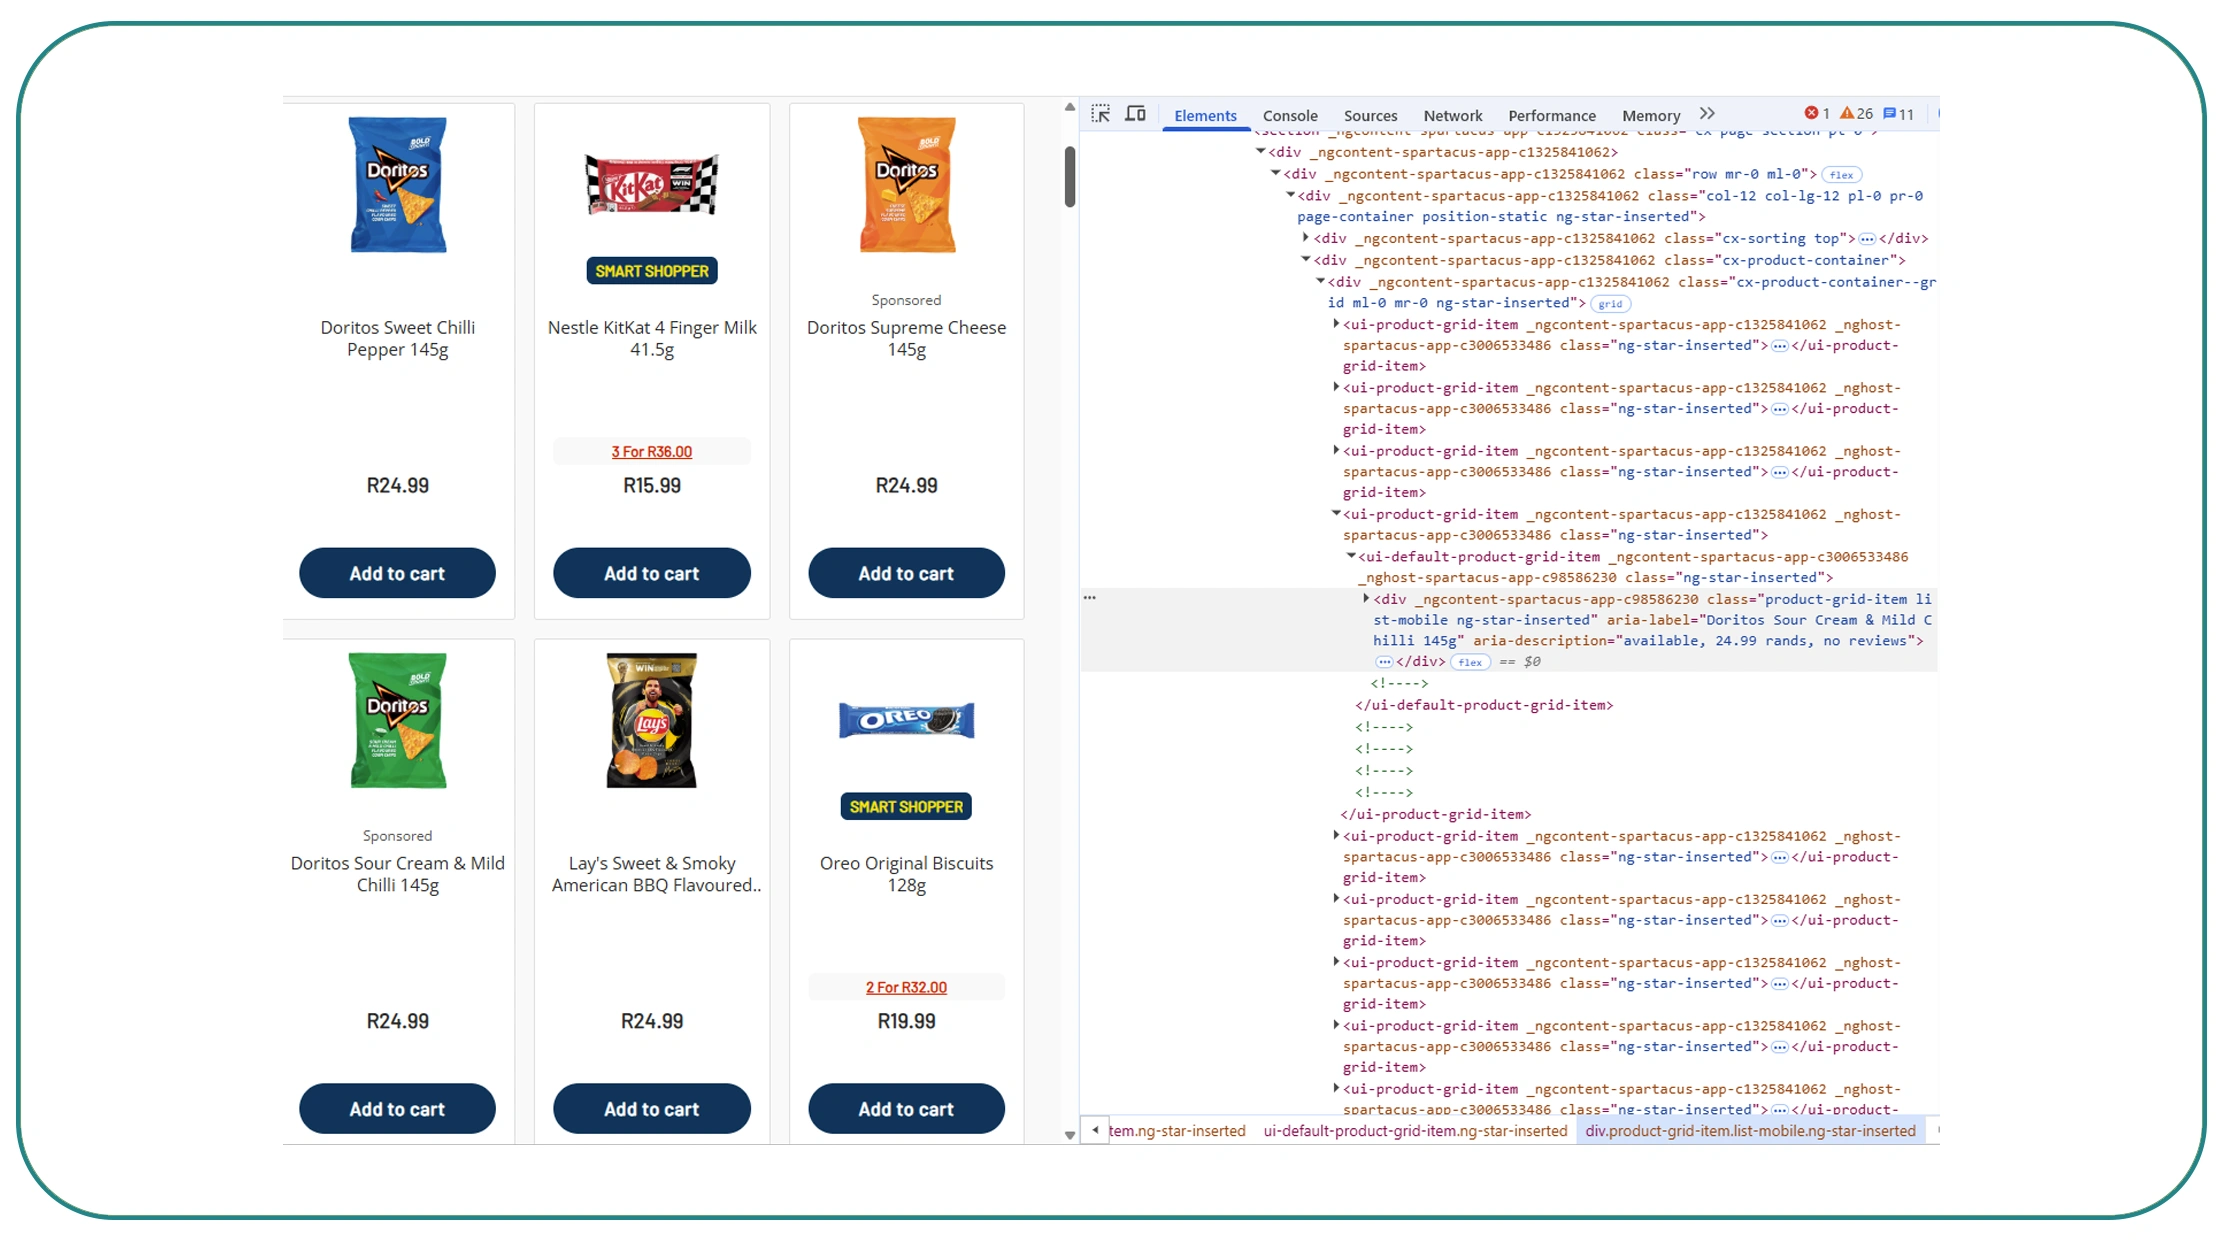
Automation technologies are transforming how grocery businesses collect and analyze retail information. Companies are increasingly exploring Top Grocery Scraping API Use Cases to improve operational efficiency and gain competitive advantages.
Retailers use scraping APIs for price monitoring, inventory tracking, competitor benchmarking, customer sentiment analysis, and demand forecasting. These automated systems collect large volumes of grocery data in real time while reducing manual operational workloads.
Advanced scraping APIs also support regional market analysis and promotional tracking. Businesses can identify emerging trends, monitor category performance, and optimize product placement more effectively.
Integration with visualization dashboards further enhances usability by converting raw data into actionable insights. Retailers can automate reporting and improve strategic planning using centralized analytics systems.
Grocery Scraping API Adoption Statistics (2020–2026)
| Year | Retailers Using Grocery Scraping APIs | Increase in Data Collection Speed |
|---|---|---|
| 2020 | 25% | 21% |
| 2021 | 34% | 30% |
| 2022 | 43% | 39% |
| 2023 | 52% | 48% |
| 2024 | 62% | 58% |
| 2025 | 72% | 68% |
| 2026 | 83% | 77% |
Key advantages include:
- Automated grocery data collection
- Faster competitor analysis
- Better promotional tracking
- Improved inventory monitoring
- Enhanced forecasting capabilities
Retailers using advanced scraping APIs improve scalability, efficiency, and real-time market intelligence.
Delivering Actionable Insights Through Real-Time Analytics
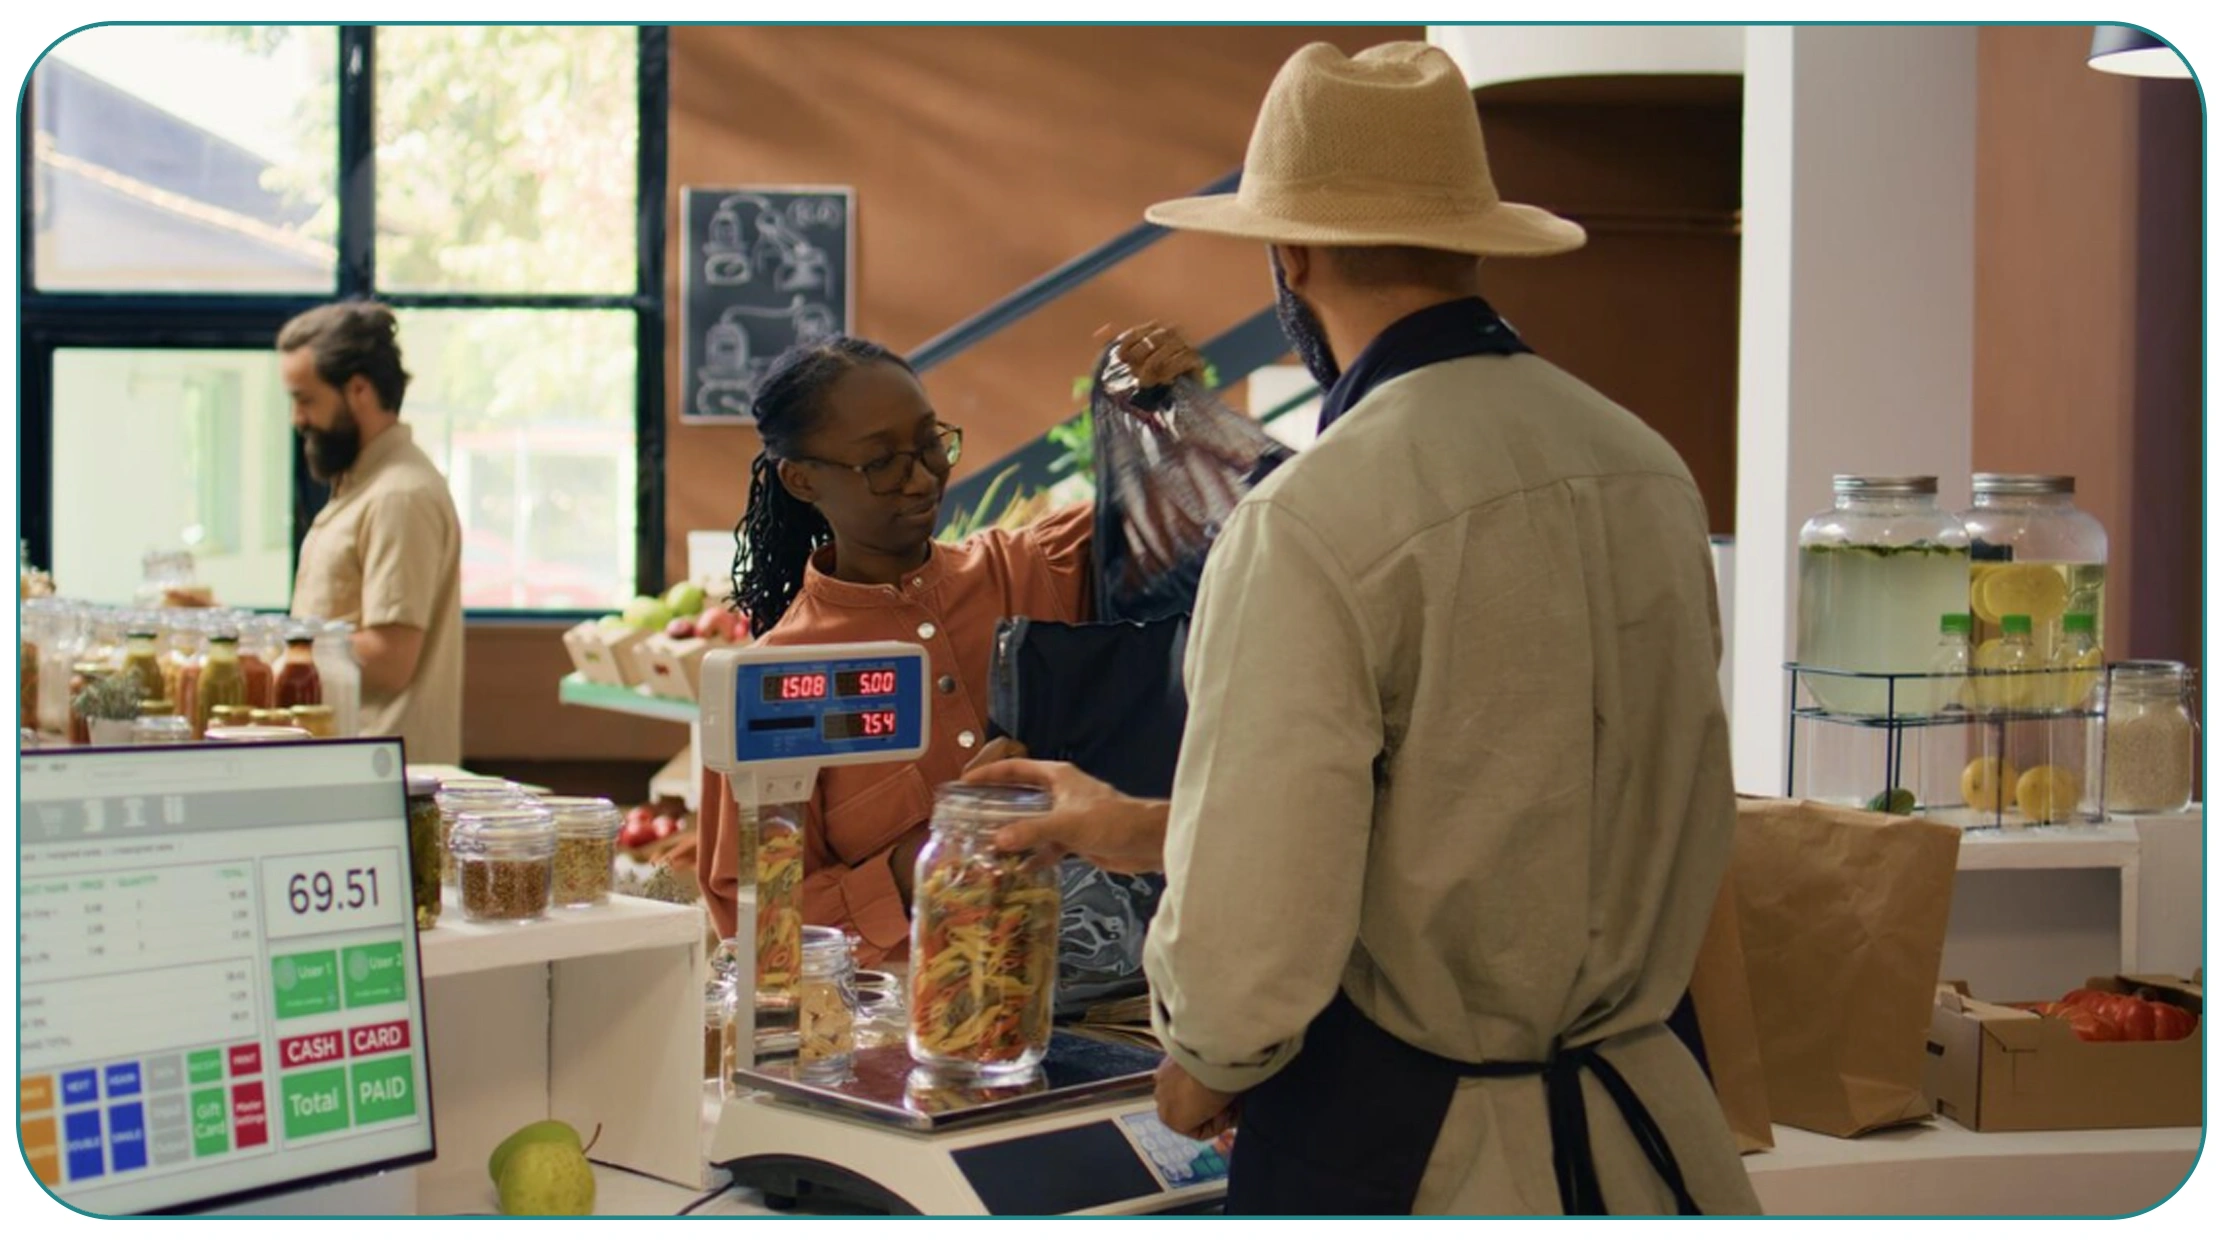
Retail businesses require faster and more accurate insights to remain competitive in evolving grocery markets. Organizations increasingly rely on a Real-Time Business Data Analytics Dashboard to centralize operational metrics, pricing intelligence, and customer demand analytics.
These dashboards integrate grocery scraping data, inventory performance, promotional analytics, and sales forecasting into one unified system. Decision-makers can monitor business performance instantly and respond quickly to pricing or supply chain changes.
AI-powered analytics dashboards also support predictive insights by identifying sales trends, regional demand patterns, and customer purchasing preferences. This helps retailers improve strategic planning and optimize inventory management.
Real-time dashboards reduce delays associated with manual reporting and improve organizational transparency. Teams can collaborate more efficiently while accessing updated information across departments.
Real-Time Analytics Dashboard Growth (2020–2026)
| Year | Retailers Using Real-Time Dashboards | Improvement in Decision-Making Speed |
|---|---|---|
| 2020 | 26% | 22% |
| 2021 | 35% | 31% |
| 2022 | 44% | 40% |
| 2023 | 53% | 49% |
| 2024 | 63% | 58% |
| 2025 | 73% | 68% |
| 2026 | 84% | 78% |
Major benefits include:
- Faster operational decision-making
- Better sales forecasting
- Improved inventory optimization
- Enhanced collaboration across departments
- Stronger business transparency
Retailers leveraging real-time analytics dashboards improve operational efficiency and strengthen competitive market positioning.
Why Choose Real Data API?
Real Data API provides scalable grocery analytics, scraping, and dashboard automation solutions tailored for modern retailers and FMCG businesses. Companies focused on building grocery dashboards using Pick n Pay scraped data can access real-time grocery pricing, inventory monitoring, trend analytics, and competitor intelligence through advanced automation systems.
The platform helps businesses centralize grocery insights into interactive dashboards for faster and smarter decision-making. With scalable APIs, real-time extraction capabilities, and visualization integrations, Real Data API enables retailers to optimize pricing strategies, improve forecasting, and enhance operational visibility. Businesses can efficiently monitor grocery trends and transform retail data into actionable business intelligence.
Conclusion
Retail grocery analytics is rapidly evolving as businesses adopt automation, visualization, and AI-driven intelligence systems. Companies focused on building grocery dashboards using Pick n Pay scraped data gain valuable insights into pricing trends, customer demand, competitor strategies, and inventory performance.
Automated dashboards simplify large-scale grocery monitoring while improving operational efficiency and strategic planning. Retailers can optimize dynamic pricing, enhance promotional campaigns, forecast demand more accurately, and respond faster to market changes using centralized analytics platforms.
As digital grocery ecosystems continue to expand in 2026, businesses investing in real-time retail intelligence will achieve stronger competitive advantages and improved profitability.
Contact Real Data API today to start building grocery dashboards using Pick n Pay scraped data and transform your retail analytics into real-time business intelligence solutions!
Latest posts
Web Scraping Competitor Product Monitoring Using Marketplace Data for Real-Time E-commerce Insights and Business Growth?
How to Scrape Product Intelligence Platform Using Marketplace Data to Help Brands Optimize Pricing, Inventory, and Product Strategy?
Why Companies scrape business data from Google Maps using keywords to Build Accurate Business Lists and Competitive Insights?
How Review scraping and monitoring services Help Businesses Track Customer Sentiment and Protect Brand Reputation in 2026?
How Real Estate Investment Insights Using RERA Data Scraping Help Investors Minimize Risk and Maximize Returns

Real Data API stands out as one of the premier global companies specializing in web data Scraping and web extraction.





.png)


Rating 4.7
Rating 4.7
Rating 4.5
Rating 4.7
Rating 4.7


Disclaimer : RealData API functions solely as an independent data infrastructure and technology solutions provider. We build customized automation workflows designed to collect publicly accessible web data based exclusively on client instructions. RealData API neither owns proprietary datasets nor engages in the sale or redistribution of extracted information. Our operations are limited strictly to lawful public web data processing and never involve unauthorized access to restricted systems or private networks. Any company names, trademarks, logos, or brand references displayed on this website are used purely for demonstrative and illustrative purposes to showcase our technical capabilities and do not imply endorsement, partnership, or affiliation. Use of our platform and services remains subject to our Terms of Service.