
Introduction
The most effective way to identify emerging investment hotspots is through Real estate investment heat maps data scraping via RERA. By collecting structured RERA project data and visualizing it through heat maps, investors can evaluate high-demand locations, monitor project activity, compare pricing trends, and make faster, data-driven investment decisions.
Industry Insight: Industry estimates indicate that India's real estate market is expected to surpass $1 trillion by 2030, while PropTech adoption has increased by more than 70% since 2020. Data-driven investment platforms powered by RERA intelligence are becoming essential tools for institutional investors, developers, and market analysts.
Target Audience: Real estate investors, property consultants, PropTech companies, financial institutions, developers, research firms, and GIS analytics providers.
Pain Point Solved: Manual property research is time-consuming and fragmented. Automated RERA data collection provides structured, accurate, and continuously updated project intelligence that supports smarter investment decisions.
Today's property investors require more than static market reports. They need real-time insights into project registrations, developer activity, pricing movements, construction status, approvals, inventory availability, and regional demand. Heat maps transform this complex information into intuitive visual intelligence that helps identify investment opportunities faster.
Organizations leveraging Real estate investment heat maps data scraping via RERA can integrate structured property information into GIS platforms, business intelligence dashboards, AI models, and investment analytics systems.
A comprehensive Web Scraping Real Estate Data API enables businesses to automate the collection of project registrations, builder information, project status, location intelligence, possession timelines, property configurations, and regulatory disclosures. As India's real estate ecosystem continues expanding between 2020 and 2026, structured RERA intelligence has become a strategic asset for identifying profitable investment opportunities before they become mainstream.
How Can Investors Visualize High-Potential Investment Zones?
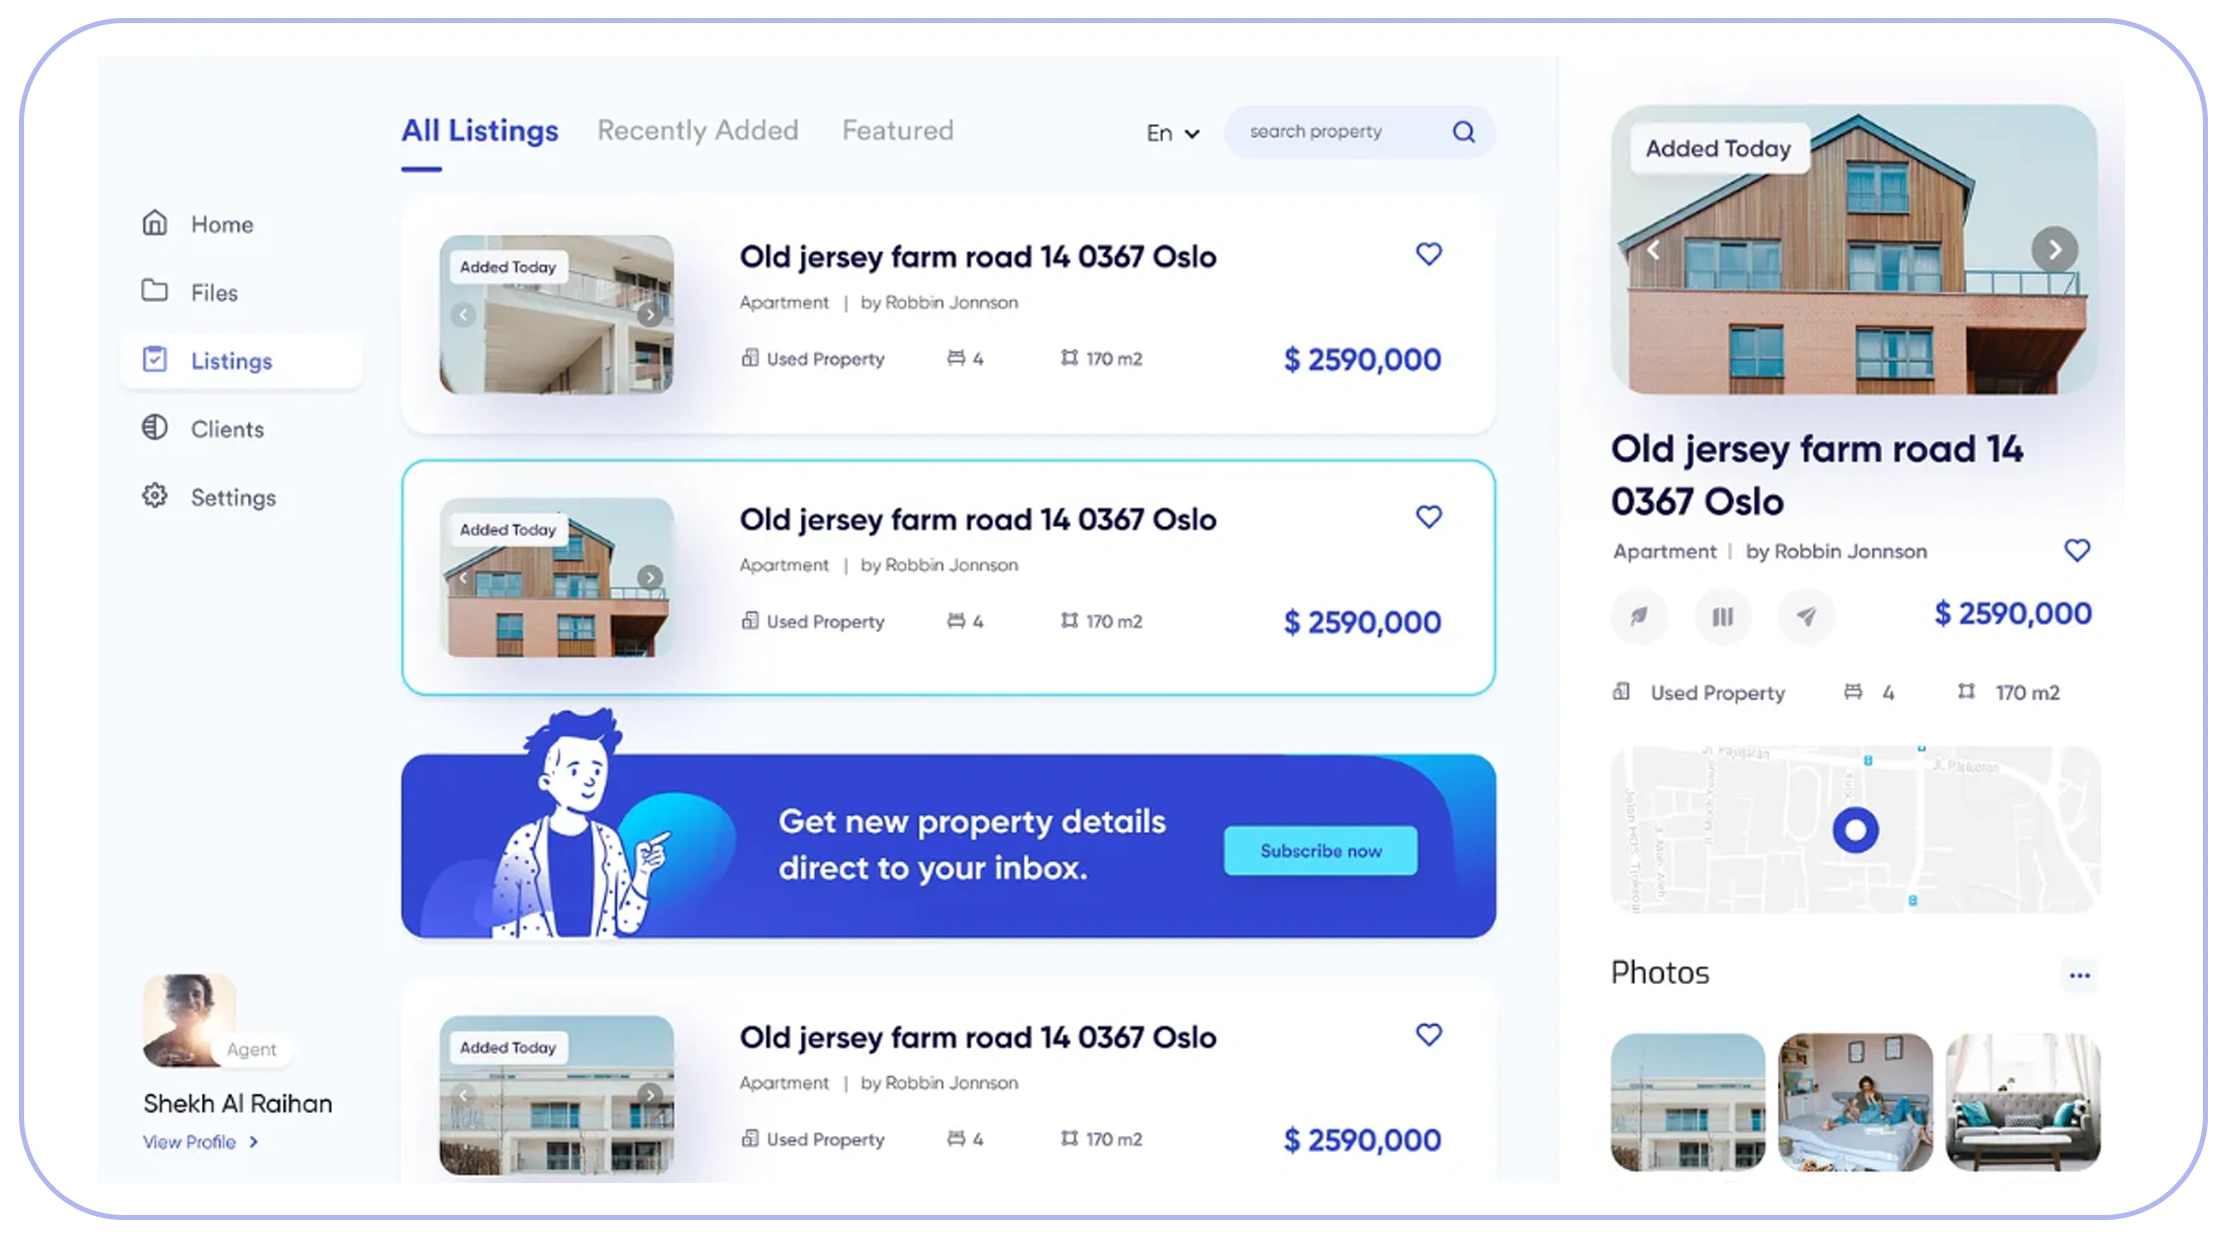
Investment decisions improve significantly when property information is presented visually. Heat maps consolidate thousands of RERA records into easy-to-understand geographic representations that highlight areas experiencing rapid development, increasing project registrations, or strong buyer demand. A Real estate investment dashboard using RERA data scraping allows investors to monitor these trends continuously.
Between 2020 and 2026, major metropolitan regions experienced accelerated residential, commercial, and mixed-use development. Investors increasingly relied on digital dashboards to compare project density, construction activity, pricing growth, developer participation, and infrastructure expansion across multiple cities.
Interactive dashboards help identify neighborhoods attracting new investments while revealing areas with slowing development. Developers use these insights to evaluate land acquisition opportunities. Banks assess lending risks based on project concentration, while research firms analyze regional market performance using historical RERA records.
Centralized dashboards also combine multiple datasets into one interface, including project approvals, completion timelines, inventory availability, developer performance, property categories, and pricing changes. Decision-makers gain immediate visibility into market dynamics without manually reviewing individual project registrations.
The ability to visualize investment activity geographically improves planning, reduces research time, and supports confident investment decisions based on reliable regulatory data.
Business Benefits
- Geographic investment visualization
- Project density analysis
- Developer activity monitoring
- Regional pricing comparisons
- Infrastructure impact analysis
- Executive investment dashboards
Investment Dashboard Trends (2020-2026)
| Investment Metric | 2020 | 2022 | 2024 | 2026 (Projected) |
|---|---|---|---|---|
| RERA Registered Projects | 100 Index | 138 | 194 | 271 |
| Digital Investment Dashboards | 24% | 42% | 64% | 86% |
| Geographic Heat Map Adoption | 19% | 37% | 58% | 81% |
| Institutional Data Usage | 31% | 49% | 69% | 89% |
| AI-Based Property Analytics | 18% | 35% | 57% | 80% |
Organizations that integrate visual investment dashboards into their decision-making process gain stronger market visibility, identify emerging opportunities faster, and improve long-term investment planning.
Why Are Live Market Signals Essential for Property Investors?
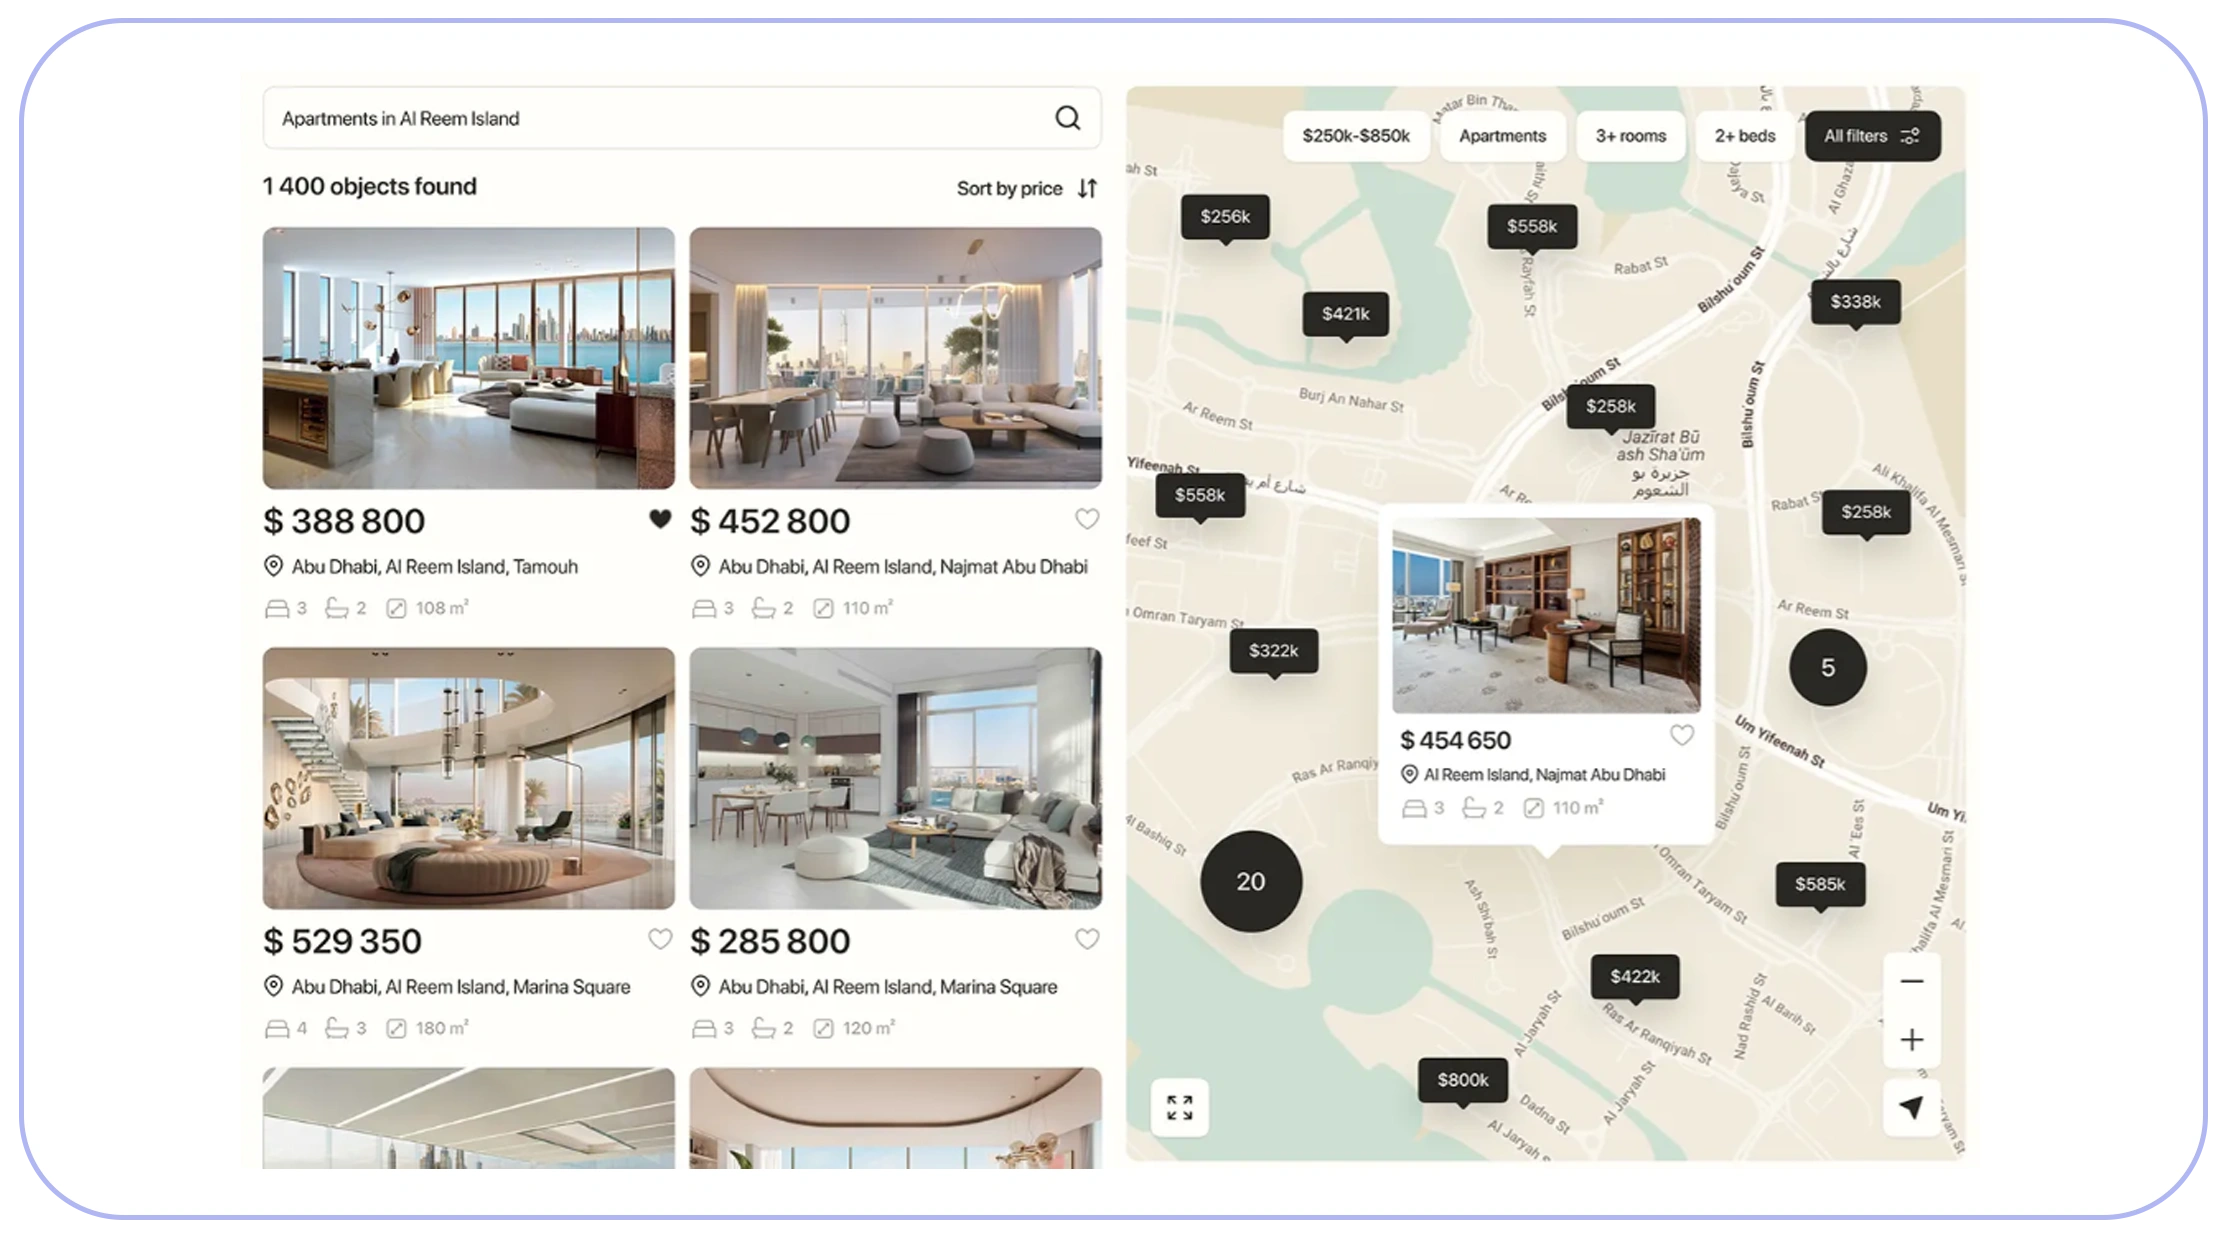
Real estate markets change continuously as new projects launch, prices fluctuate, approvals are granted, and construction milestones progress. Investors who rely on outdated reports often miss valuable opportunities. Real-time property investment heat maps using RERA scraper enable organizations to monitor live market activity and respond quickly to changing investment conditions.
From 2020 through 2026, the volume of RERA-registered projects increased substantially across residential, commercial, industrial, and integrated township developments. Real-time data collection allows investors to monitor project launches, pricing changes, inventory movements, builder activity, and possession schedules without waiting for quarterly reports.
Heat maps powered by continuously updated RERA information reveal emerging growth corridors, infrastructure-driven appreciation zones, and regions attracting strong developer investment. Property consultants use these insights to advise clients on high-potential markets. Institutional investors benchmark project performance across cities, while developers evaluate competitor expansion strategies.
Real-time visualization also supports risk management by identifying areas with delayed projects, lower registration activity, or slowing development. This enables investors to diversify portfolios based on reliable regulatory intelligence rather than speculation.
Key Advantages
- Continuous project monitoring
- Live pricing intelligence
- Regional demand visualization
- Infrastructure impact assessment
- Investment opportunity discovery
- Better portfolio diversification
Real-Time Property Intelligence (2020-2026)
| Market Indicator | 2020 | 2022 | 2024 | 2026 (Projected) |
|---|---|---|---|---|
| Daily Project Updates | 8,500 | 15,800 | 26,400 | 41,700 |
| Live Property Analytics Adoption | 22% | 41% | 63% | 85% |
| Investment Heat Map Usage | 18% | 35% | 56% | 79% |
| AI-Based Investment Forecasting | 16% | 33% | 54% | 78% |
| Automated Market Monitoring | 27% | 46% | 68% | 90% |
Organizations leveraging real-time property intelligence gain a competitive advantage by identifying high-growth markets earlier, minimizing investment risks, and making faster data-driven decisions in an increasingly dynamic real estate environment.
How Can Investors Compare Regional Property Markets More Effectively?
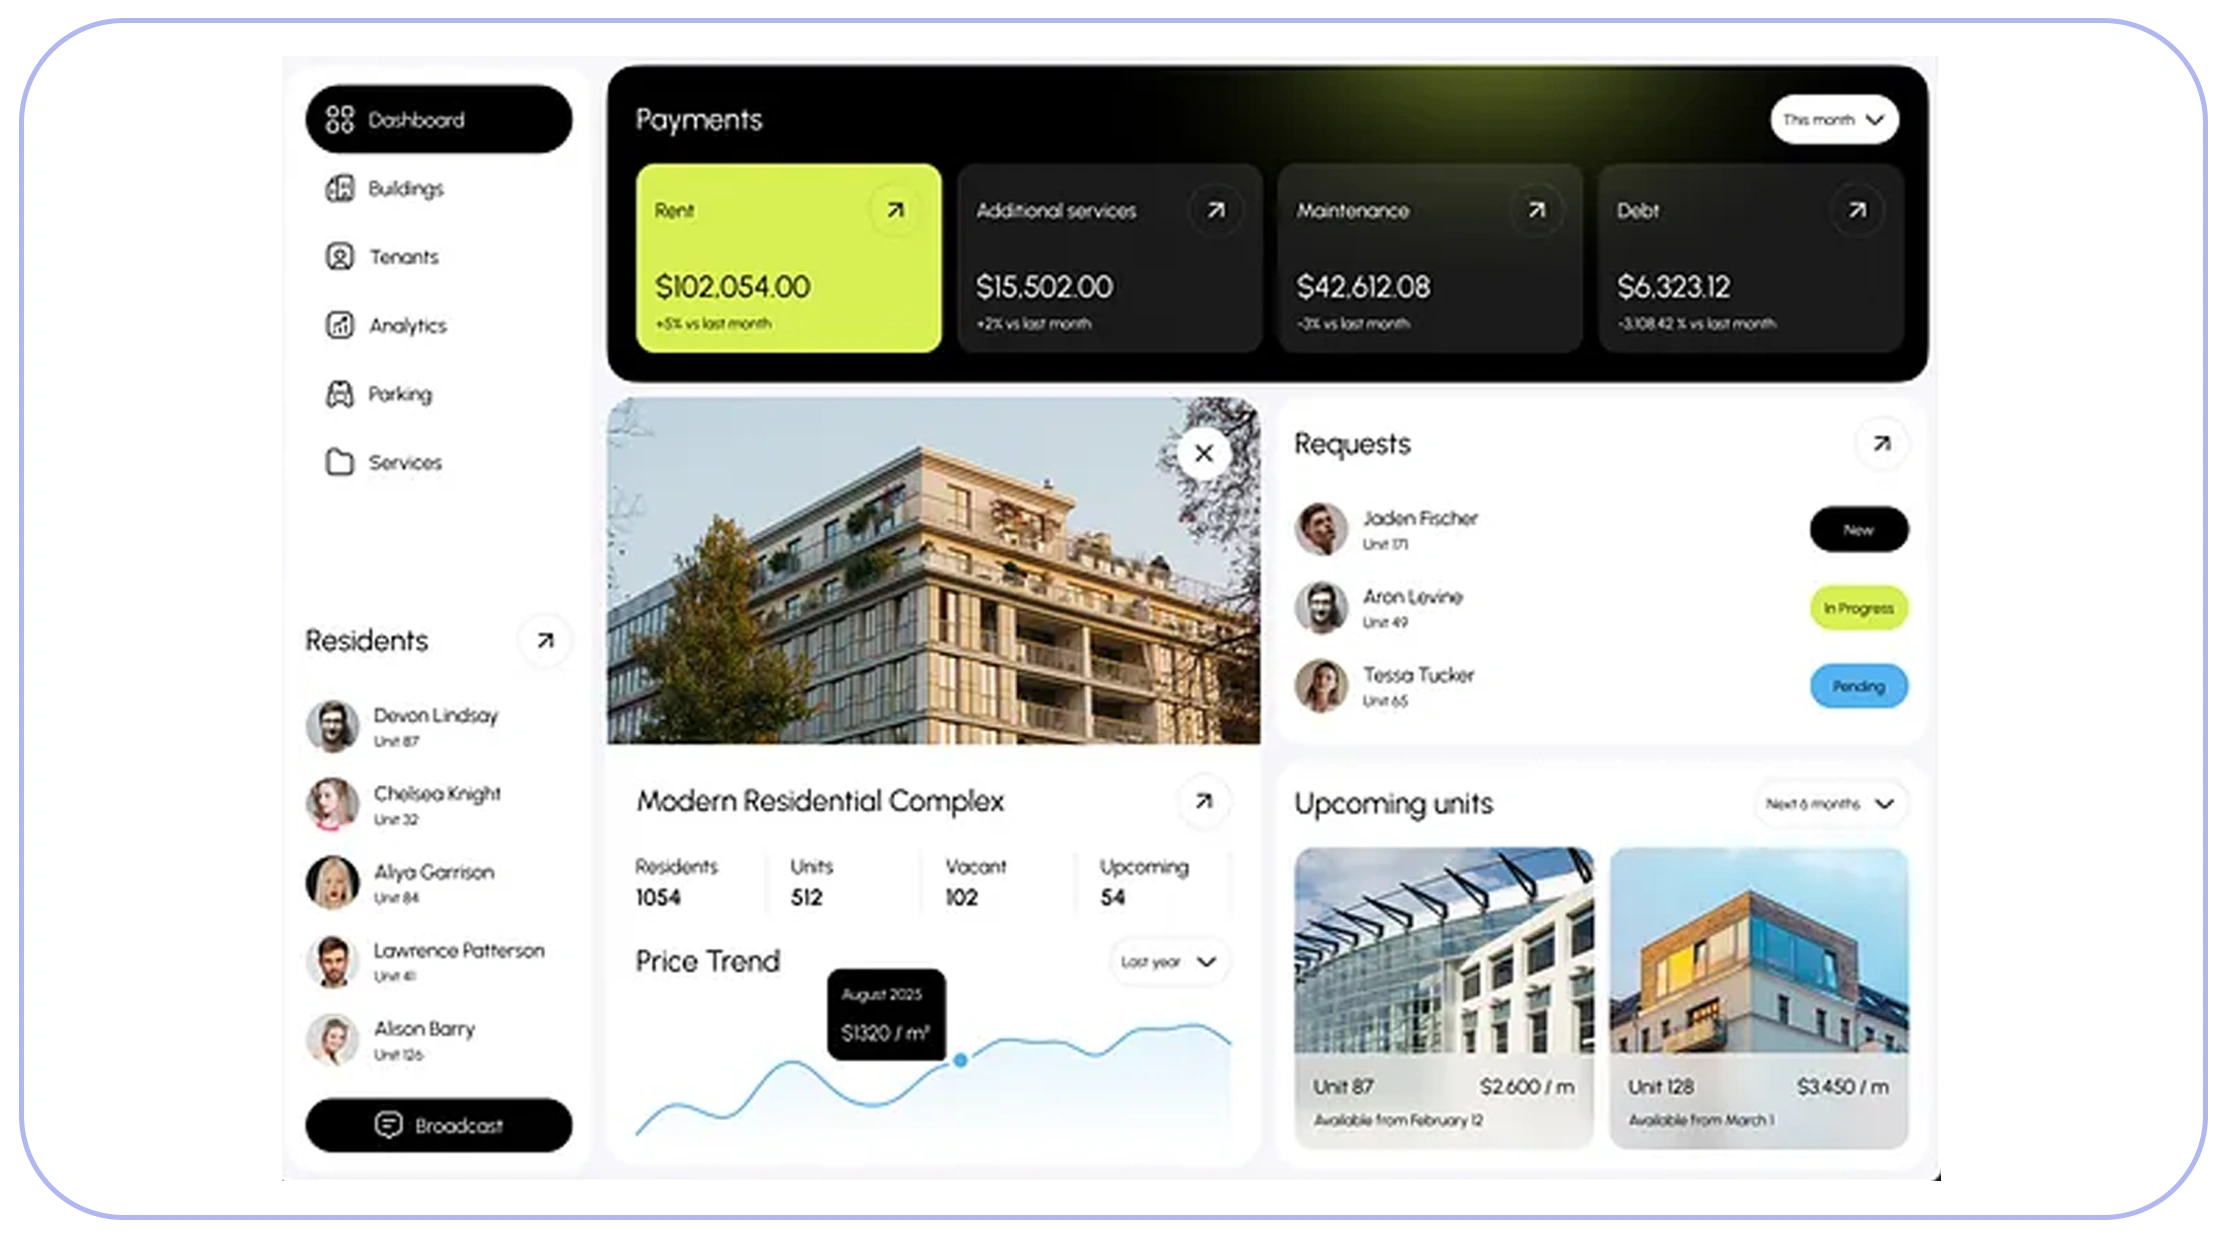
Successful property investment depends on comparing locations using objective market indicators instead of assumptions. Interactive heat maps built with RERA data scraping for Property market heat maps help investors evaluate project density, construction activity, developer participation, property prices, and infrastructure growth across multiple regions using structured regulatory data.
Between 2020 and 2026, India's real estate landscape expanded rapidly due to urbanization, smart city initiatives, metro rail development, and increasing residential demand. Investors increasingly adopted location-based analytics to identify districts showing strong appreciation potential before prices reached maturity.
Heat maps transform thousands of RERA records into visual indicators that simplify market comparisons. Analysts can compare residential and commercial project launches, monitor developer concentration, evaluate project completion timelines, and identify neighborhoods with accelerating investment activity.
Financial institutions use regional property intelligence to assess lending opportunities and investment risks. Developers analyze competitor expansion, while PropTech companies integrate location intelligence into customer-facing applications. Urban planners also benefit from structured property datasets when evaluating infrastructure development and population growth.
By combining geographic visualization with continuously updated RERA records, organizations improve investment planning, reduce manual research, and gain a clearer understanding of regional market performance.
Benefits of Regional Market Analysis
- Compare investment hotspots
- Track project concentration
- Monitor infrastructure-driven growth
- Evaluate developer competition
- Analyze historical market performance
- Improve location selection
Regional Property Market Trends (2020-2026)
| Market Comparison Metric | 2020 | 2022 | 2024 | 2026 (Projected) |
|---|---|---|---|---|
| Cities with Digital Heat Maps | 18 | 34 | 57 | 86 |
| RERA Projects Visualized | 100 Index | 149 | 218 | 312 |
| Infrastructure Growth Index | 100 | 132 | 176 | 229 |
| Property Appreciation Tracking | 27% | 45% | 67% | 88% |
| Geographic Analytics Adoption | 23% | 42% | 65% | 87% |
Organizations using regional property intelligence gain deeper visibility into investment opportunities while improving forecasting accuracy and strategic planning.
Why Does Structured Property Data Drive Better Investment Decisions?
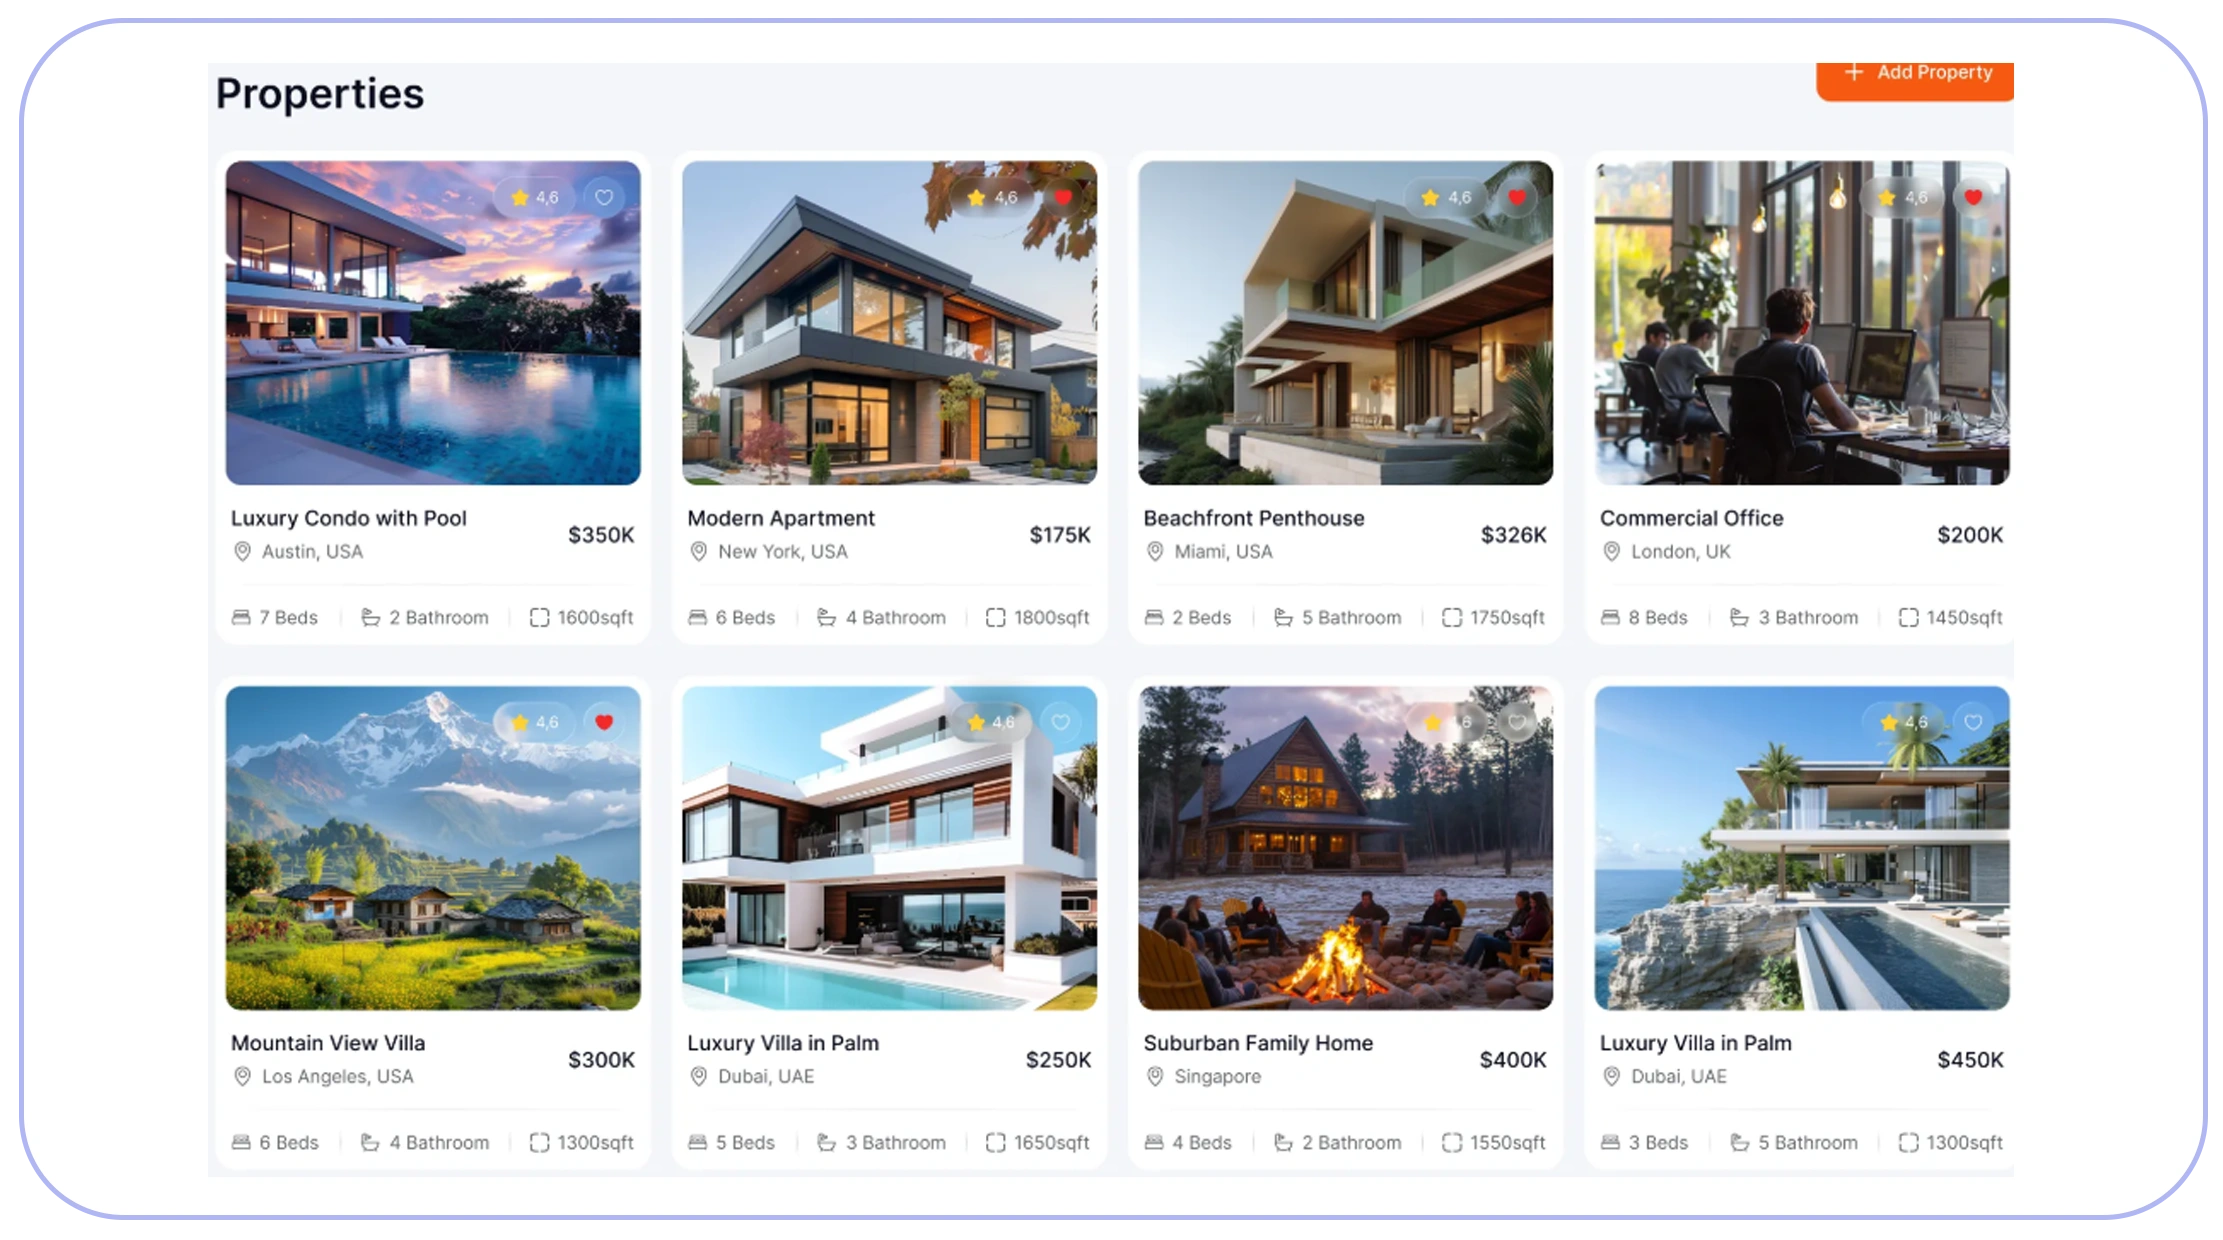
Reliable investment decisions require standardized and continuously updated property information. A comprehensive Real Estate Dataset enables investors, developers, lenders, and analytics firms to evaluate projects using verified regulatory data instead of fragmented market reports.
From 2020 through 2026, the volume of registered real estate projects increased steadily across residential apartments, villas, plotted developments, commercial buildings, industrial parks, and mixed-use townships. This growth generated massive datasets covering project approvals, developer profiles, construction milestones, possession schedules, unit configurations, pricing, amenities, and geographic locations.
Structured datasets support multiple business functions. Investment firms identify emerging markets. Developers benchmark competing projects. Banks evaluate financing opportunities. Insurance providers assess project risks, while research organizations analyze long-term market performance.
AI-powered analytics further enhance these datasets by identifying appreciation patterns, predicting demand, detecting investment clusters, and forecasting future development trends. Organizations integrate structured property data into GIS platforms, executive dashboards, CRM systems, and business intelligence software to automate reporting and improve decision-making.
High-quality datasets also reduce duplication, improve consistency, and simplify cross-market comparisons, enabling stakeholders to evaluate investment opportunities with greater confidence.
Business Advantages
- Standardized project information
- Historical market analysis
- Developer performance tracking
- Investment risk assessment
- AI-powered forecasting
- Executive reporting automation
Real Estate Dataset Growth (2020-2026)
| Dataset Metric | 2020 | 2022 | 2024 | 2026 (Projected) |
|---|---|---|---|---|
| Registered Projects Indexed | 100 Index | 145 | 211 | 301 |
| Developer Profiles | 100 Index | 136 | 189 | 258 |
| Property Records Collected | 12M | 18M | 27M | 40M |
| Automated Dataset Updates | 29% | 48% | 70% | 91% |
| Enterprise Analytics Adoption | 31% | 50% | 72% | 92% |
Businesses leveraging structured real estate datasets gain faster access to trusted market intelligence, improve investment planning, and strengthen competitive analysis across India's evolving property landscape.
How Can Businesses Select the Right Real Estate Data Partner?
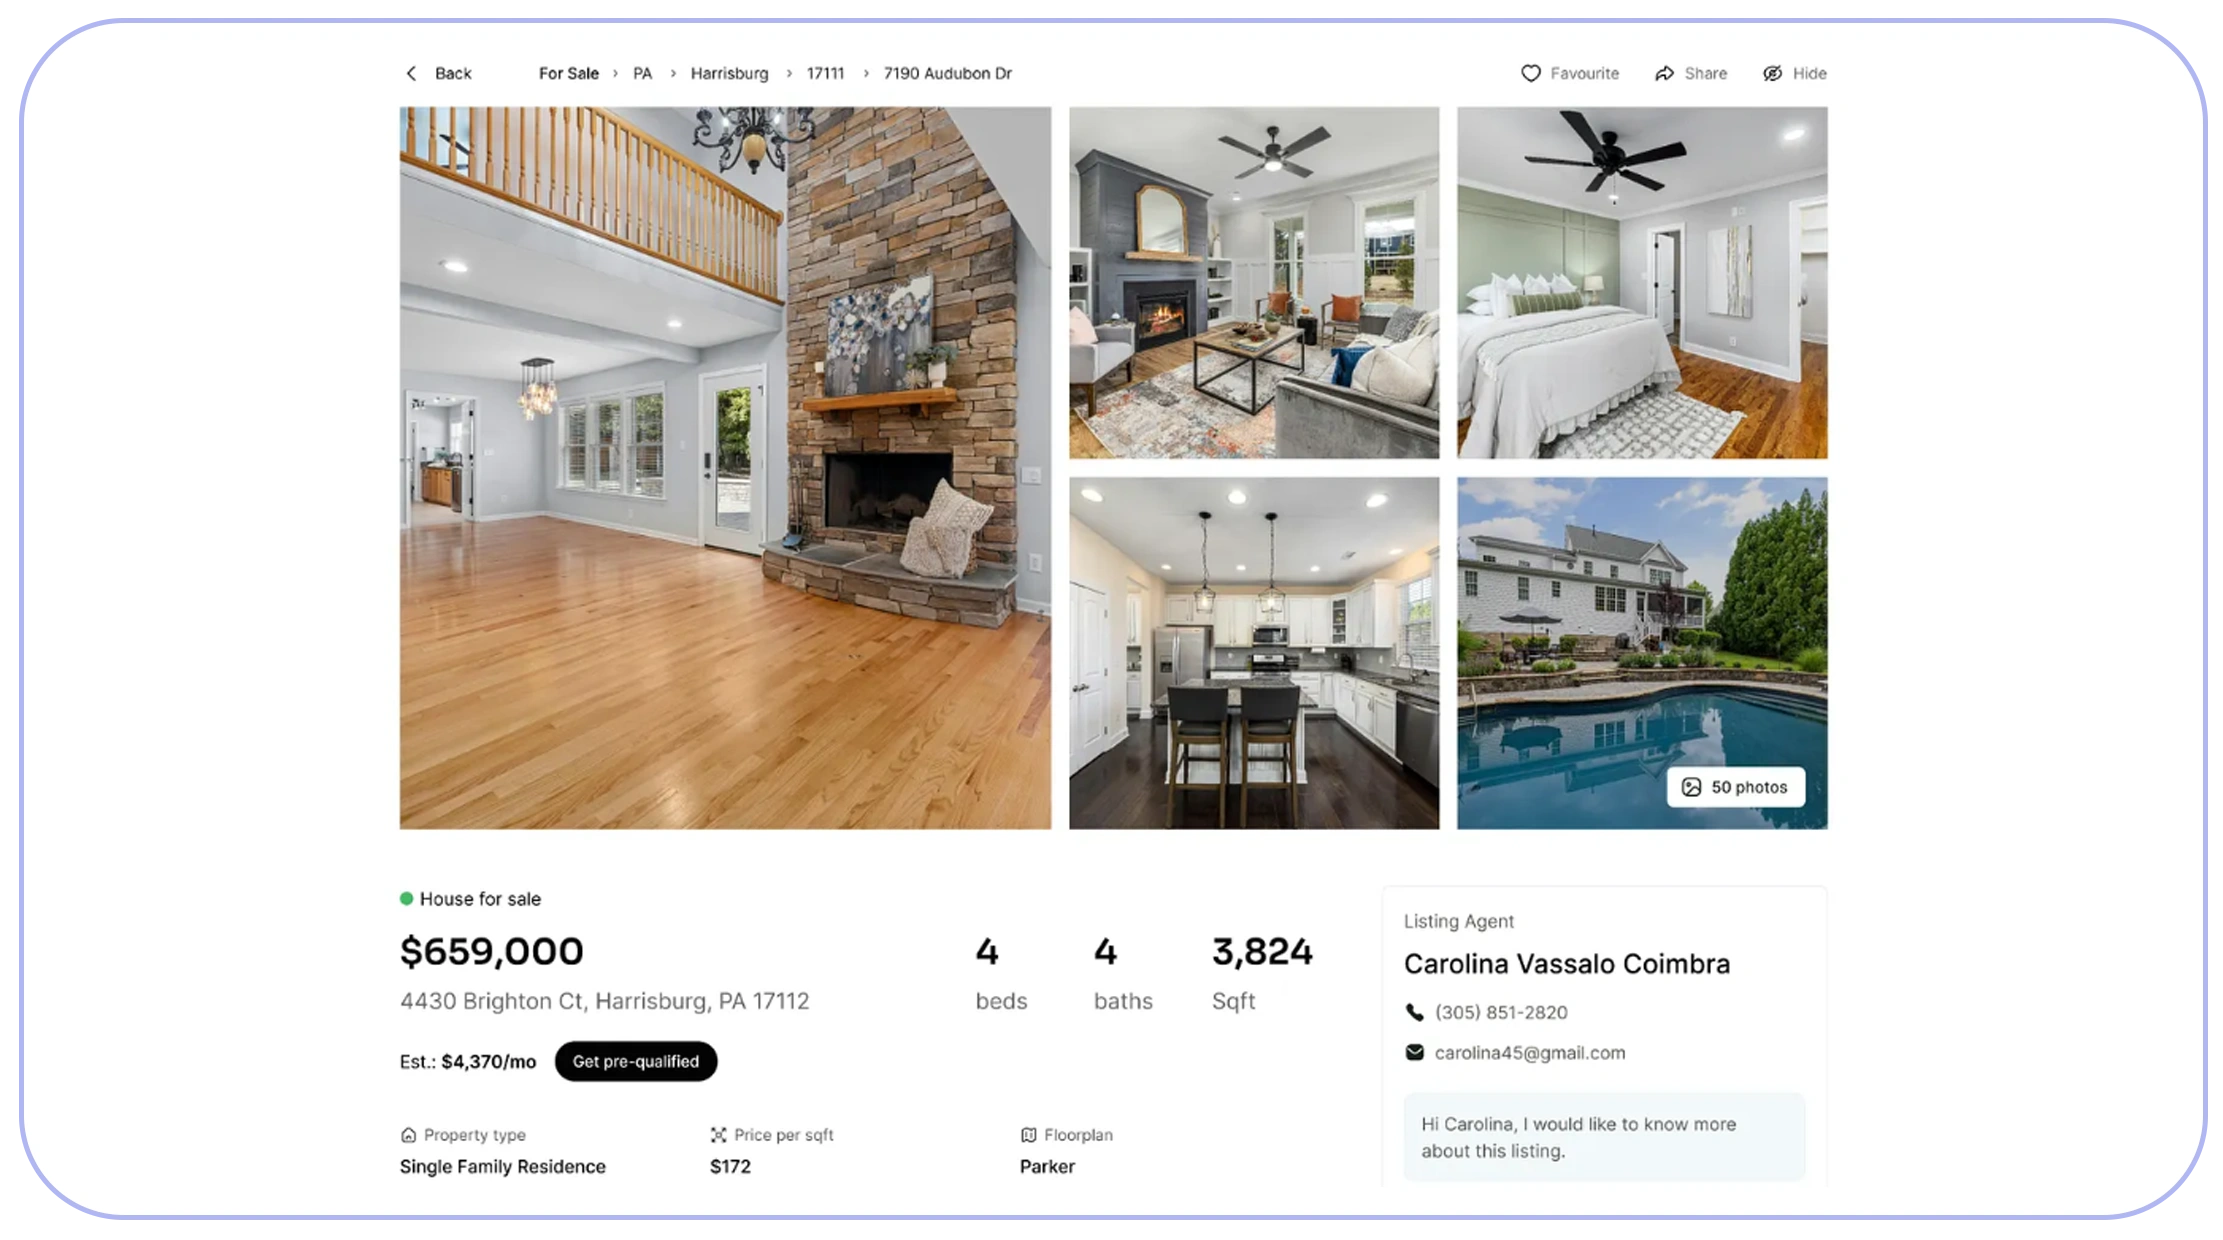
Choosing a reliable data partner is critical for organizations that depend on accurate property intelligence. The best RERA data scraping service provider in India delivers structured, scalable, and continuously updated regulatory data that supports investment analysis, market research, risk assessment, and digital transformation initiatives.
Between 2020 and 2026, demand for automated property intelligence increased significantly as investors shifted toward data-driven decision-making. Large institutional investors, PropTech firms, developers, and financial institutions increasingly adopted automated RERA data solutions to replace manual research and fragmented reporting.
A dependable data provider ensures high data accuracy, standardized property records, automated refresh schedules, secure API integrations, and flexible delivery formats. Organizations can integrate property intelligence into GIS platforms, CRM systems, investment dashboards, AI models, and business intelligence software without extensive manual processing.
Beyond technical capabilities, experienced providers offer customized extraction workflows, historical datasets, dedicated support, and scalable infrastructure capable of processing millions of property records. This enables businesses to monitor project launches, developer activity, pricing trends, construction progress, and regional investment opportunities efficiently.
Selecting the right technology partner improves reporting accuracy, reduces operational costs, accelerates market analysis, and provides organizations with reliable intelligence for confident investment decisions.
Key Evaluation Factors
- High data accuracy
- Automated RERA updates
- Enterprise-grade API integration
- Flexible data delivery
- Historical property records
- Dedicated technical support
Enterprise Adoption Trends (2020-2026)
| Evaluation Metric | 2020 | 2022 | 2024 | 2026 (Projected) |
|---|---|---|---|---|
| Enterprises Using Property APIs | 26% | 44% | 66% | 88% |
| Automated Market Intelligence | 29% | 47% | 69% | 90% |
| AI-Powered Property Analytics | 18% | 36% | 58% | 82% |
| Cloud-Based Investment Platforms | 24% | 43% | 65% | 87% |
| Enterprise Data Integration | 31% | 51% | 73% | 92% |
Organizations partnering with experienced data providers gain reliable access to structured property intelligence that supports long-term business growth and investment success.
How Can Data-Driven Insights Transform Real Estate Investment Strategies?
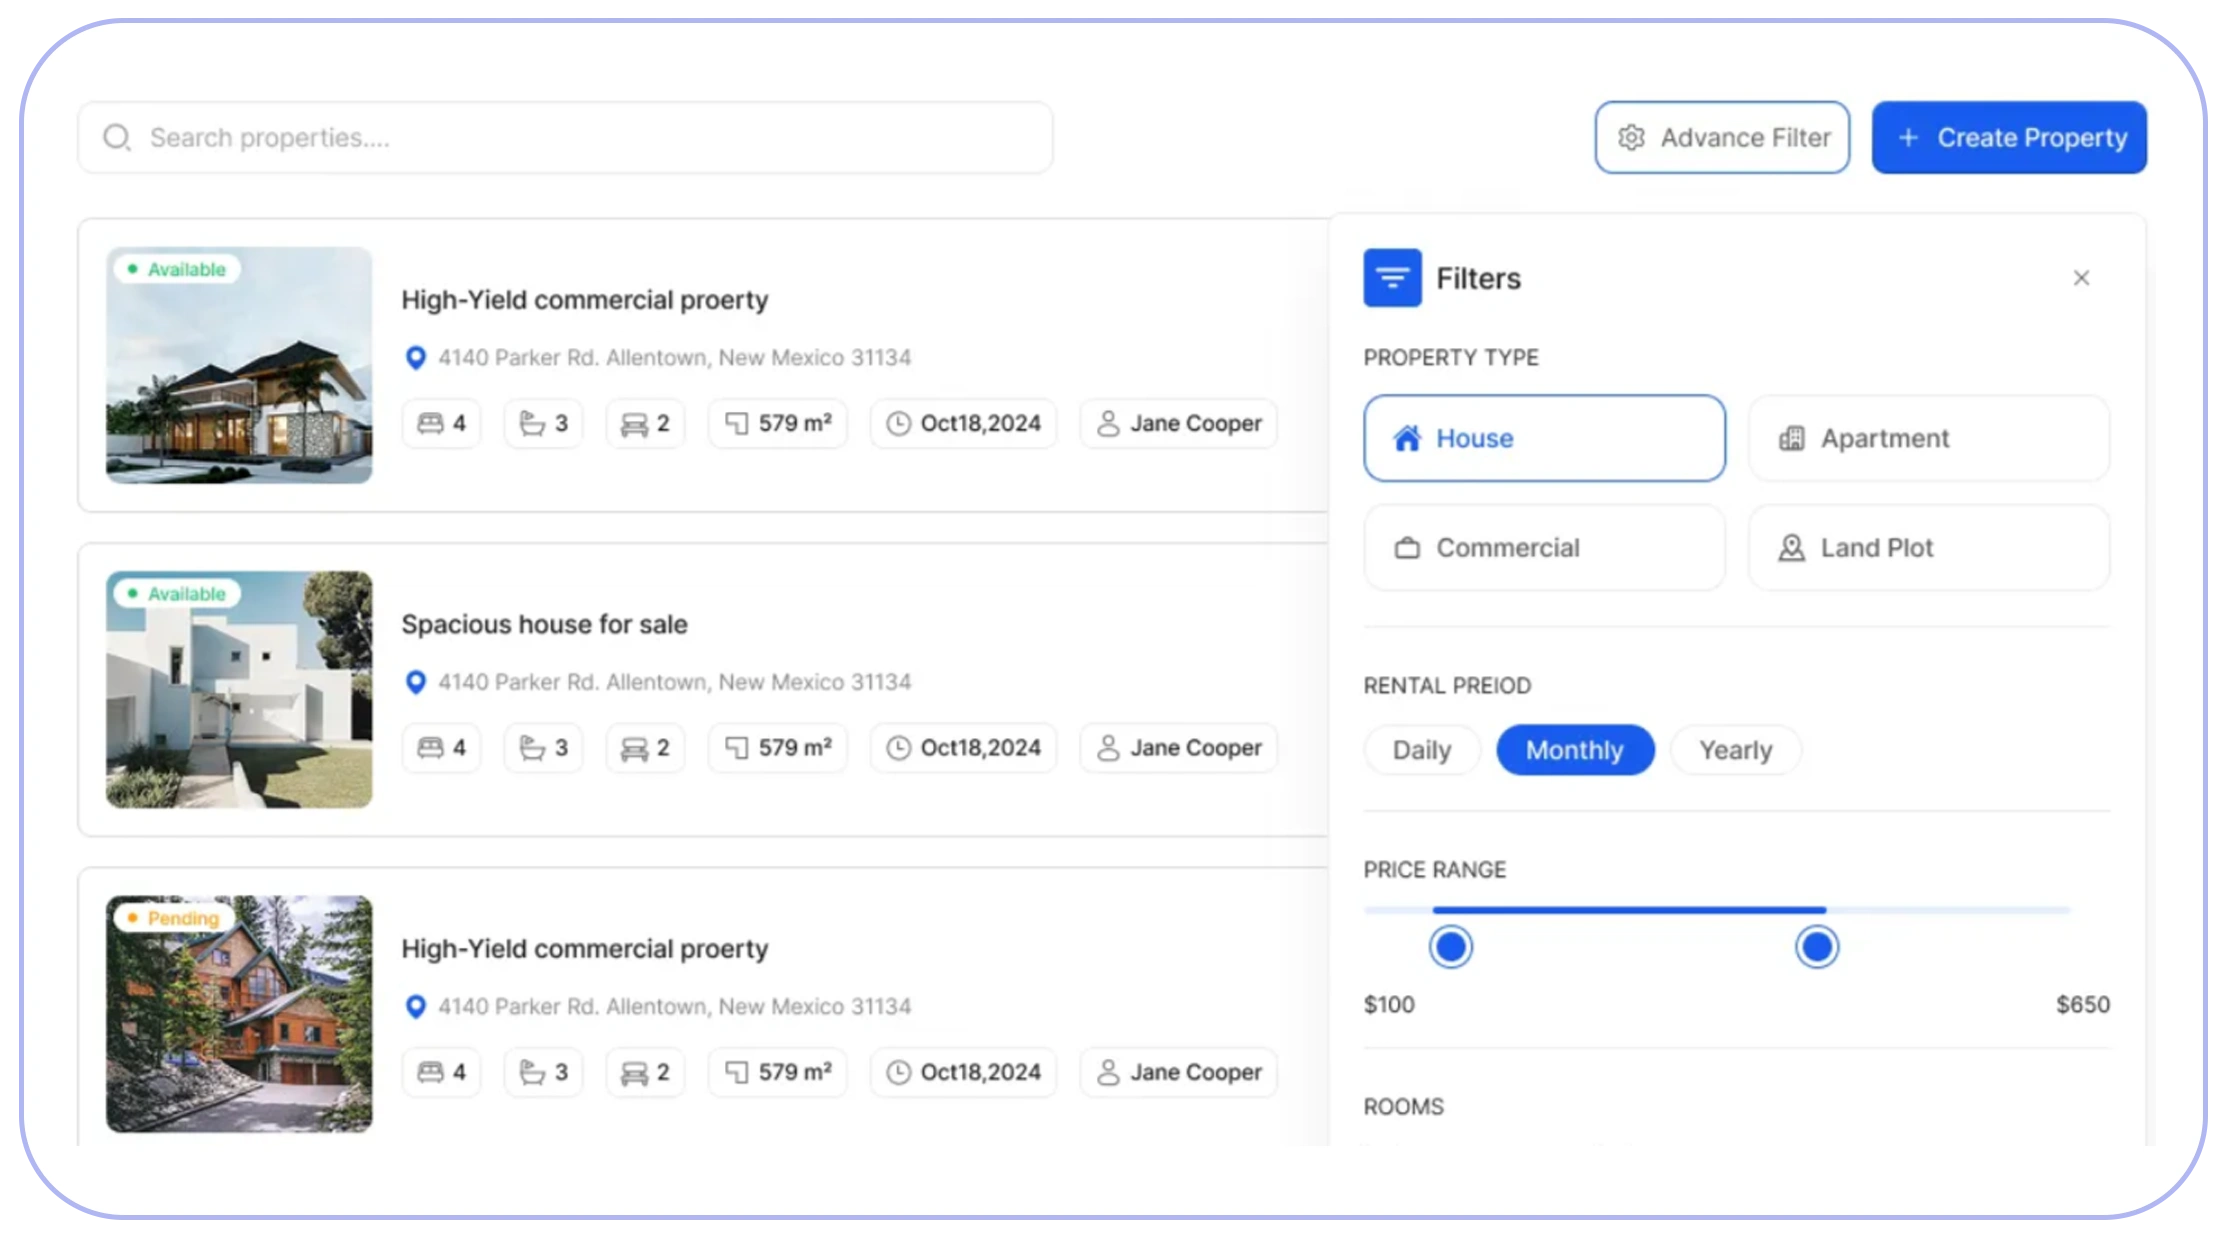
Modern investors require more than project listings—they need actionable intelligence that supports strategic planning. Leveraging RERA Data Scraping for Real Estate Insights enables businesses to transform raw regulatory records into valuable market intelligence for investment forecasting, competitive benchmarking, portfolio management, and regional expansion.
From 2020 through 2026, real estate organizations increasingly integrated structured RERA data into AI-driven analytics platforms, predictive models, and executive dashboards. This shift improved investment decision-making while reducing dependence on manual research and disconnected information sources.
Investment firms analyze historical appreciation trends, project completion rates, and developer performance to identify profitable opportunities. Banks use structured datasets to strengthen credit risk assessments. Developers monitor competitor activity and evaluate land acquisition opportunities, while market research firms forecast future growth corridors using location-based intelligence.
Integrated analytics platforms combine project registrations, pricing trends, geographic information, construction milestones, and infrastructure developments into unified dashboards. These insights help organizations identify high-growth markets, evaluate investment risks, and respond quickly to changing market conditions.
As artificial intelligence continues reshaping the real estate sector, structured regulatory datasets will remain a key driver of smarter investment strategies and operational excellence.
Strategic Applications
- Investment opportunity identification
- Portfolio optimization
- Developer benchmarking
- Risk assessment
- Predictive market forecasting
- Executive decision support
Real Estate Analytics Growth (2020-2026)
| Analytics Metric | 2020 | 2022 | 2024 | 2026 (Projected) |
|---|---|---|---|---|
| AI-Based Investment Analysis | 17% | 35% | 57% | 81% |
| Predictive Property Forecasting | 21% | 40% | 63% | 86% |
| Automated Executive Dashboards | 28% | 47% | 69% | 91% |
| Structured Property Data Usage | 34% | 54% | 75% | 94% |
| GIS Investment Mapping | 20% | 38% | 60% | 84% |
Organizations using structured RERA intelligence gain stronger market visibility, improve forecasting accuracy, reduce investment risks, and make faster, evidence-based real estate decisions.
Why Choose Real Data API?
Organizations seeking reliable property intelligence require a trusted technology partner capable of delivering accurate, scalable, and enterprise-ready data solutions. With Real estate investment heat maps data scraping via RERA, Real Data API empowers investors, developers, financial institutions, and PropTech companies with structured RERA datasets for advanced analytics and smarter investment planning.
Why Businesses Choose Real Data API
- Enterprise-grade RERA data extraction solutions
- Real-time monitoring of project registrations and updates
- High-accuracy structured real estate datasets
- Automated API integration with BI, GIS, CRM, and ERP platforms
- Continuous tracking of developers, projects, pricing, and locations
- Flexible delivery formats for analytics and AI applications
- Scalable solutions for startups, enterprises, and research firms
- Dedicated technical support with customized data workflows
Whether your goal is investment intelligence, competitive benchmarking, market forecasting, or portfolio optimization, Real Data API provides reliable regulatory data that supports informed and data-driven real estate decisions.
Conclusion
India's real estate market continues to evolve rapidly, making reliable regulatory intelligence essential for successful investment strategies. Organizations that leverage Real estate investment heat maps data scraping via RERA can automate property data collection, visualize high-growth markets, analyze regional investment trends, benchmark developer activity, and improve portfolio performance through structured analytics.
As digital transformation accelerates across the real estate industry, organizations investing in scalable RERA data solutions will gain greater visibility, reduce investment risks, and make faster, evidence-based decisions that drive sustainable growth.
Partner with Real Data API today to unlock powerful RERA-driven property intelligence, automate real estate data collection, and transform investment heat maps into actionable insights that fuel smarter real estate decisions!
Latest posts
How to Automate Properati Data Collection Using API for Smarter Real Estate Analytics

How to Scrape Rent.com Apartment Listings via API to Track Rental Prices, Availability & Market Trends?

How to Build Gaming Applications with PlayStation 4 Games API to Deliver Real-Time Game Data and Better User Experiences?

How Real Estate Investment Heat Maps Data Scraping via RERA Helps Investors Identify High-Growth Markets






.png)



