Introduction
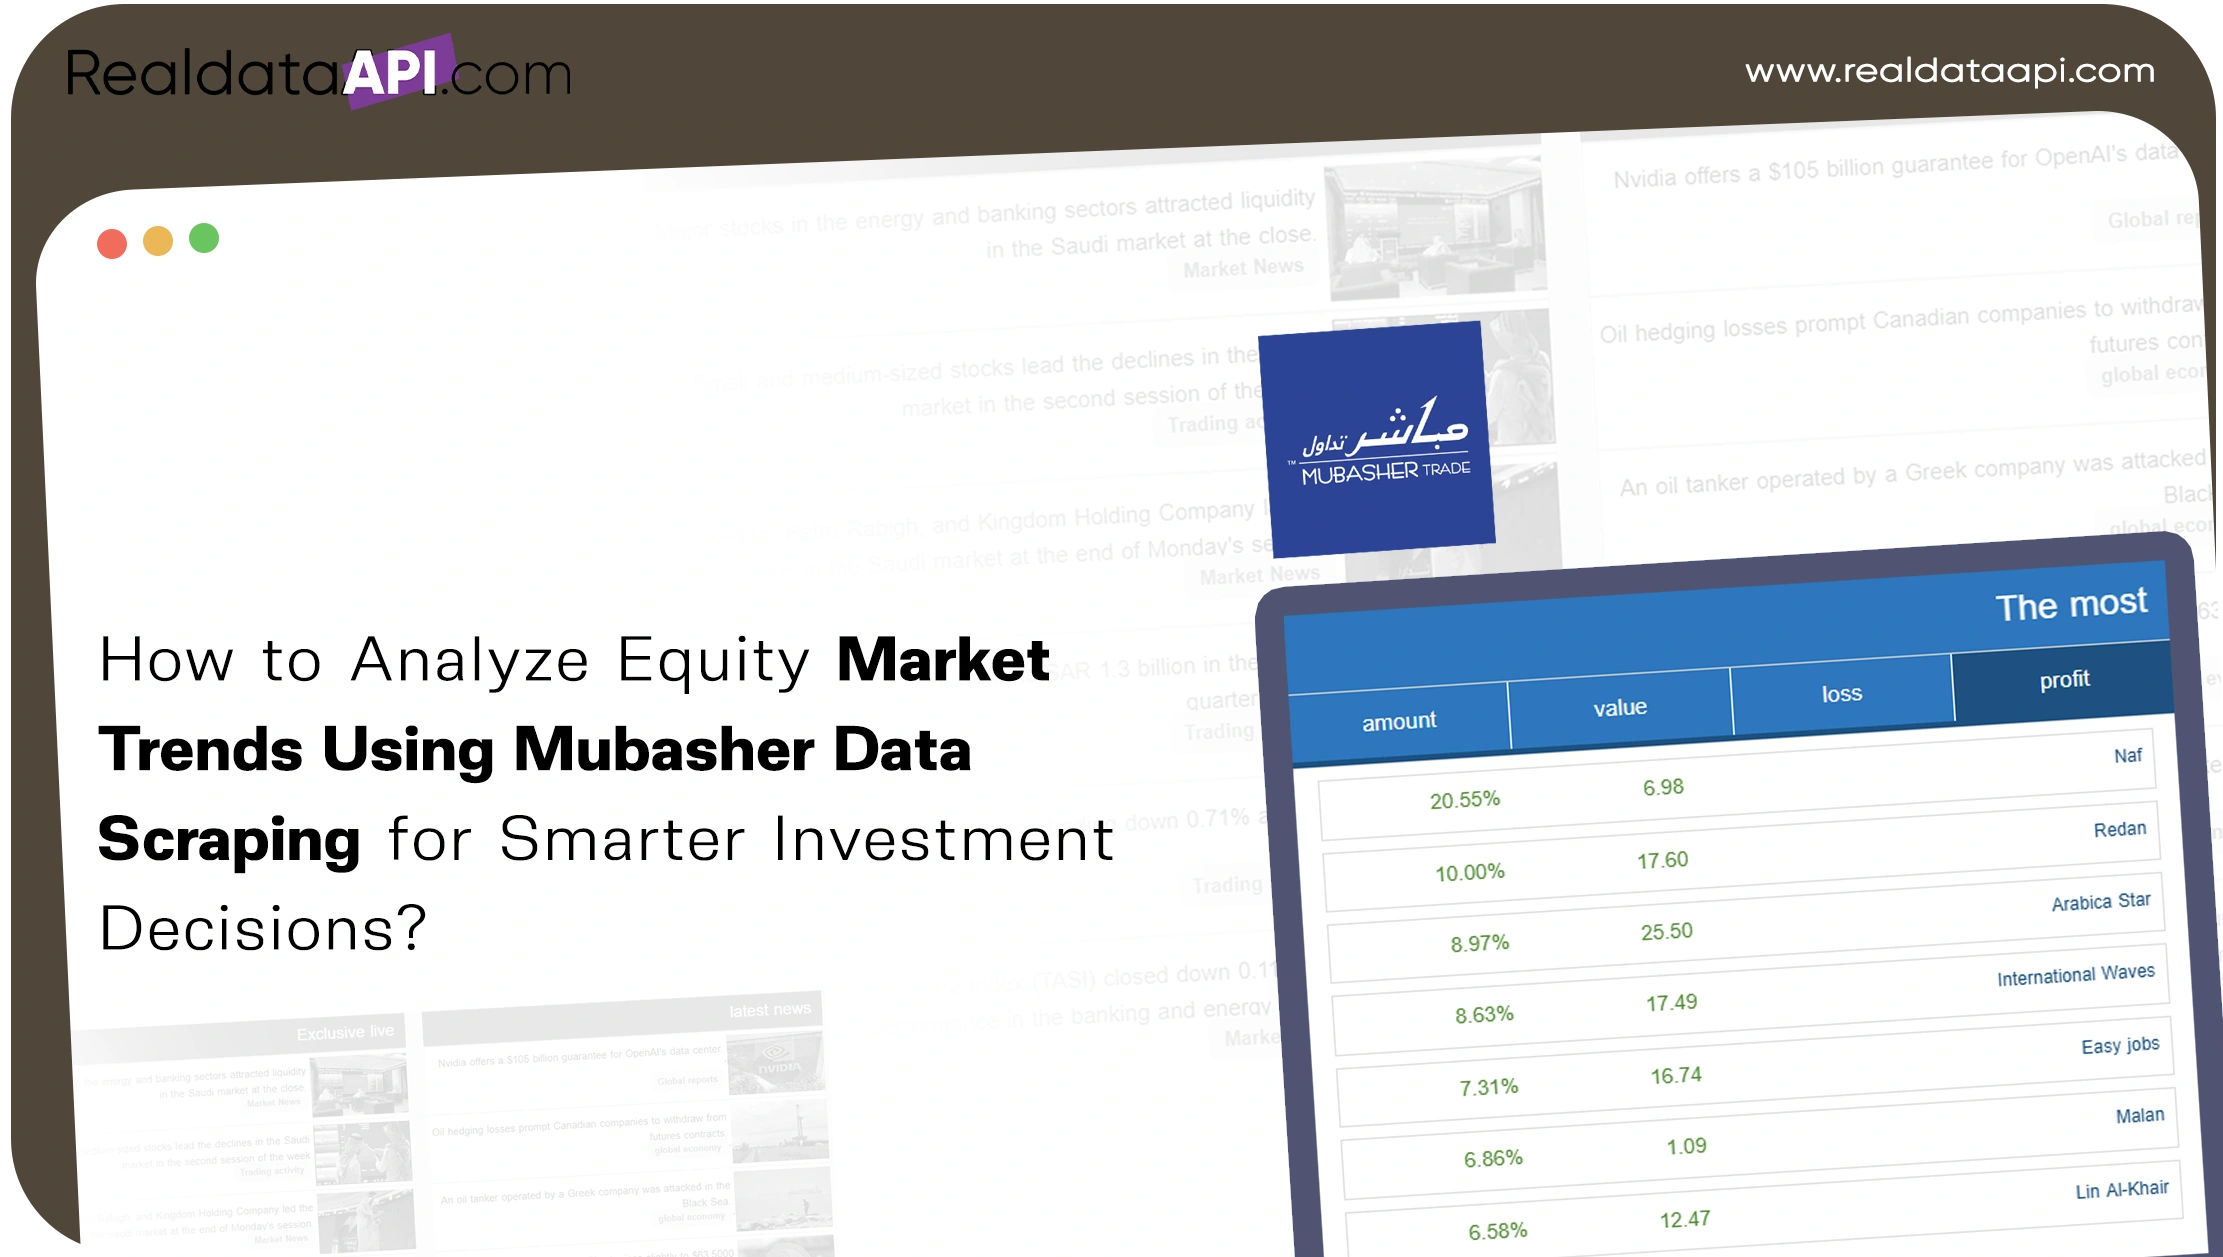
Analyze equity market trends using Mubasher data scraping to collect structured stock-market information, compare historical prices, monitor company performance, and identify changing market patterns. Automated financial data collection reduces manual research and gives analysts a consistent dataset for investment research, market monitoring, and reporting.
Industry context: Global equity markets generate enormous volumes of price and trading information every trading day. The figures below are illustrative planning indices, not audited Mubasher statistics.
| Year | Illustrative Market Data Demand Index | Illustrative Analytics Demand Index |
|---|---|---|
| 2020 | 100 | 100 |
| 2021 | 112 | 116 |
| 2022 | 126 | 130 |
| 2023 | 141 | 146 |
| 2024 | 158 | 163 |
| 2025 | 178 | 183 |
| 2026 | 201 | 207 |
For investors, brokers, financial researchers, and fintech companies, the key challenge is not finding one stock price. The challenge is building a reliable view of market movements across companies, sectors, and time periods.
A Finance and Stock Market Scraping API can help automate that process. It can deliver structured market information for dashboards, research systems, financial models, and analytical applications.
The core workflow is simple:
- Identify required market fields.
- Collect financial information.
- Standardize the records.
- Store historical observations.
- Compare price and market movements.
- Build analytical reports or dashboards.
How Can Mubasher Data Improve Financial Market Intelligence?
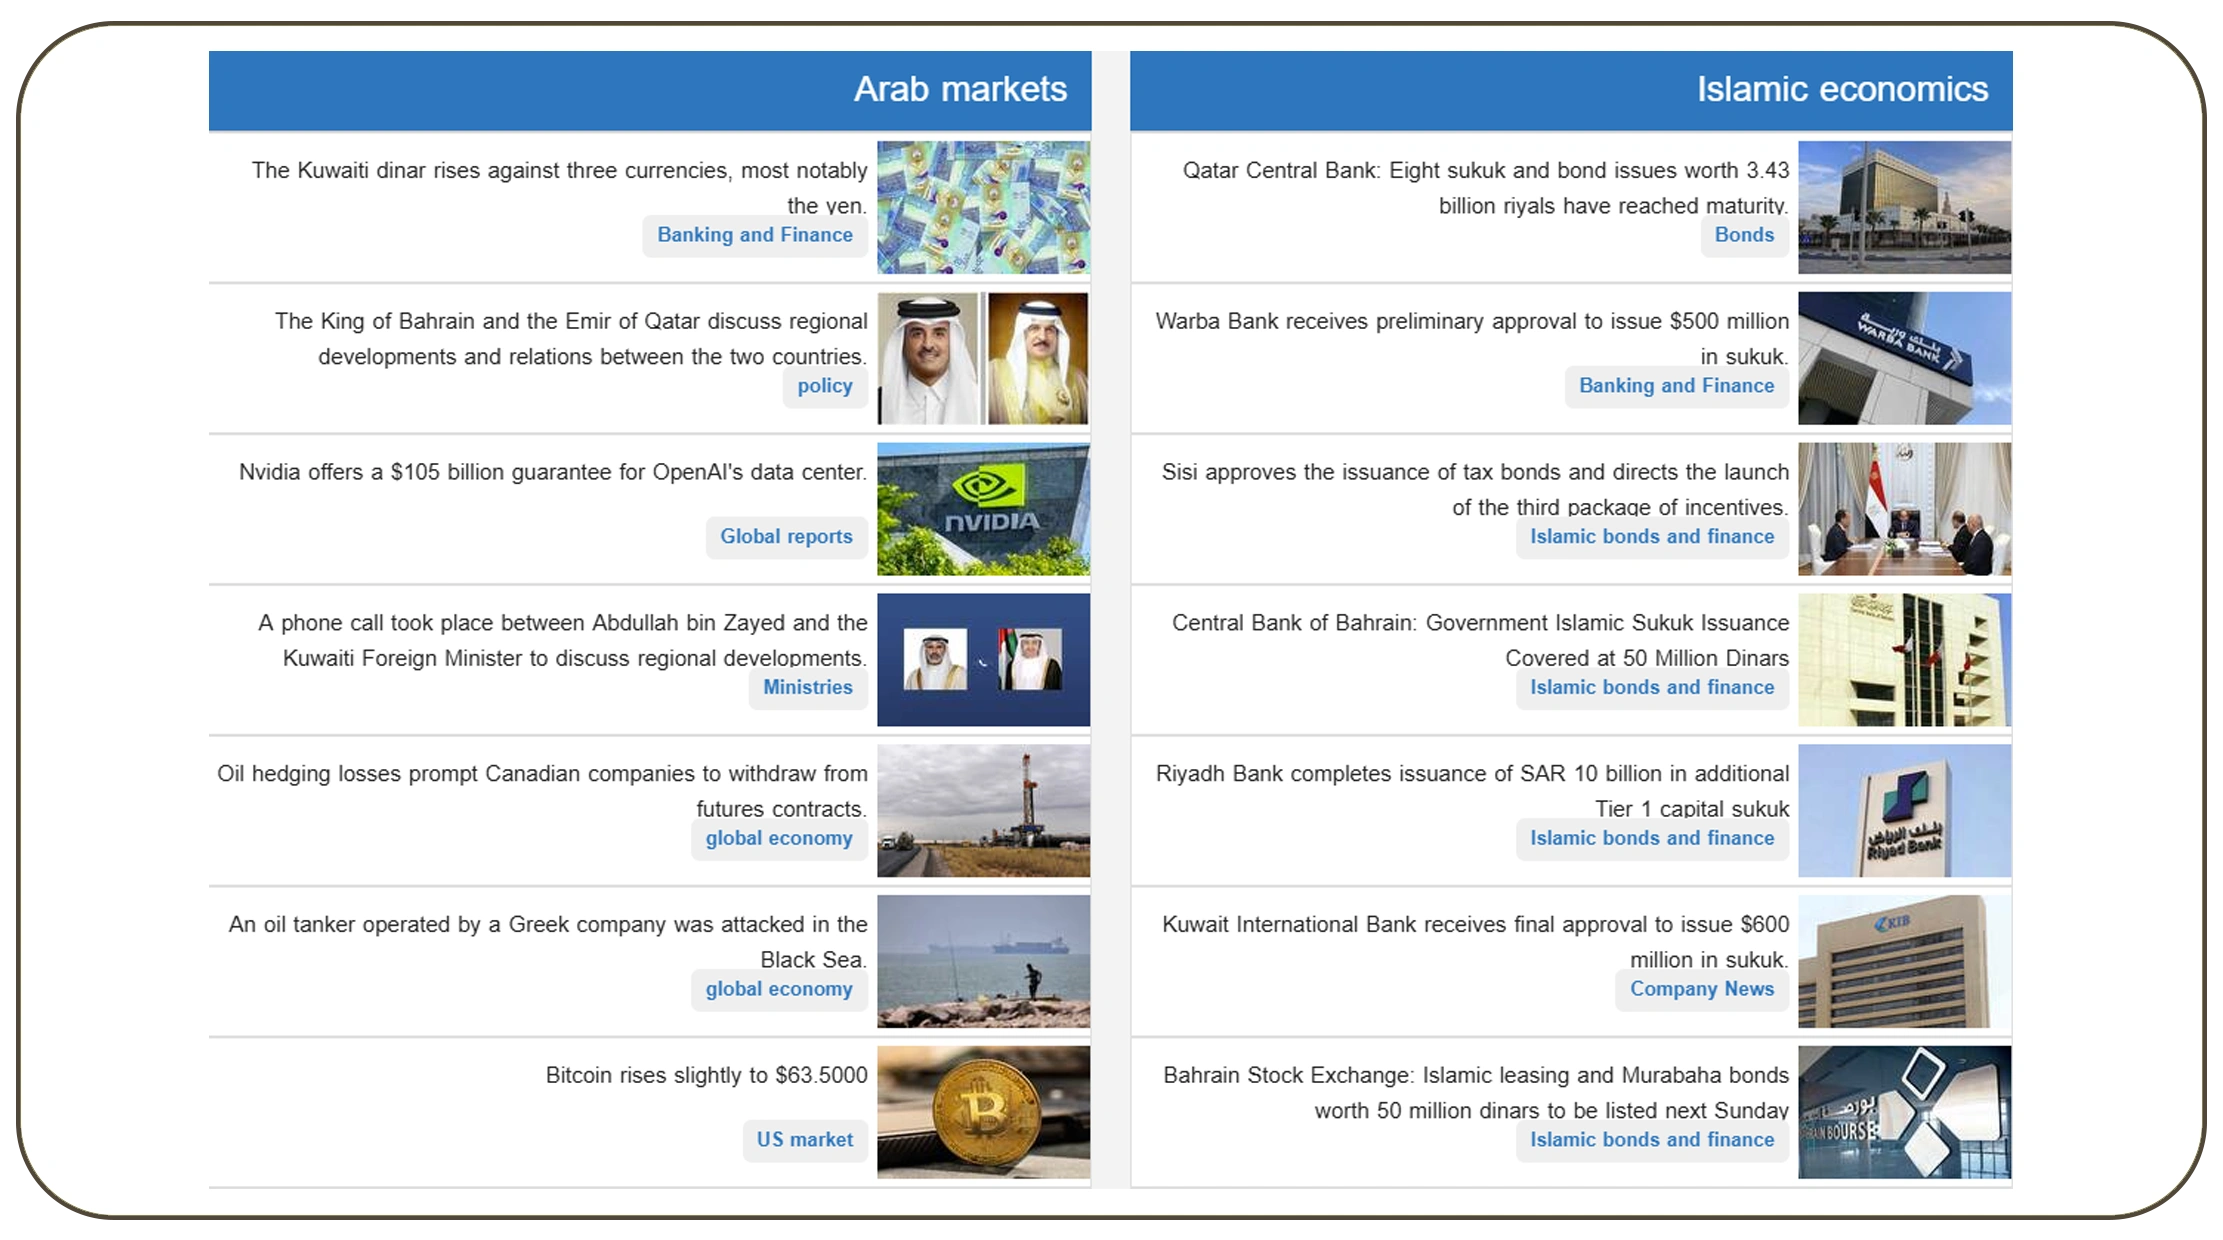
Financial market research requires timely and organized information. Analysts may need stock prices, company information, trading activity, historical observations, market categories, and other financial signals. Checking individual pages manually creates unnecessary work.
Web scraping Mubasher data for financial market intelligence can help organizations create structured datasets for financial analysis. Analysts can organize information by company, sector, date, price, and other relevant fields.
The biggest advantage is historical comparison. A single price provides limited insight. A time series can reveal direction, volatility, momentum, and changing market behavior.
For example, an analyst could compare a company's price movement with a broader sector index. Another team could monitor several companies and identify which stocks experienced the largest changes.
What Could the Demand for Financial Intelligence Look Like?
| Year | Data Collection Index | Historical Analysis Index | Research Automation Index |
|---|---|---|---|
| 2020 | 100 | 100 | 100 |
| 2021 | 110 | 114 | 118 |
| 2022 | 123 | 127 | 132 |
| 2023 | 137 | 141 | 147 |
| 2024 | 153 | 157 | 164 |
| 2025 | 171 | 176 | 184 |
| 2026 | 191 | 198 | 207 |
Illustrative indices for demonstrating data-intelligence requirements.
A structured dataset can support:
- Stock performance monitoring.
- Sector comparison.
- Historical trend analysis.
- Market research.
- Investment screening.
- Financial reporting.
- Portfolio research.
- Competitive analysis.
The important point is consistency. Analysts need comparable records across dates. Standardized data makes calculations easier and reduces repetitive research.
How Can Analysts Track Stock Prices Over Time?
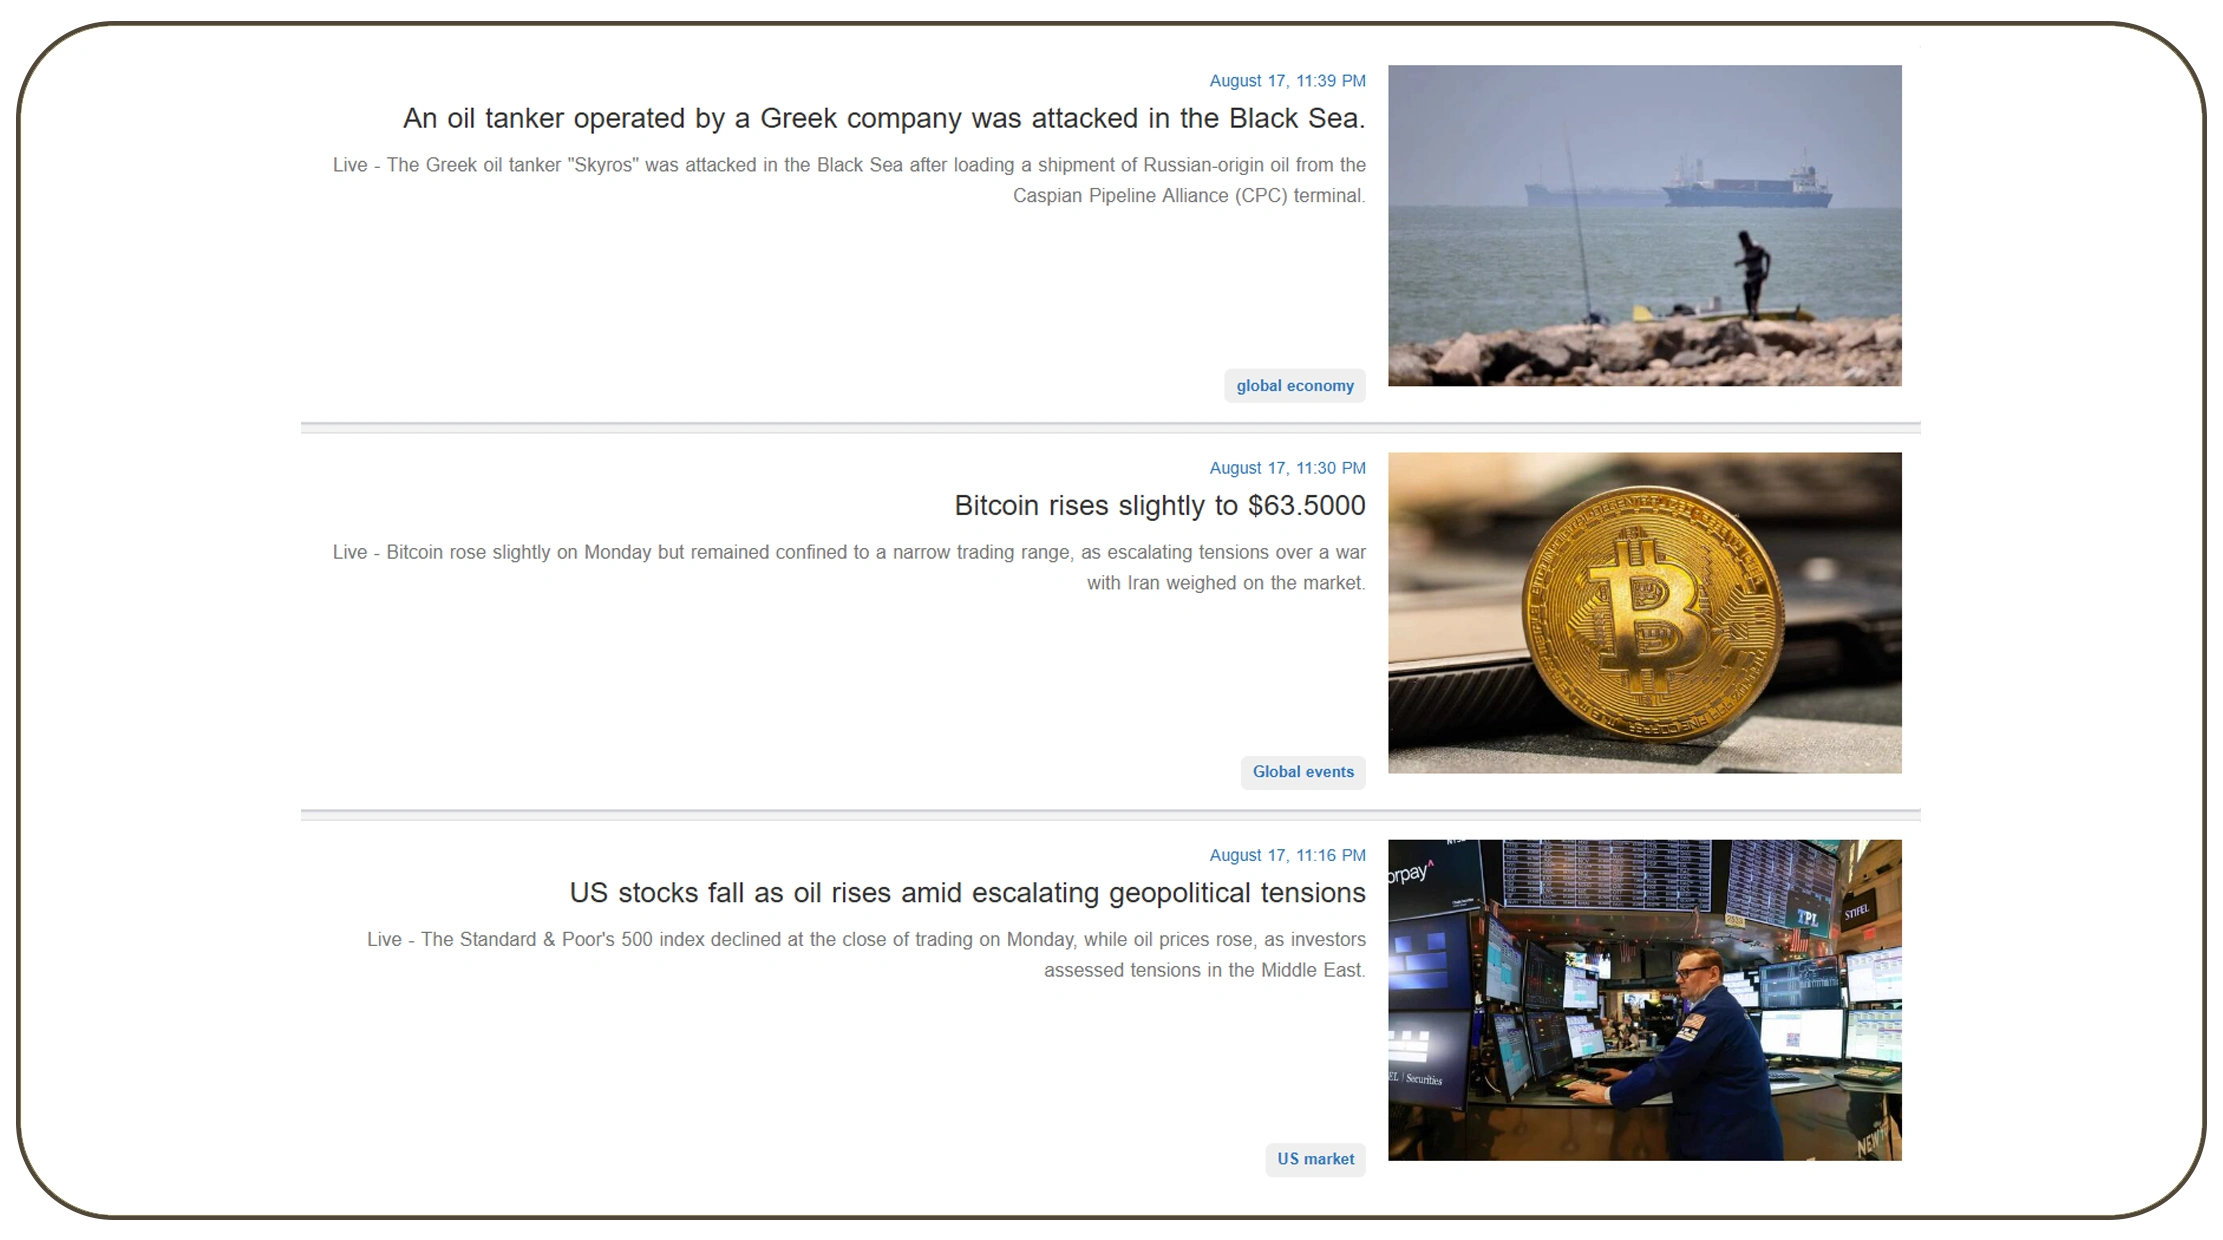
Stock prices can change frequently. Investors and researchers need historical information to understand those movements. Manual price collection can become difficult when analysts monitor dozens or hundreds of companies.
Scrape stock prices using Mubasher data workflows can help create structured historical datasets. Analysts can organize records by stock symbol, company, date, opening price, closing price, high, low, volume, and other available fields.
Historical data allows users to calculate useful indicators. These may include daily changes, percentage returns, moving averages, price ranges, and volatility measures.
Which Historical Metrics Can Analysts Monitor?
| Year | Price Tracking Index | Historical Data Index | Market Monitoring Index |
|---|---|---|---|
| 2020 | 100 | 100 | 100 |
| 2021 | 109 | 113 | 111 |
| 2022 | 120 | 127 | 124 |
| 2023 | 133 | 142 | 138 |
| 2024 | 148 | 159 | 153 |
| 2025 | 165 | 178 | 169 |
| 2026 | 184 | 199 | 188 |
Illustrative indices, not actual Mubasher market measurements.
A historical stock dataset can answer practical questions:
- Which stocks gained or lost value?
- Which sectors showed stronger movement?
- How did prices change over a selected period?
- Which companies experienced unusual volatility?
- How did individual stocks compare with sector performance?
The data can also feed internal dashboards. Analysts can filter by company, sector, date, or price movement.
For investment research, historical context matters. Current prices show where the market is today. Historical records help explain how it got there.
How Can Automated Data Collection Support Market Analysis?

Financial analysts often work with large amounts of information. Manual collection creates several problems. It takes time. It introduces inconsistencies. It can also make historical tracking difficult.
A Mubasher data scraper for financial market analysis can help automate repetitive collection tasks and create datasets that analysts can use for deeper research.
A typical workflow can include source identification, data extraction, cleaning, validation, storage, and delivery. Each step improves the usability of the final dataset.
For example, analysts can create a daily snapshot of selected equities. They can then compare today's records with previous observations.
How Could Financial Data Automation Develop?
| Year | Manual Research Burden Index | Automation Demand Index | Data Volume Index |
|---|---|---|---|
| 2020 | 100 | 100 | 100 |
| 2021 | 106 | 114 | 111 |
| 2022 | 115 | 129 | 125 |
| 2023 | 126 | 145 | 140 |
| 2024 | 139 | 163 | 157 |
| 2025 | 153 | 183 | 177 |
| 2026 | 168 | 206 | 199 |
Illustrative planning indices.
Automated data collection can support several analytical workflows:
- Daily monitoring: Track selected equities at regular intervals.
- Historical analysis: Store observations for time-series research.
- Sector comparison: Group companies by industry.
- Price screening: Identify stocks that meet defined criteria.
- Reporting: Generate structured financial reports.
- Dashboard creation: Feed data into business intelligence tools.
Automation does not replace financial judgment. It provides the information layer that analysts need before making informed decisions.
How Can Web Scraping Support Financial Research?
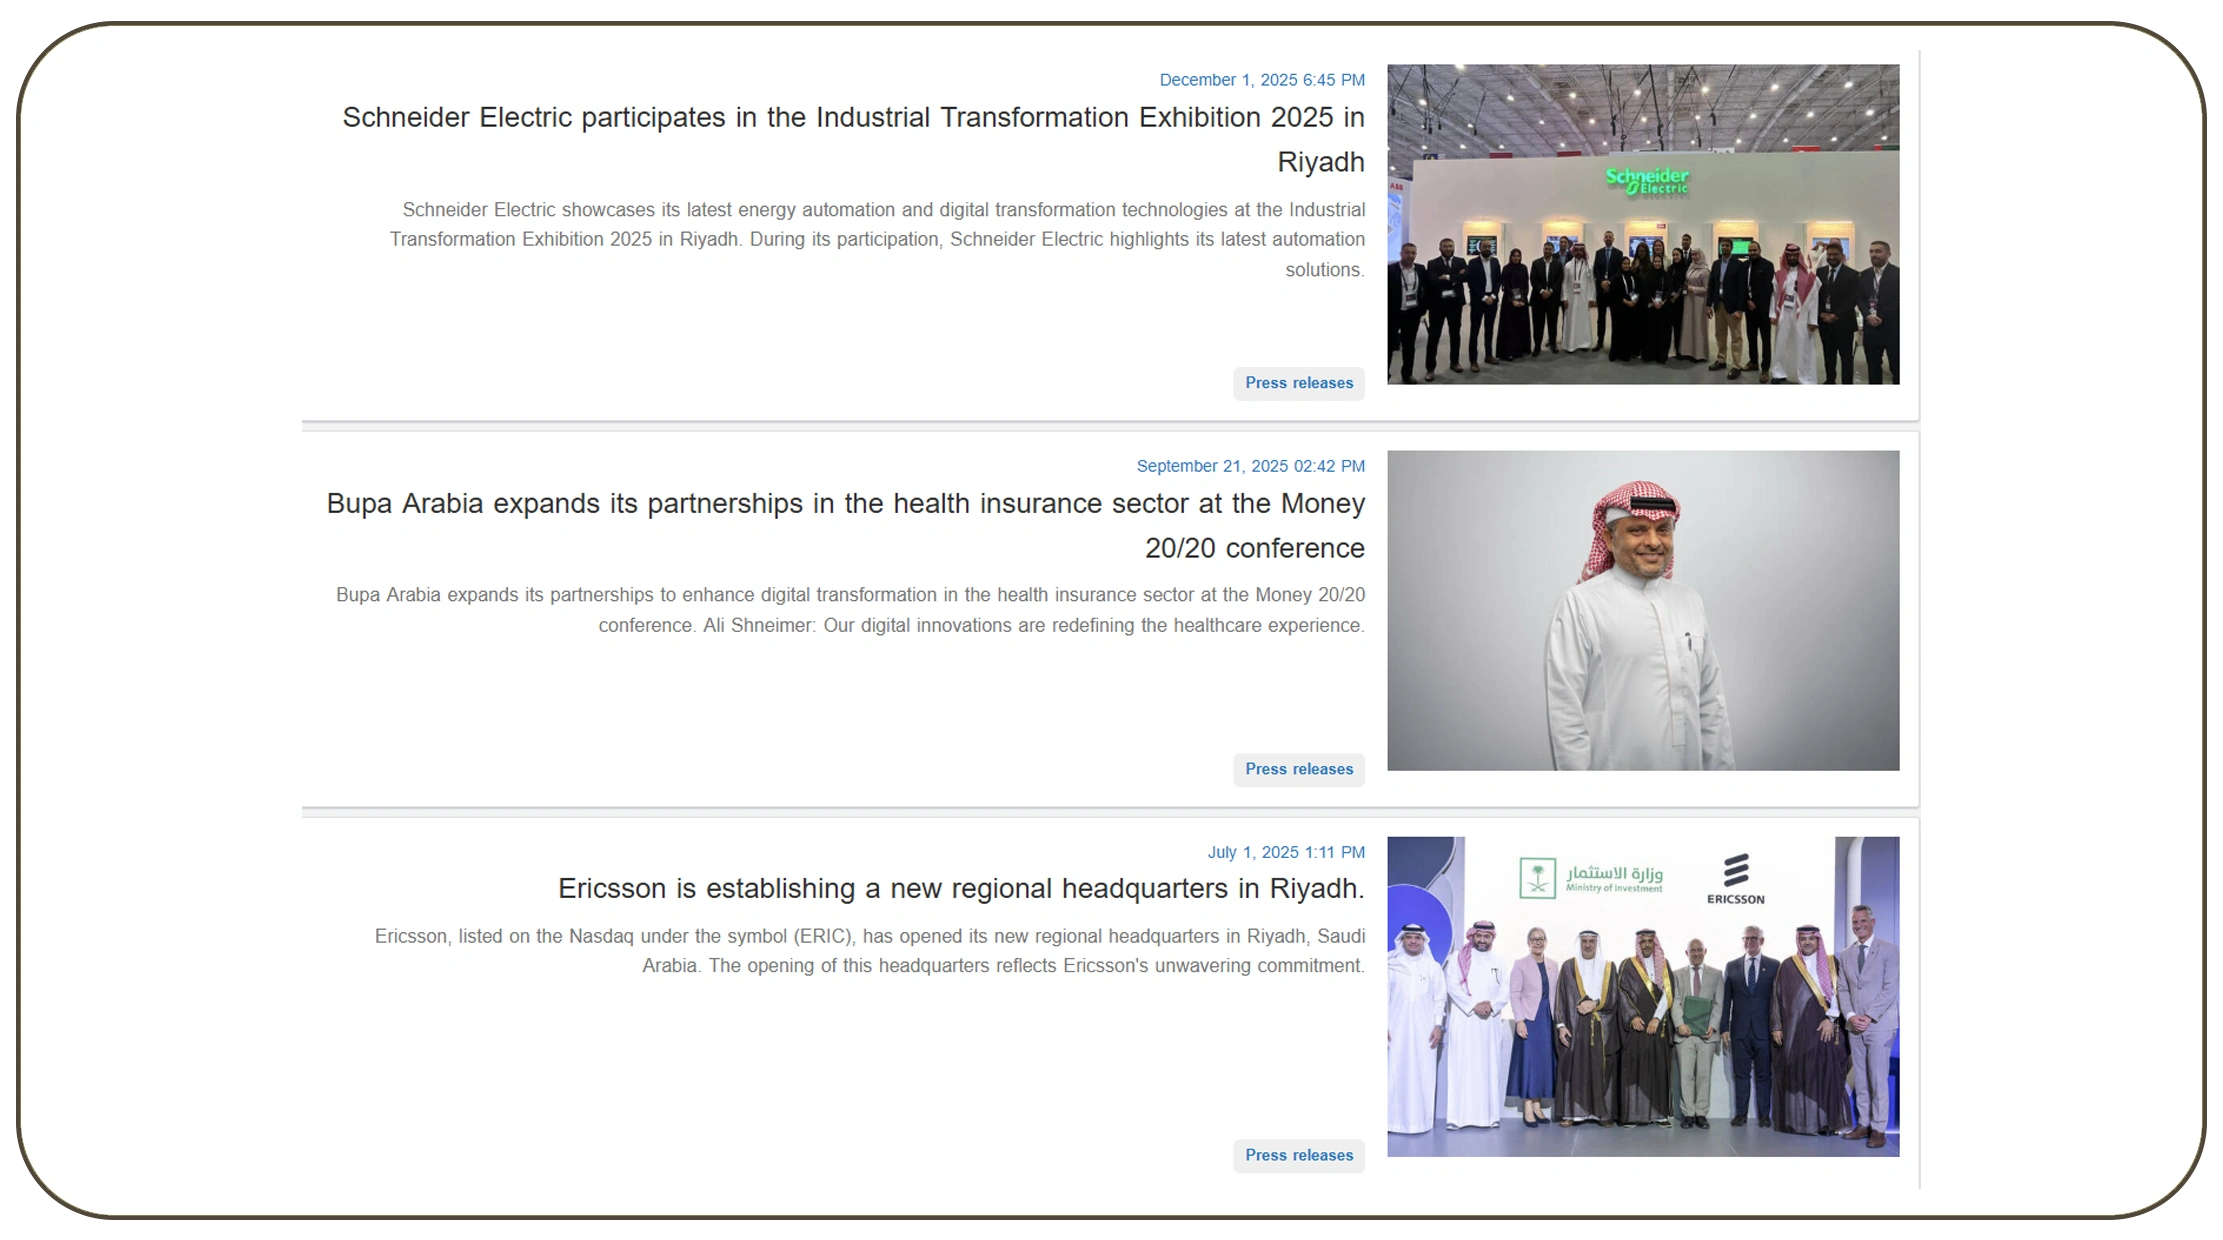
Web Scraping Services can help financial businesses collect information from digital sources according to their specific requirements. Each project may require different fields, refresh frequencies, historical coverage, and delivery formats.
A financial research team may need a focused dataset containing stock prices and company names. A fintech application may require broader fields and frequent updates.
The solution should match the business objective.
What Could a Financial Data Pipeline Deliver?
| Year | Data Coverage Index | Refresh Requirement Index | Research Complexity Index |
|---|---|---|---|
| 2020 | 100 | 100 | 100 |
| 2021 | 111 | 113 | 108 |
| 2022 | 124 | 128 | 119 |
| 2023 | 139 | 144 | 132 |
| 2024 | 156 | 161 | 147 |
| 2025 | 175 | 181 | 164 |
| 2026 | 196 | 204 | 183 |
Illustrative indices used to explain financial data requirements.
A useful financial collection project should define:
- Target markets.
- Target companies.
- Required data fields.
- Collection frequency.
- Historical requirements.
- Output format.
- Storage requirements.
- Data validation rules.
This planning reduces unnecessary collection and keeps the dataset focused.
Financial businesses can then use the resulting information for research dashboards, internal analytics, market reports, investment screening, and other applications.
Data quality also matters. Duplicate records and inconsistent formats can affect analysis. Cleaning and validation should therefore form part of the overall workflow.
How Can an API Make Financial Data Easier to Use?
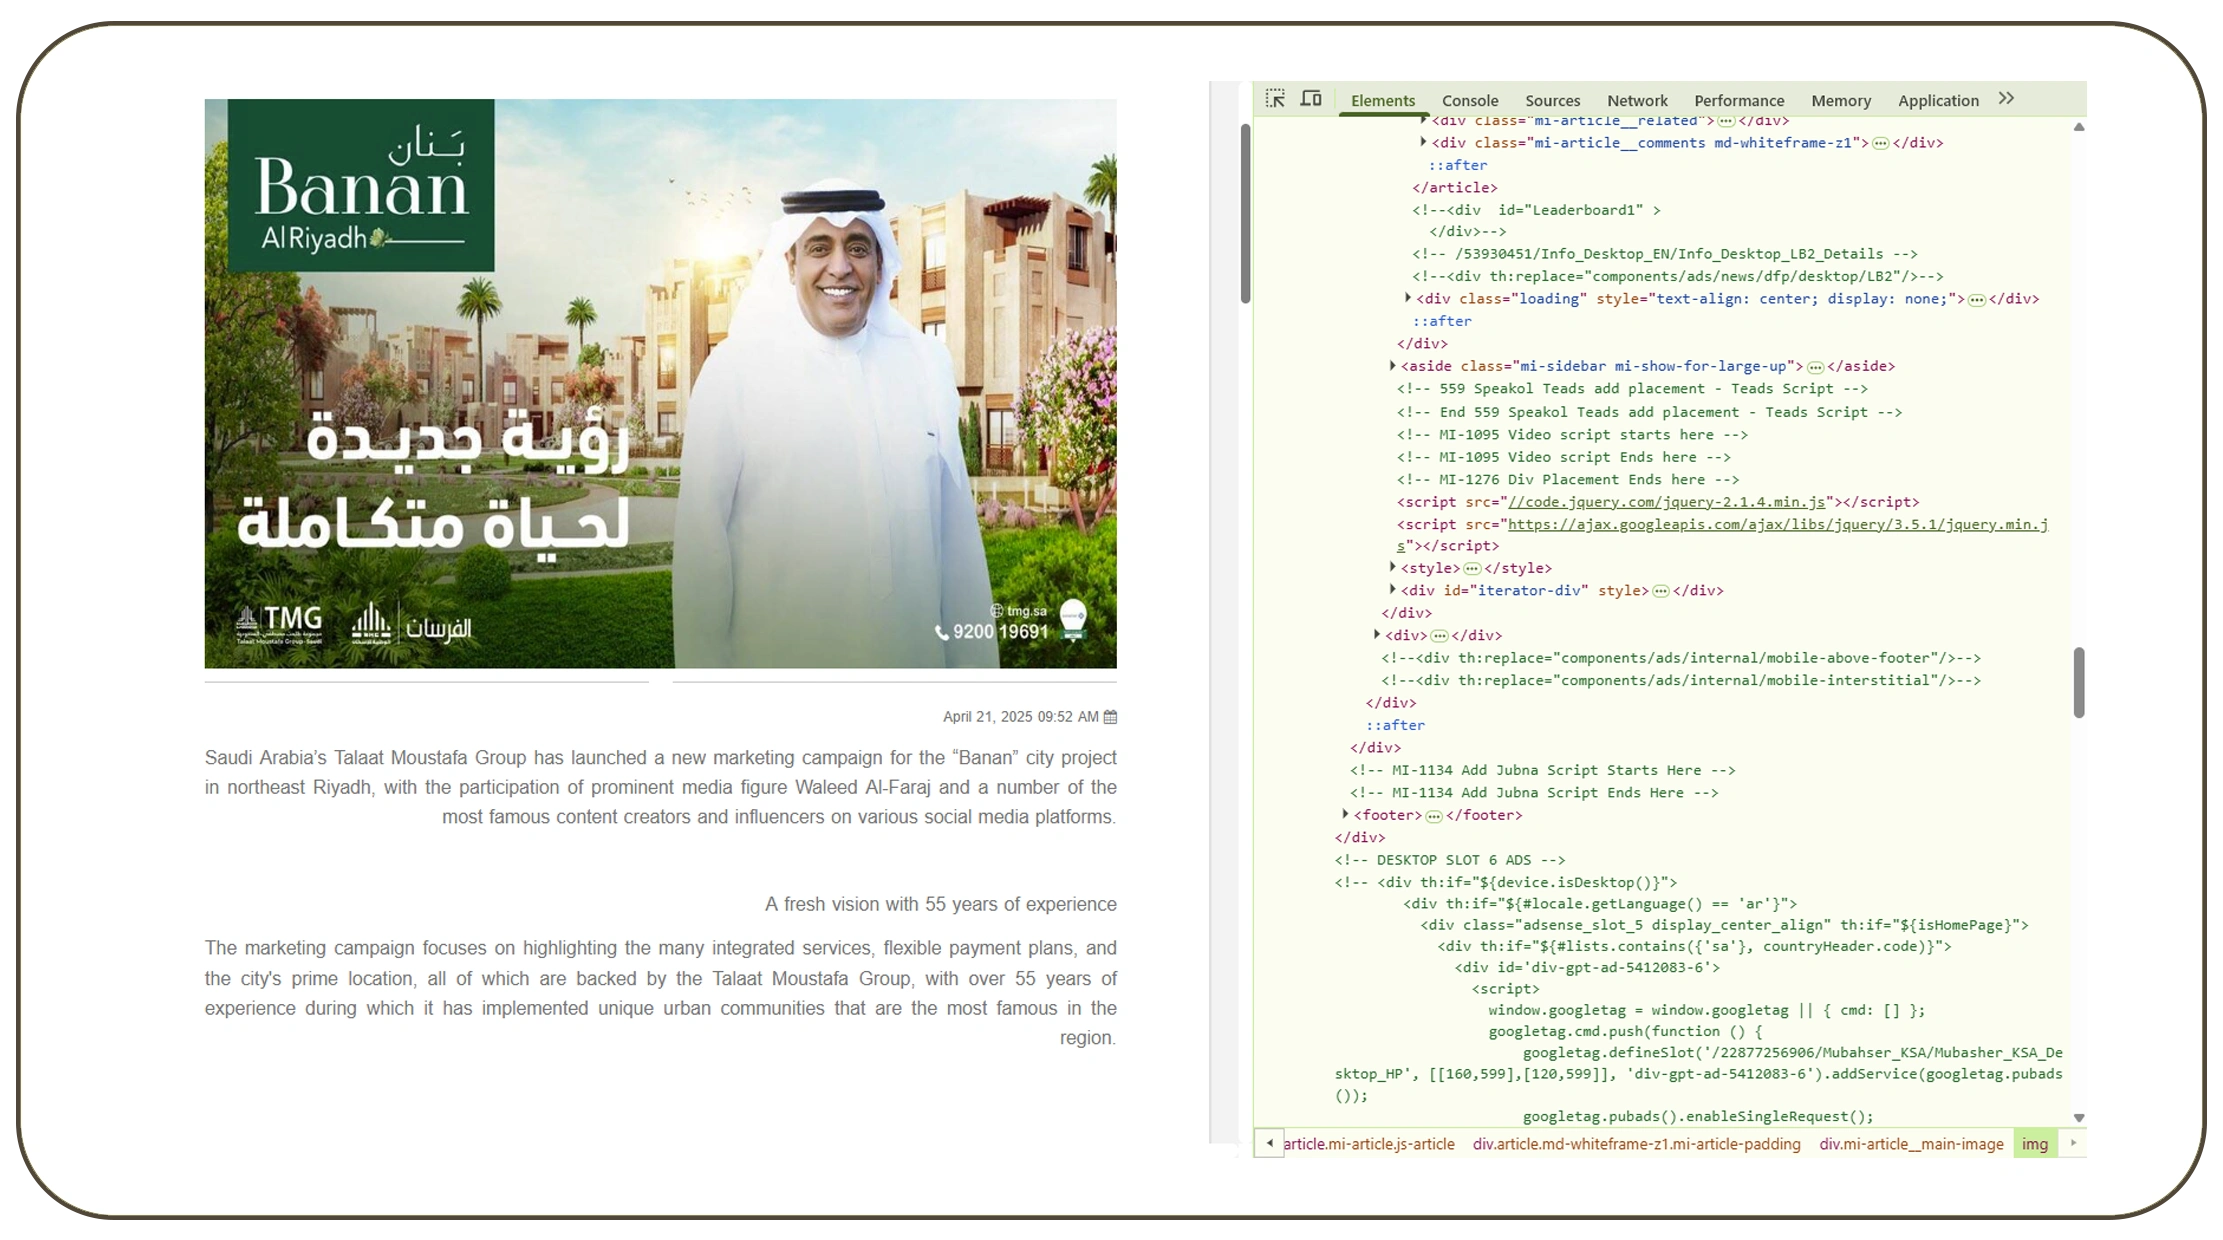
A Web Scraping API can provide a structured way to deliver collected information to applications, databases, dashboards, and analytics systems.
Instead of manually downloading information and preparing spreadsheets, businesses can integrate data into their existing workflows.
For example, a fintech company could use structured financial data to update an internal dashboard. A research organization could store historical records in a database. An analyst could use the dataset to create trend reports.
What Could API-Based Data Delivery Look Like?
| Year | API Integration Index | Automated Delivery Index | Analytics Usage Index |
|---|---|---|---|
| 2020 | 100 | 100 | 100 |
| 2021 | 114 | 116 | 112 |
| 2022 | 130 | 133 | 127 |
| 2023 | 147 | 151 | 143 |
| 2024 | 165 | 170 | 160 |
| 2025 | 185 | 191 | 179 |
| 2026 | 207 | 214 | 200 |
Illustrative indices, not measured API adoption statistics.
API-based delivery can make data more useful because businesses can connect collection with downstream systems.
The API approach also reduces repetitive manual handling. Analysts can spend more time interpreting market movements instead of repeatedly copying information into spreadsheets.
For organizations building financial products, this integration can also support automated workflows and recurring analytical processes.
How Can Market Research Turn Financial Data Into Actionable Insights?

Market Research becomes more effective when analysts can compare current market conditions with historical records.
Raw financial data does not automatically create an investment insight. Analysts must organize the information and identify meaningful patterns.
For example, a research team could examine:
- Price movements.
- Trading activity.
- Sector performance.
- Historical returns.
- Market volatility.
- Company-level trends.
- Relative performance.
- Changes over selected periods.
How Could Market Research Requirements Evolve?
| Year | Market Research Index | Historical Comparison Index | Data-Driven Decision Index |
|---|---|---|---|
| 2020 | 100 | 100 | 100 |
| 2021 | 110 | 112 | 114 |
| 2022 | 123 | 126 | 129 |
| 2023 | 137 | 141 | 145 |
| 2024 | 153 | 158 | 163 |
| 2025 | 171 | 177 | 184 |
| 2026 | 190 | 198 | 207 |
Illustrative market-research indices.
A practical research workflow can follow five steps:
- Collect: Gather relevant equity information.
- Clean: Remove duplicates and standardize fields.
- Compare: Analyze companies, sectors, and time periods.
- Visualize: Build charts and dashboards.
- Interpret: Identify trends and research opportunities.
This process helps transform a large dataset into understandable information.
For example, a researcher can compare several companies over five years. Another can identify sectors with stronger historical growth. A portfolio research team can create screening rules based on selected market metrics.
The final decision still requires professional judgment. Data provides evidence. Analysis provides context. Investment decisions should consider risk, objectives, market conditions, and other relevant factors.
Why Choose Real Data API?
Analyze equity market trends using Mubasher data scraping with a structured data workflow designed around your research requirements. Real Data API can help businesses move from manual market research toward scalable financial data collection.
A tailored solution can support:
- Structured financial datasets.
- Historical market records.
- Automated collection workflows.
- Data cleaning and normalization.
- API-based delivery.
- Custom field selection.
- Recurring data updates.
- Research and analytics integration.
The right solution depends on the target markets, companies, required fields, refresh schedule, and intended use.
Real Data API can help organizations build a workflow that fits those requirements rather than forcing analysts to work with generic datasets.
For financial researchers, data consistency is especially important. Historical observations need to follow a comparable structure. Regular updates need to follow a predictable process. Analytical teams need information in formats that integrate with their existing tools.
A structured API approach can support these requirements while reducing repetitive collection work.
The result is a more efficient foundation for dashboards, financial research, market monitoring, and analytical applications.
Conclusion
Analyze equity market trends using Mubasher data scraping to create structured financial datasets that support stock-price monitoring, historical comparison, company research, sector analysis, and market intelligence.
The strongest approach combines automated collection with careful data validation and historical storage. Analysts can then compare market movements over time instead of relying only on individual snapshots.
Real Data API can help businesses develop scalable solutions for financial information collection and delivery. These solutions can support research teams, fintech companies, investment analysts, financial publishers, and organizations that need structured market intelligence.
Automated workflows can reduce manual research while improving consistency. Historical datasets can reveal patterns that are difficult to identify from isolated observations. API delivery can also connect market data with dashboards, databases, and analytical applications.
The goal is not simply to collect more financial data. It is to make relevant data easier to access, compare, analyze, and use.
Contact Real Data API for customized market data scraping, Web Scraping Services, API-based data collection, and real-time financial dataset solutions tailored to your research requirements!
Latest posts
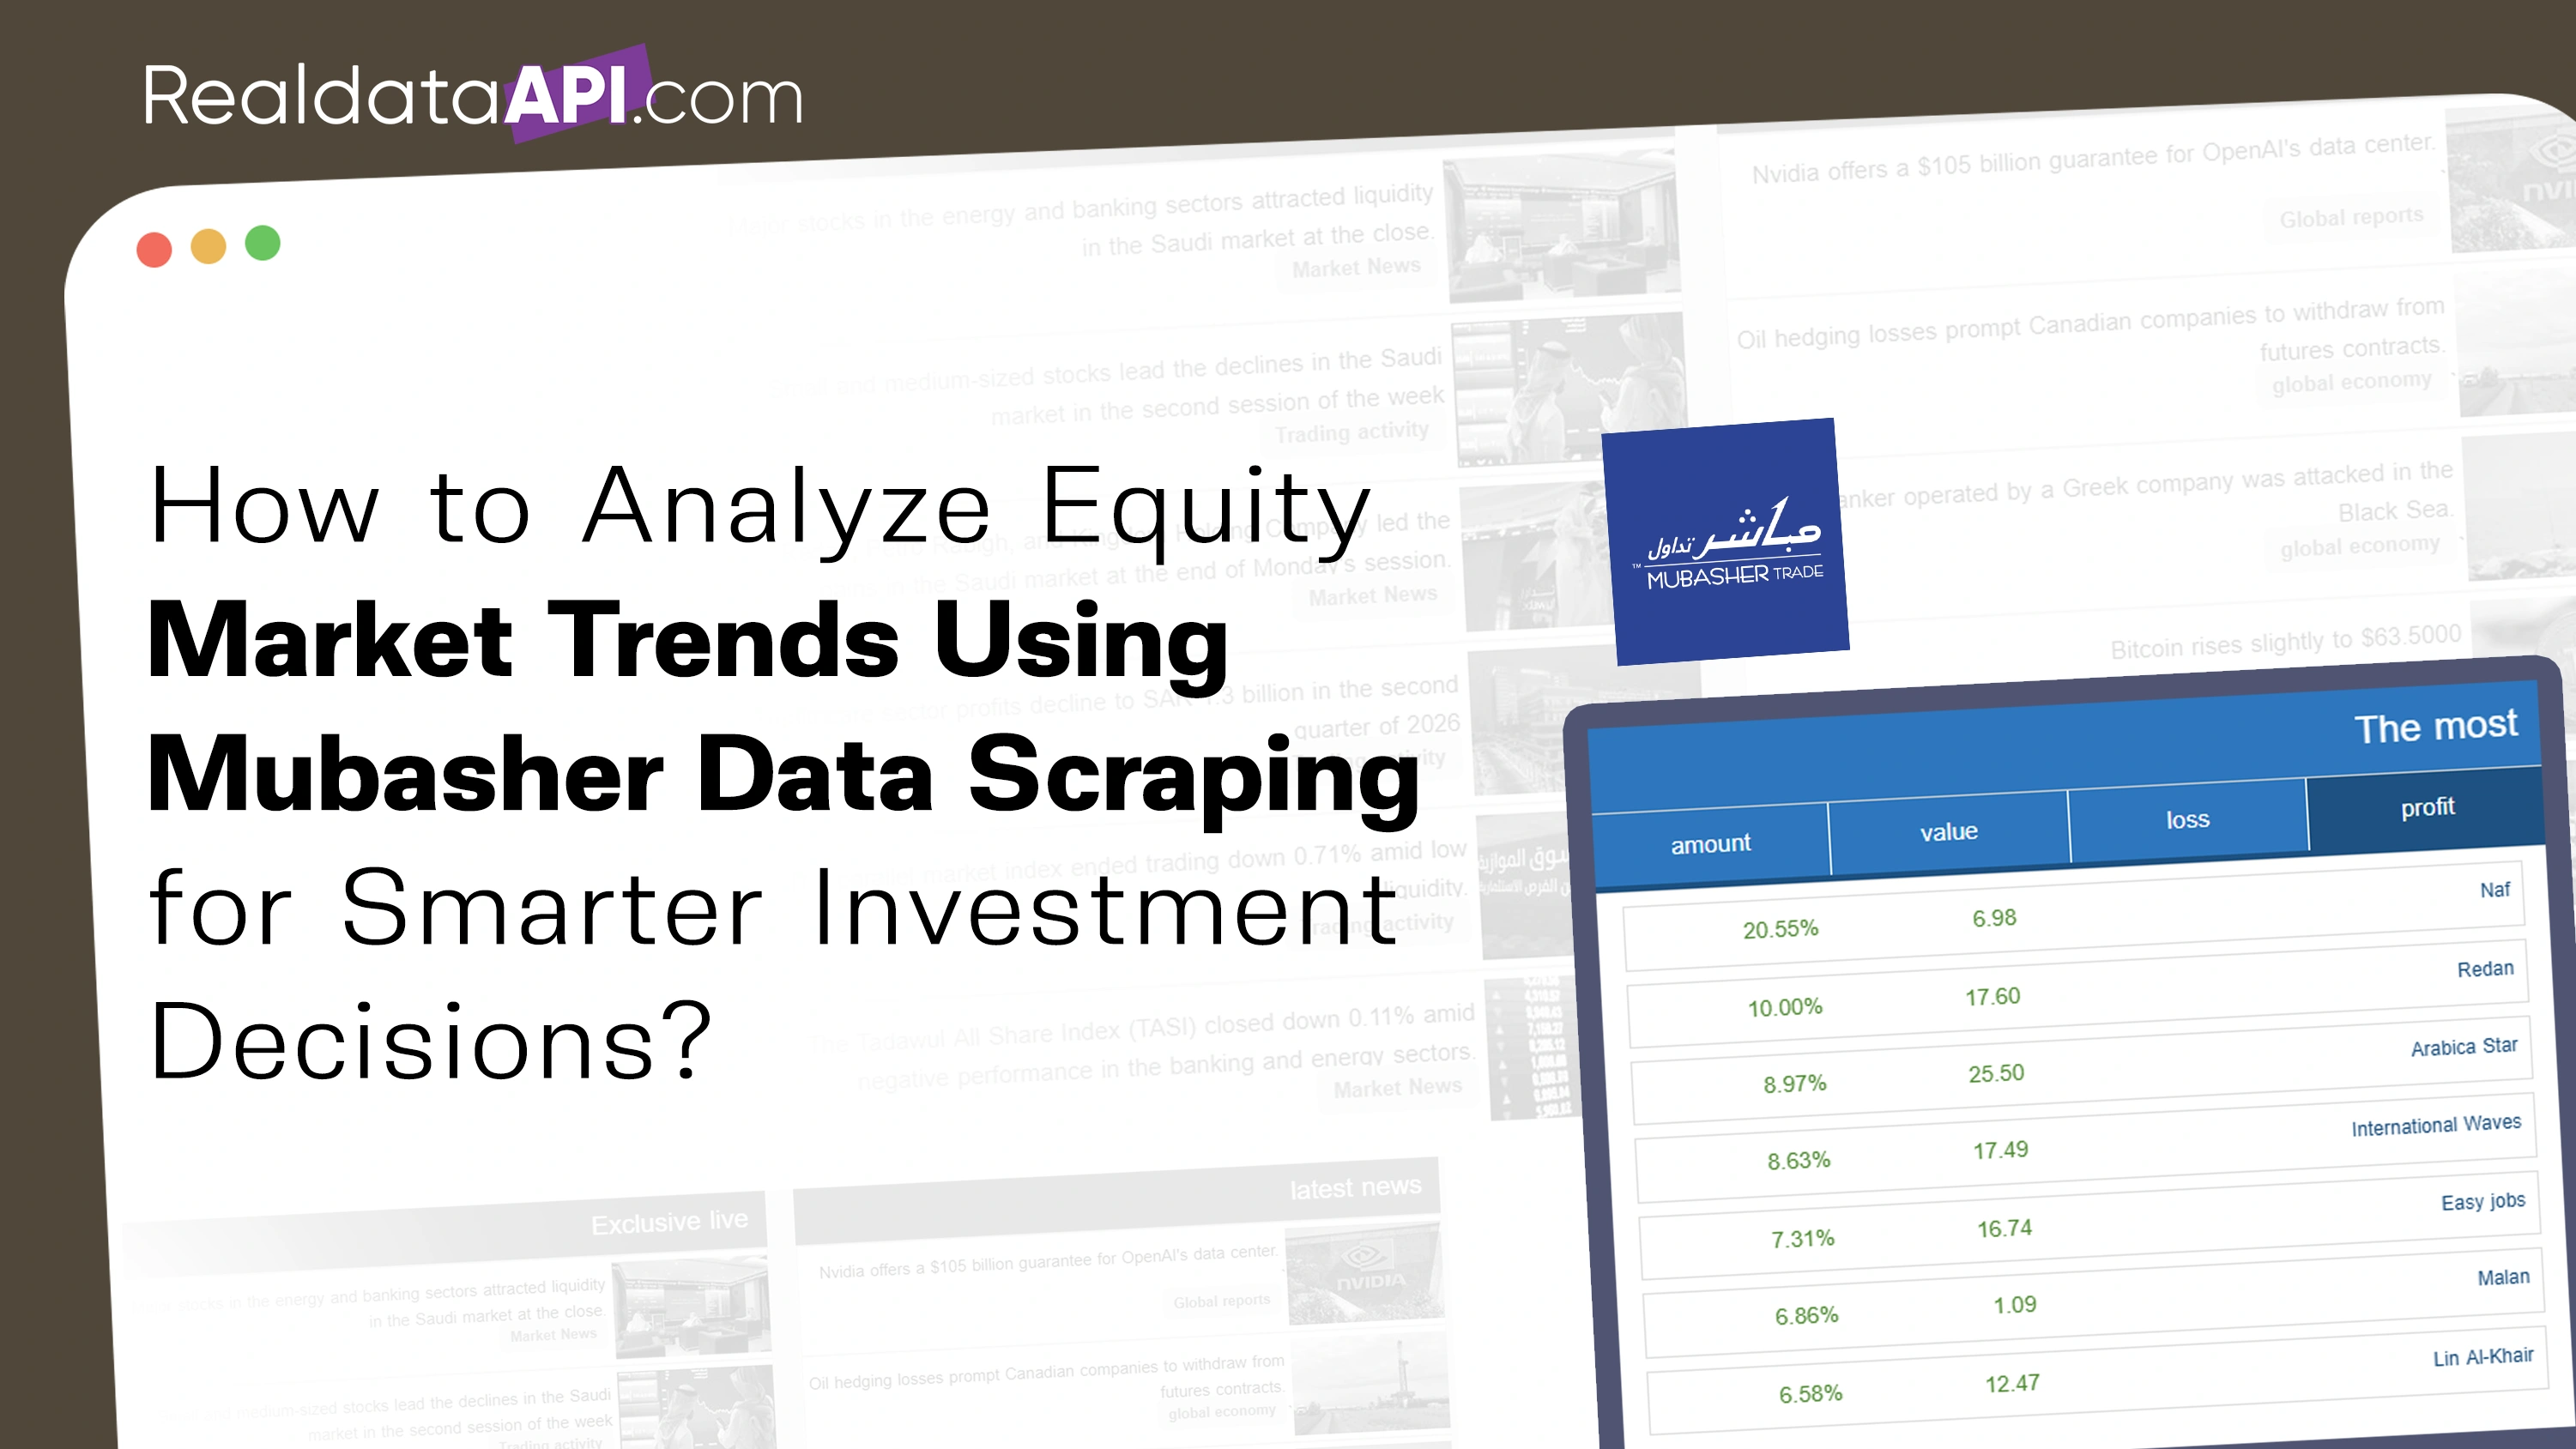
How to Analyze Equity Market Trends Using Mubasher Data Scraping for Smarter Investment Decisions?

How To Identify Grocery Demand Trends And Competitor Gaps With Flaschenpost Scraped Data For Grocery Market Analysis?
How to Extract Meesho product data for seller analytics for Better Business Insights?

How to Scrape OpenRent property data for UK rental market trends for Better Market Insights?







.png)



