Introduction
Cookpad recipe data scraping for global food trends helps food brands, retailers, restaurants, CPG companies, and market researchers identify emerging recipes, ingredients, cuisines, and consumer preferences from structured recipe information. By analyzing recipe titles, ingredients, cuisines, cooking methods, popularity signals, and regional patterns, teams can spot food trends earlier and make better product and menu decisions.
Cookpad describes itself as a global cooking community with millions of members. Its current platform also publishes changing popular ingredients, popular dishes, and trending keywords, showing how recipe platforms can provide useful signals for food research.
A Cookpad Delivery API can be considered as part of a broader data-integration strategy where permitted structured data is delivered into business systems. The exact availability and terms of any platform API should always be verified before implementation.
Target audience: Food brands, CPG companies, restaurant groups, grocery retailers, food-tech startups, and market research teams.
Core pain point: Manual recipe research makes it difficult to track fast-changing food preferences across countries, ingredients, cuisines, and time periods.
Recipe data can help teams answer practical questions:
- Which ingredients are gaining attention?
- Which dishes are becoming more popular?
- Which cuisines are expanding into new markets?
- Which recipes are seasonal?
- Which ingredients frequently appear together?
- Which dietary preferences are emerging?
- Which food trends persist beyond short-term hype?
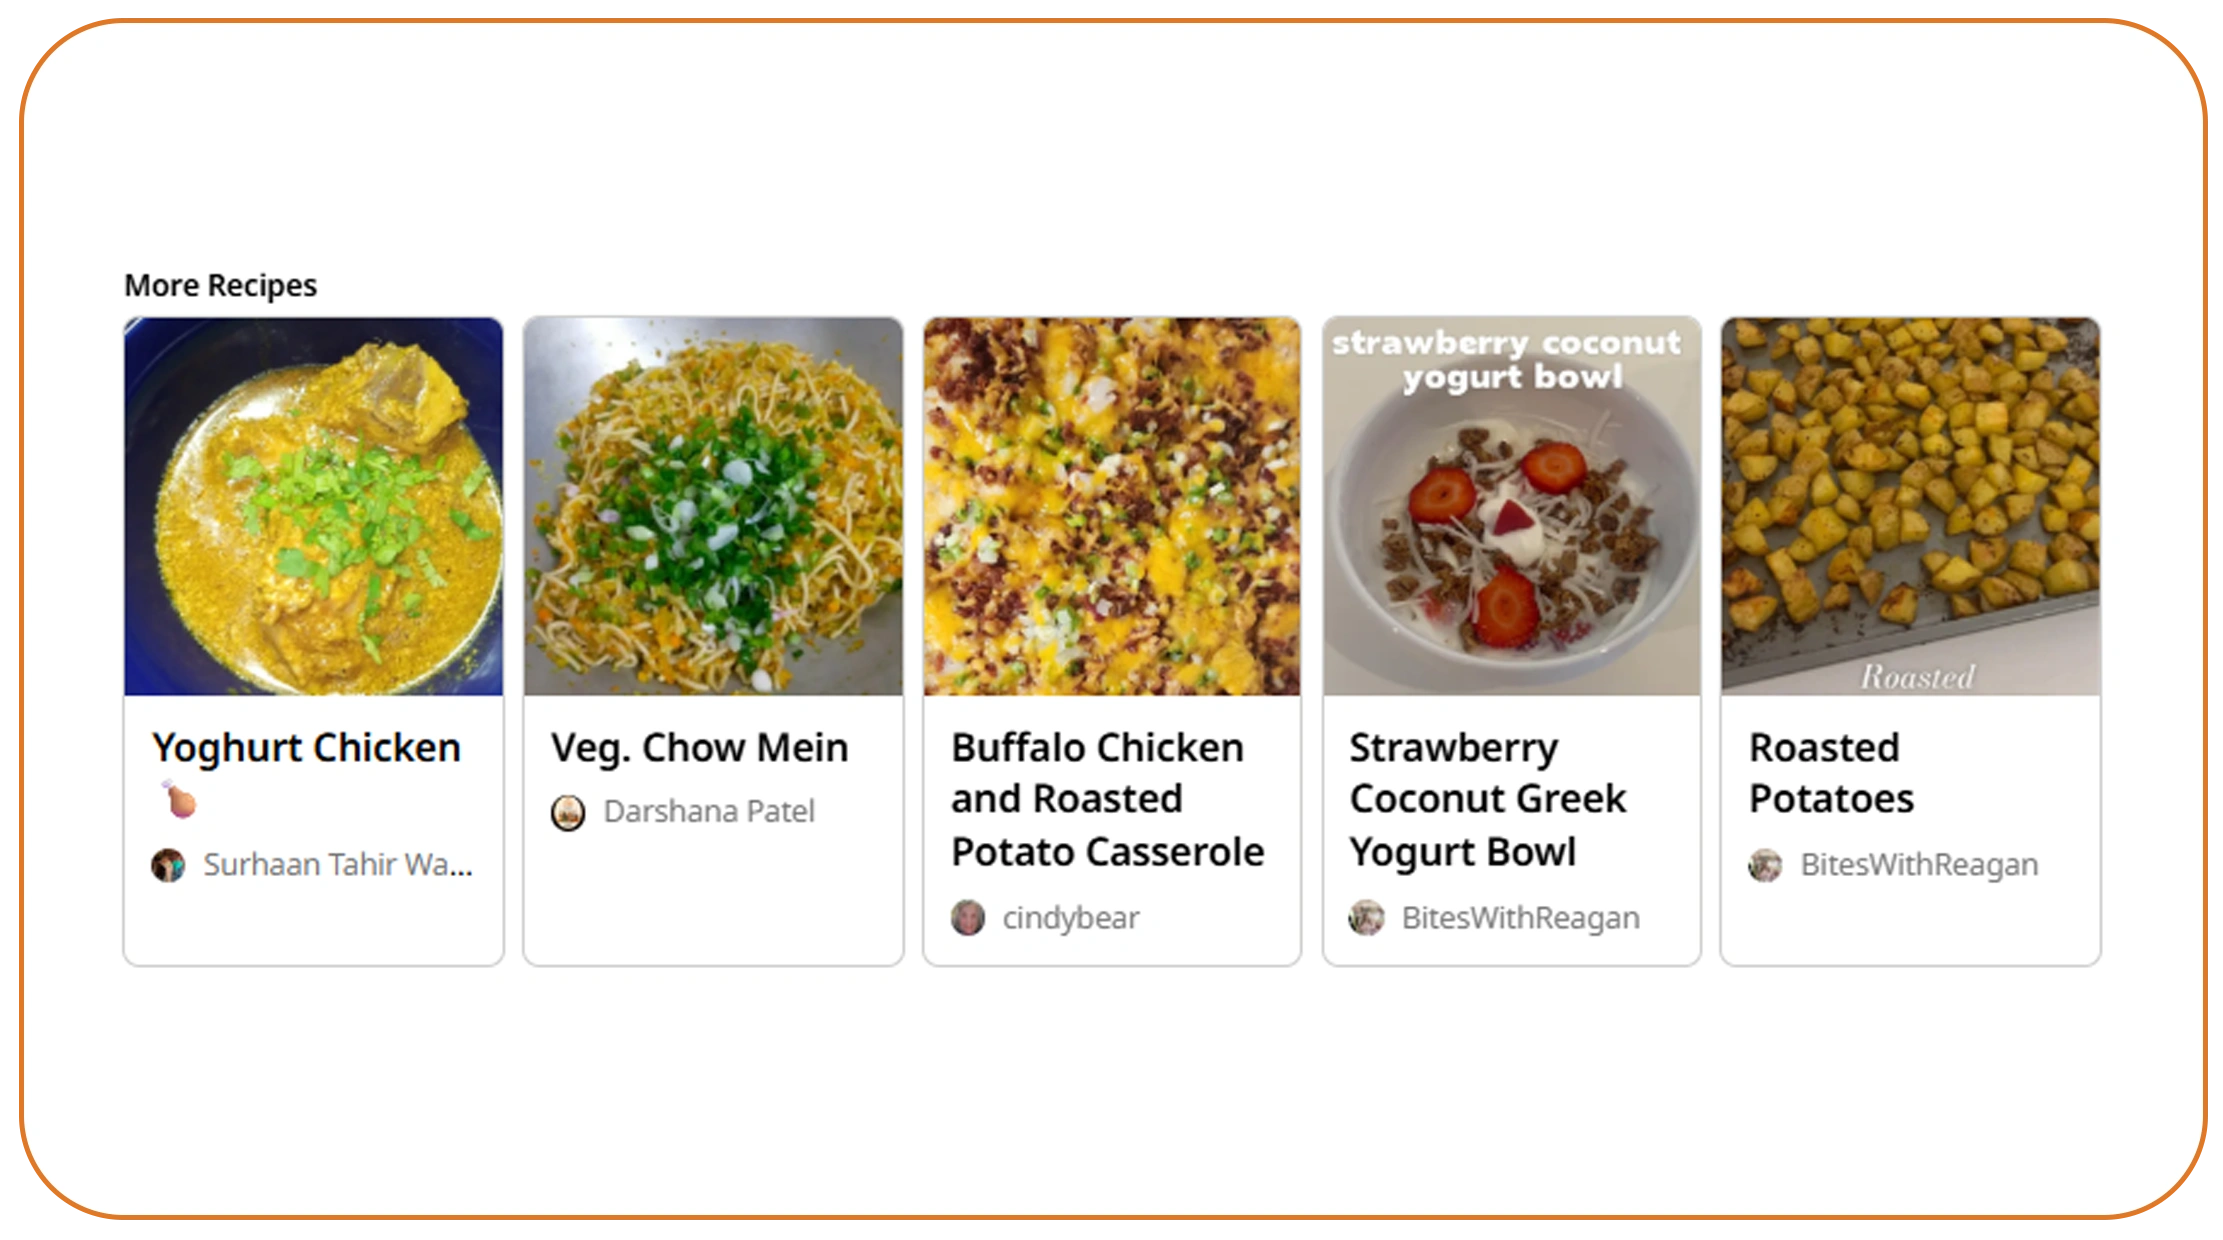
Cookpad's public pages currently show trending keywords such as potato, dinner, bread, breakfast, salad, paneer butter masala, and other terms depending on region and date.
The important point is simple: recipe data does not directly measure every consumer purchase. It provides observable cooking and content signals. When combined with retail, menu, search, social, and sales data, it can create a stronger picture of food demand.
How Can Recipe Data Support Food Market Research?
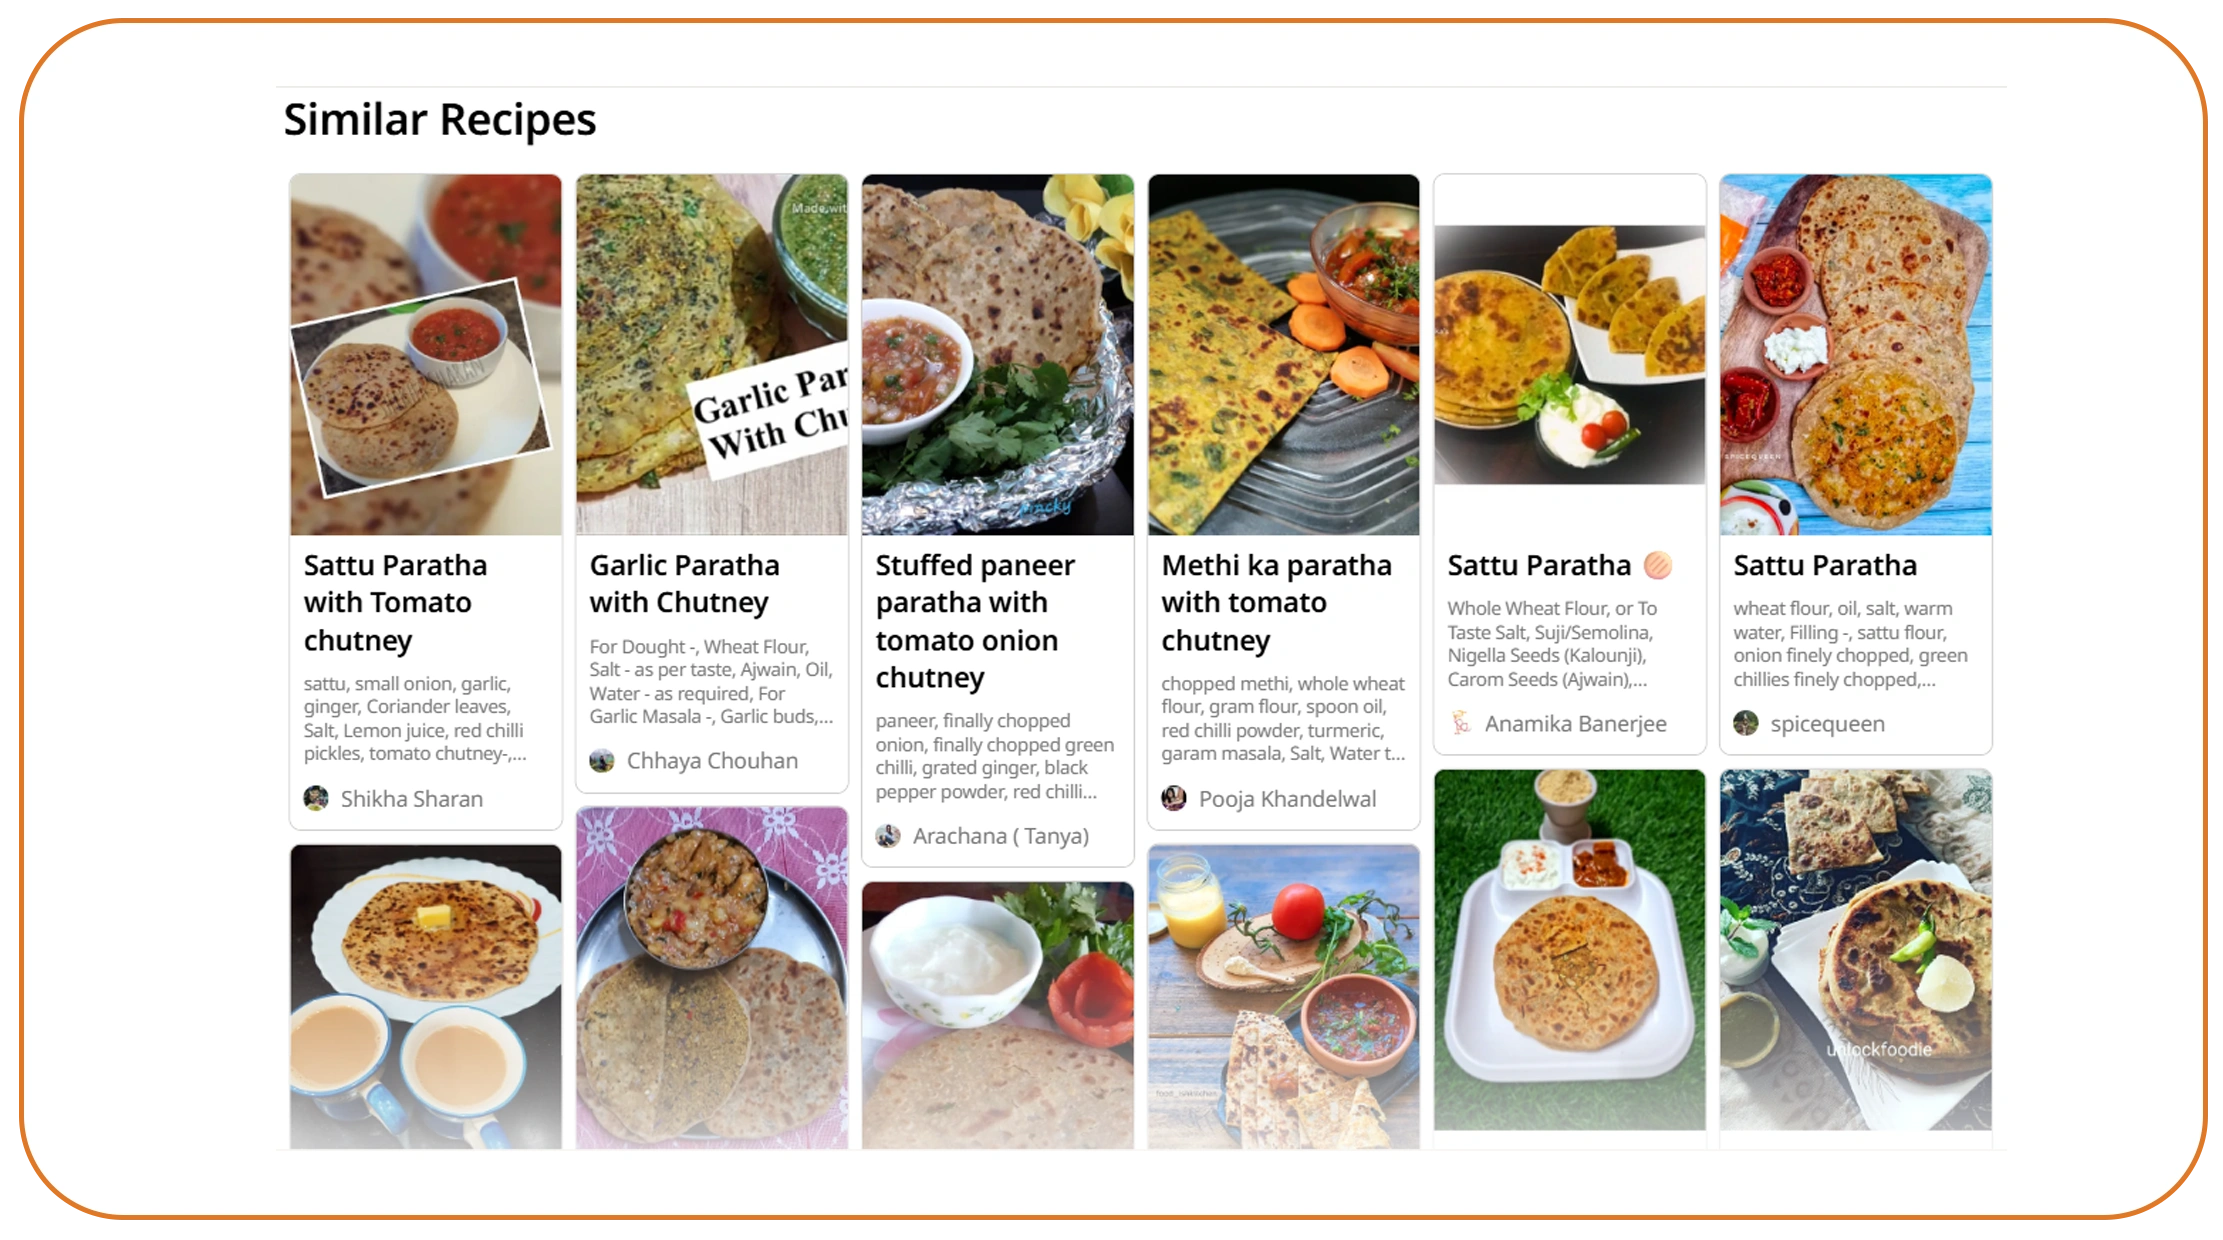
Extract Cookpad recipe data for food market research workflows can turn recipe pages and other permitted public information into structured records. This makes large-scale analysis easier than manually reviewing recipes one by one.
A useful dataset may contain recipe title, ingredient list, cuisine, cooking method, preparation time, serving size, dietary labels, publication date, popularity indicators, regional information, and other publicly available fields.
The key is consistency. If one recipe lists "garbanzo beans" and another uses "chickpeas," analysts should normalize these terms before counting them. The same applies to regional spellings, units, dish names, and ingredient variations.
What can recipe research reveal?
| Data signal | Possible insight |
|---|---|
| Recipe title | Dish and trend identification |
| Ingredients | Ingredient demand signals |
| Cuisine | Regional food preferences |
| Cooking method | Preparation behavior |
| Publication date | Trend timing |
| Popularity signal | Relative recipe interest |
| Region | Geographic differences |
| Dietary terms | Emerging diet preferences |
| Preparation time | Convenience preferences |
Recipe datasets are especially useful for identifying ingredient combinations. Academic research has shown that ingredient combinations can reveal meaningful geographic and cultural patterns in cuisines. One study found that recurring ingredient combinations can act as fingerprints for different cuisines.
The 2020-2026 period is also useful for longitudinal analysis. Food behavior changed significantly during and after the pandemic, while inflation, convenience, wellness, social media, and global culinary exchange influenced recipe discovery.
Example trend-monitoring framework
| Year | Research focus |
|---|---|
| 2020 | Home cooking and recipe experimentation |
| 2021 | Convenience and functional food interests |
| 2022 | Global flavors and budget-conscious cooking |
| 2023 | Wellness, protein, and diverse cuisines |
| 2024 | Viral recipes and ingredient innovation |
| 2025 | Global flavors, texture, protein, and functional foods |
| 2026 | Ongoing trend validation and regional comparison |
These are research themes, not claims that every Cookpad user followed the same behavior. The dataset should be analyzed by market, recipe type, and time period.
A food company can use this structure to build dashboards showing ingredient frequency, recipe growth, cuisine distribution, and seasonal changes.
For example, an ingredient that appears in 1% of recipes in one period and 3% in a later period may deserve investigation. Analysts can then compare that change with search activity, retail sales, restaurant menus, and social engagement.
This turns recipe data into an early-warning system for potential food trends.
What Can Automated Recipe Collection Reveal About Consumer Food Behavior?
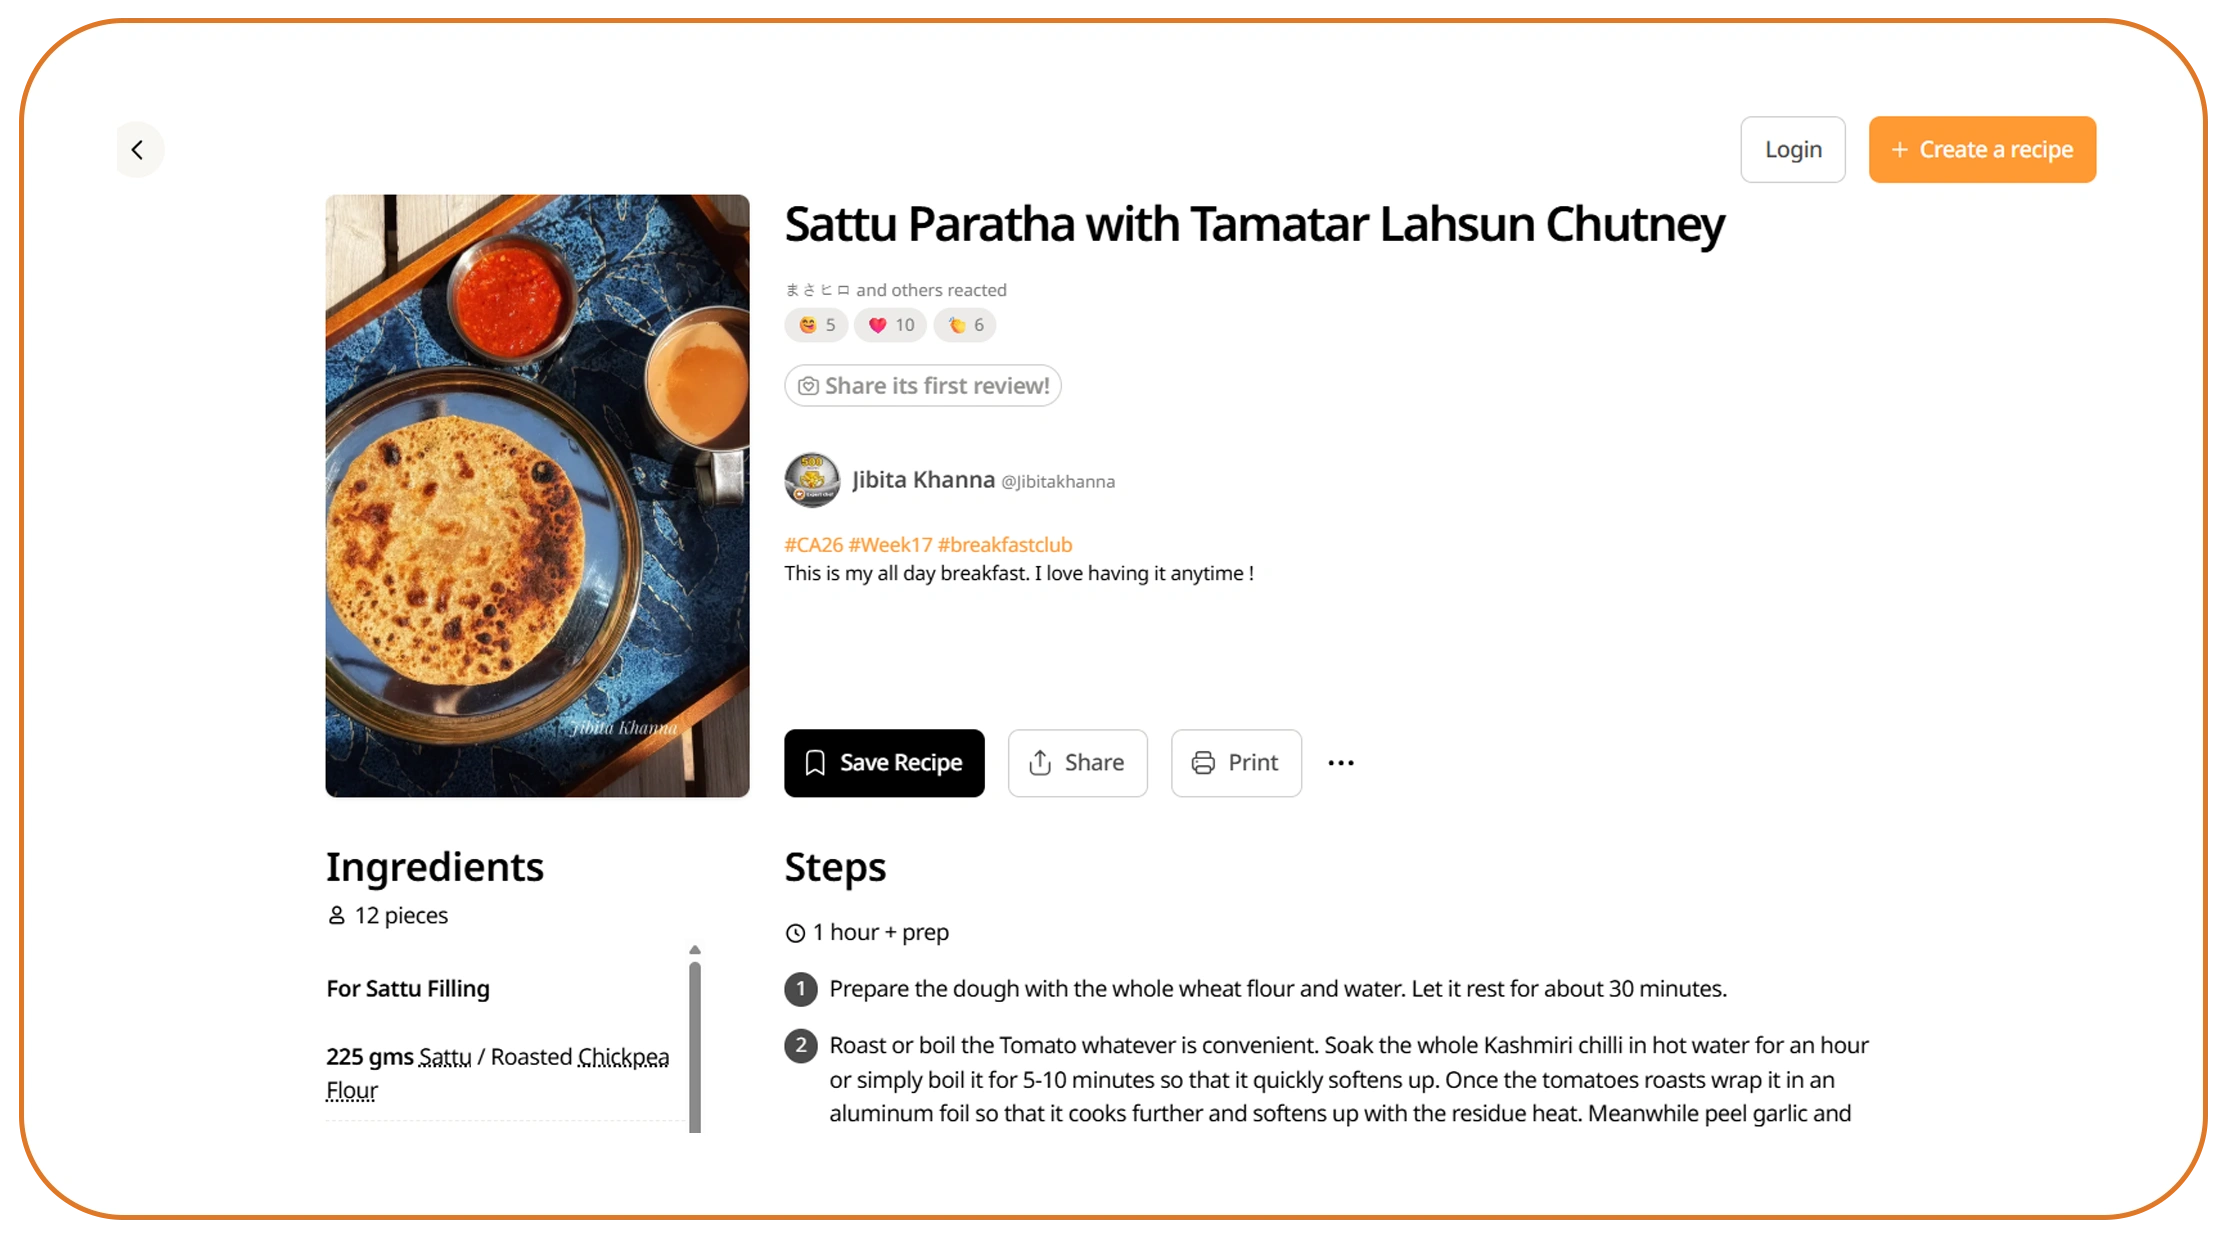
Cookpad recipe and food data scraping can help organizations monitor large volumes of recipe information and compare changes over time. Automation matters because food trends can move quickly.
A manual researcher may discover a new ingredient trend after it becomes mainstream. Automated historical collection can identify smaller changes earlier.
The workflow can capture recurring snapshots of recipe information. Each snapshot receives a timestamp. Analysts can then compare ingredient frequency, dish popularity, cuisine representation, and other signals across periods.
How can the workflow operate?
- Define the research questions.
- Select permitted public data fields.
- Collect recipe information on a scheduled basis.
- Normalize ingredients and recipe names.
- Remove duplicates.
- Add timestamps and geographic labels.
- Calculate frequency and growth indicators.
- Compare results across periods.
- Validate trends against external data.
- Deliver results to dashboards or research platforms.
The food industry has shown increasing interest in trends that connect global flavors, convenience, wellness, and new ingredient combinations. National Geographic's 2025 food-trend review noted that social media continued to influence what people eat and that several trends moved from digital platforms toward supermarket shelves.
That makes recipe data useful as one part of a larger trend-detection system.
What could a seven-year comparison look like?
| Period | Example analytical question |
|---|---|
| 2020 | Did home-cooking recipes increase in selected markets? |
| 2021 | Which convenient recipe formats gained attention? |
| 2022 | Which international ingredients appeared more often? |
| 2023 | Did high-protein or wellness terms grow? |
| 2024 | Which viral recipe formats gained traction? |
| 2025 | Which global flavors became more visible? |
| 2026 | Which emerging signals show sustained growth? |
The analyst should avoid treating recipe frequency as direct sales data. A recipe can become popular without generating equivalent retail demand.
The best practice is to combine recipe signals with other datasets.
For example, a retailer could monitor whether a rapidly growing ingredient in recipe data also shows increased search activity and supermarket sales. A restaurant chain could compare recipe trends with menu mentions. A CPG company could compare ingredient growth with product launches.
This multi-source approach reduces false positives.
It also helps answer a critical business question: Is this a temporary recipe trend or a broader consumer behavior shift?
Historical recipe data makes that question easier to investigate.
How Can Businesses Identify Rising Ingredients and Dishes?
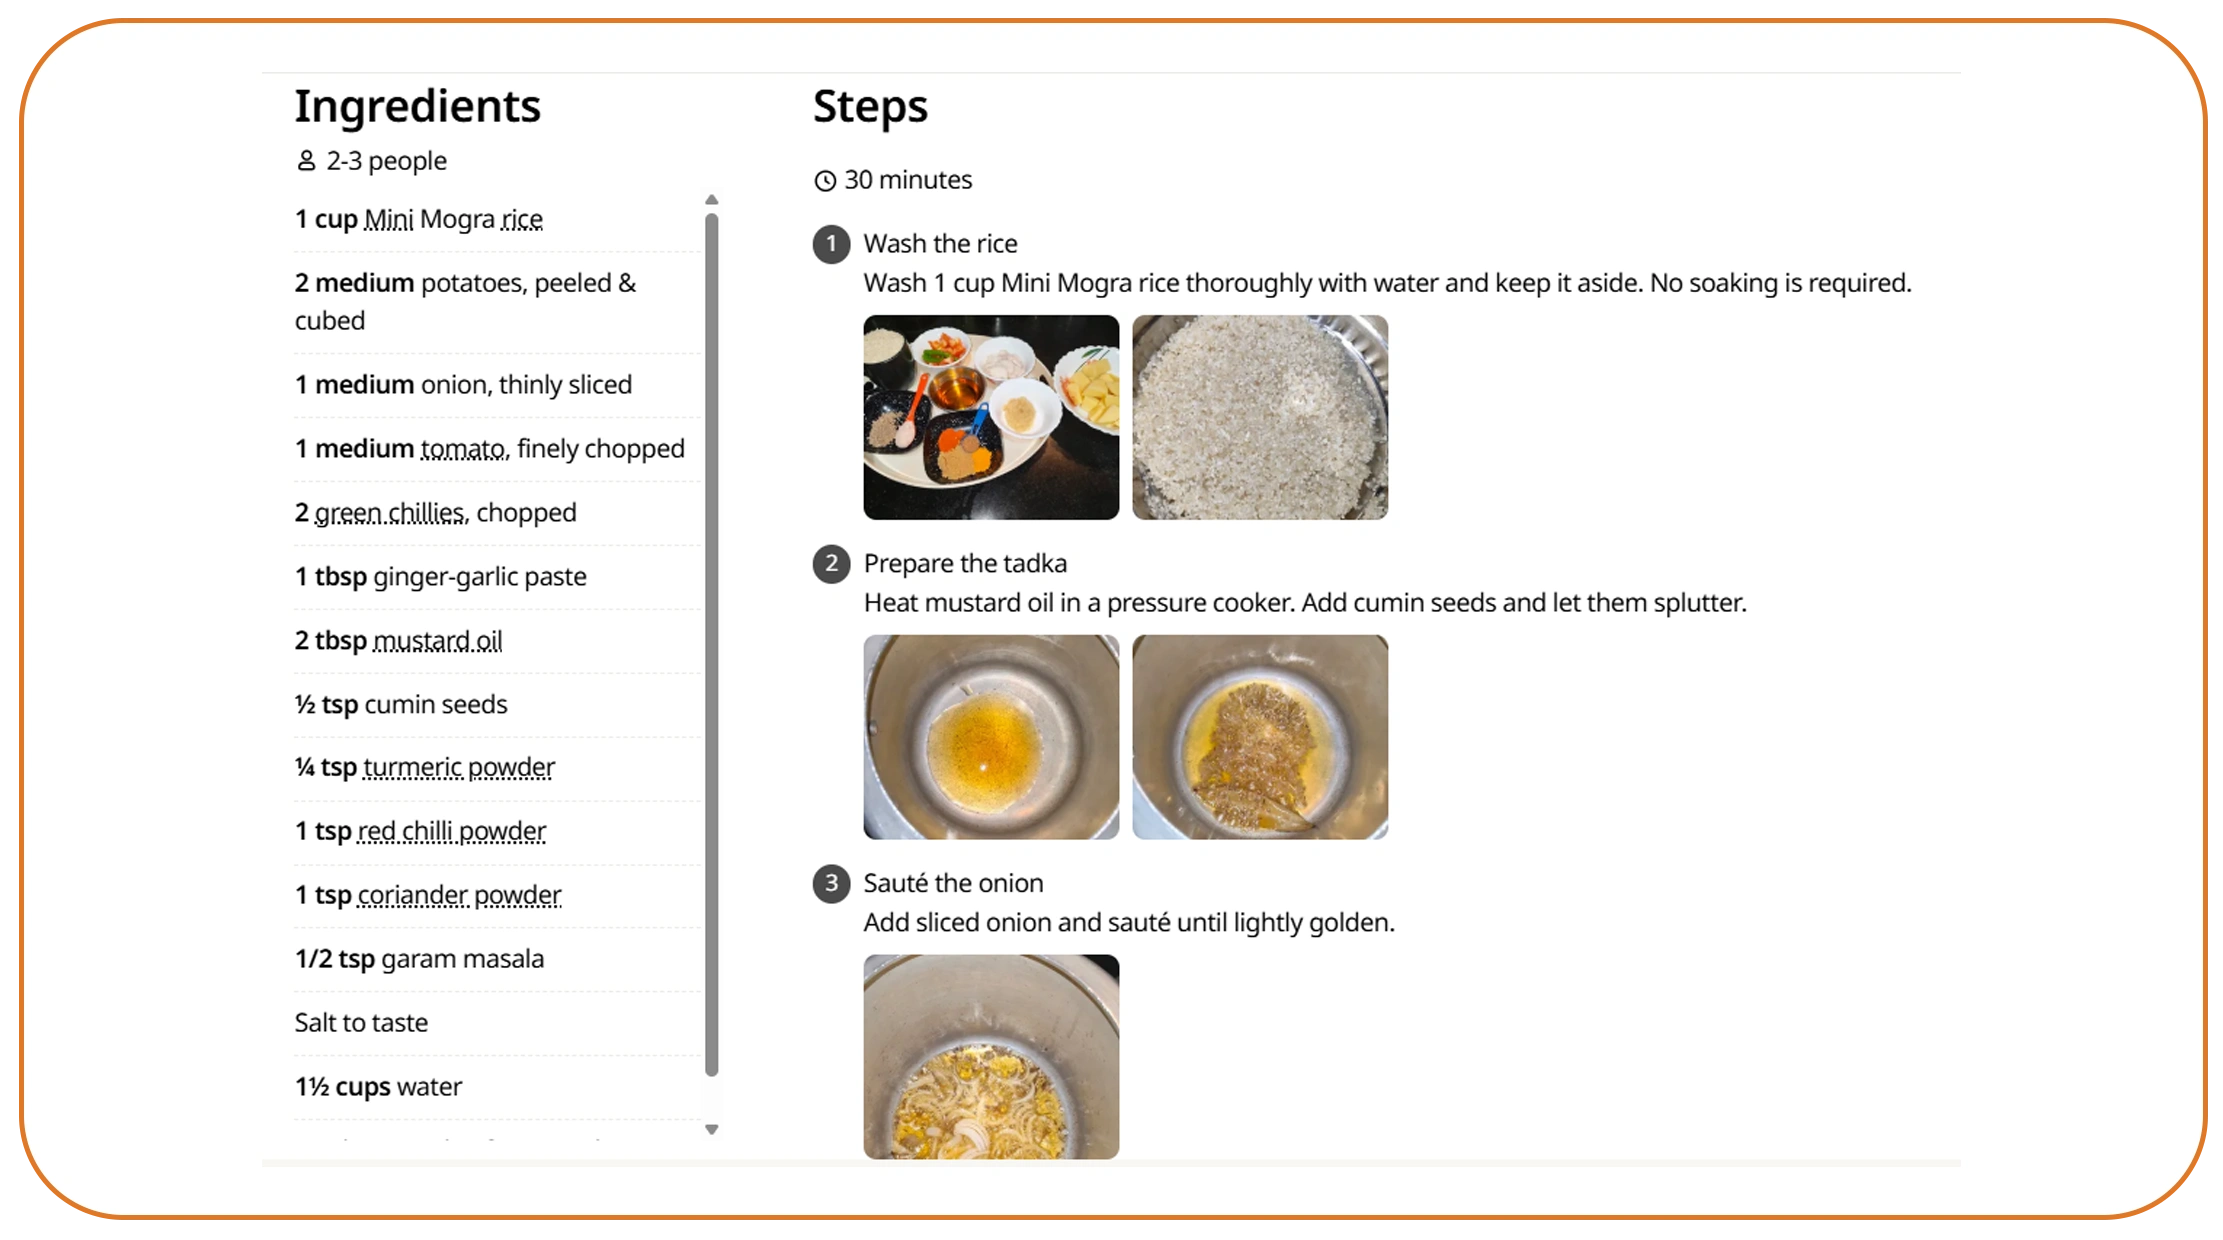
Scrape popular ingredients and dishes from Cookpad data workflows can help analysts create rankings of frequently mentioned foods and identify changes in recipe behavior.
Ingredient ranking is one of the simplest applications. Analysts count how often each ingredient appears during a specific period. They can then compare that number with previous periods.
However, frequency alone can be misleading. A common ingredient may dominate every year without being a new trend. Growth rate is therefore important.
Useful trend indicators
| Indicator | What it measures |
|---|---|
| Ingredient frequency | How often an ingredient appears |
| Growth rate | How quickly mentions increase |
| Recipe diversity | Number of different dishes using it |
| Regional spread | Number of markets showing adoption |
| Pairing frequency | Ingredients commonly used together |
| Seasonal recurrence | Whether interest repeats annually |
| Recipe popularity | Relative interest in recipes |
| Trend persistence | Whether growth continues over time |
Cookpad currently publishes popular ingredients and dishes on its English-language platform. Its February 2026 page listed ingredients such as filet mignon, scallops, lobster tails, salmon, quinoa, lentils, brown rice, and asparagus, while popular dishes included chicken soup, meatloaf, lasagna, chili, banana bread, cheesecake, and pancakes.
This illustrates the type of structured signal that can support trend research.
How can analysts separate trends from noise?
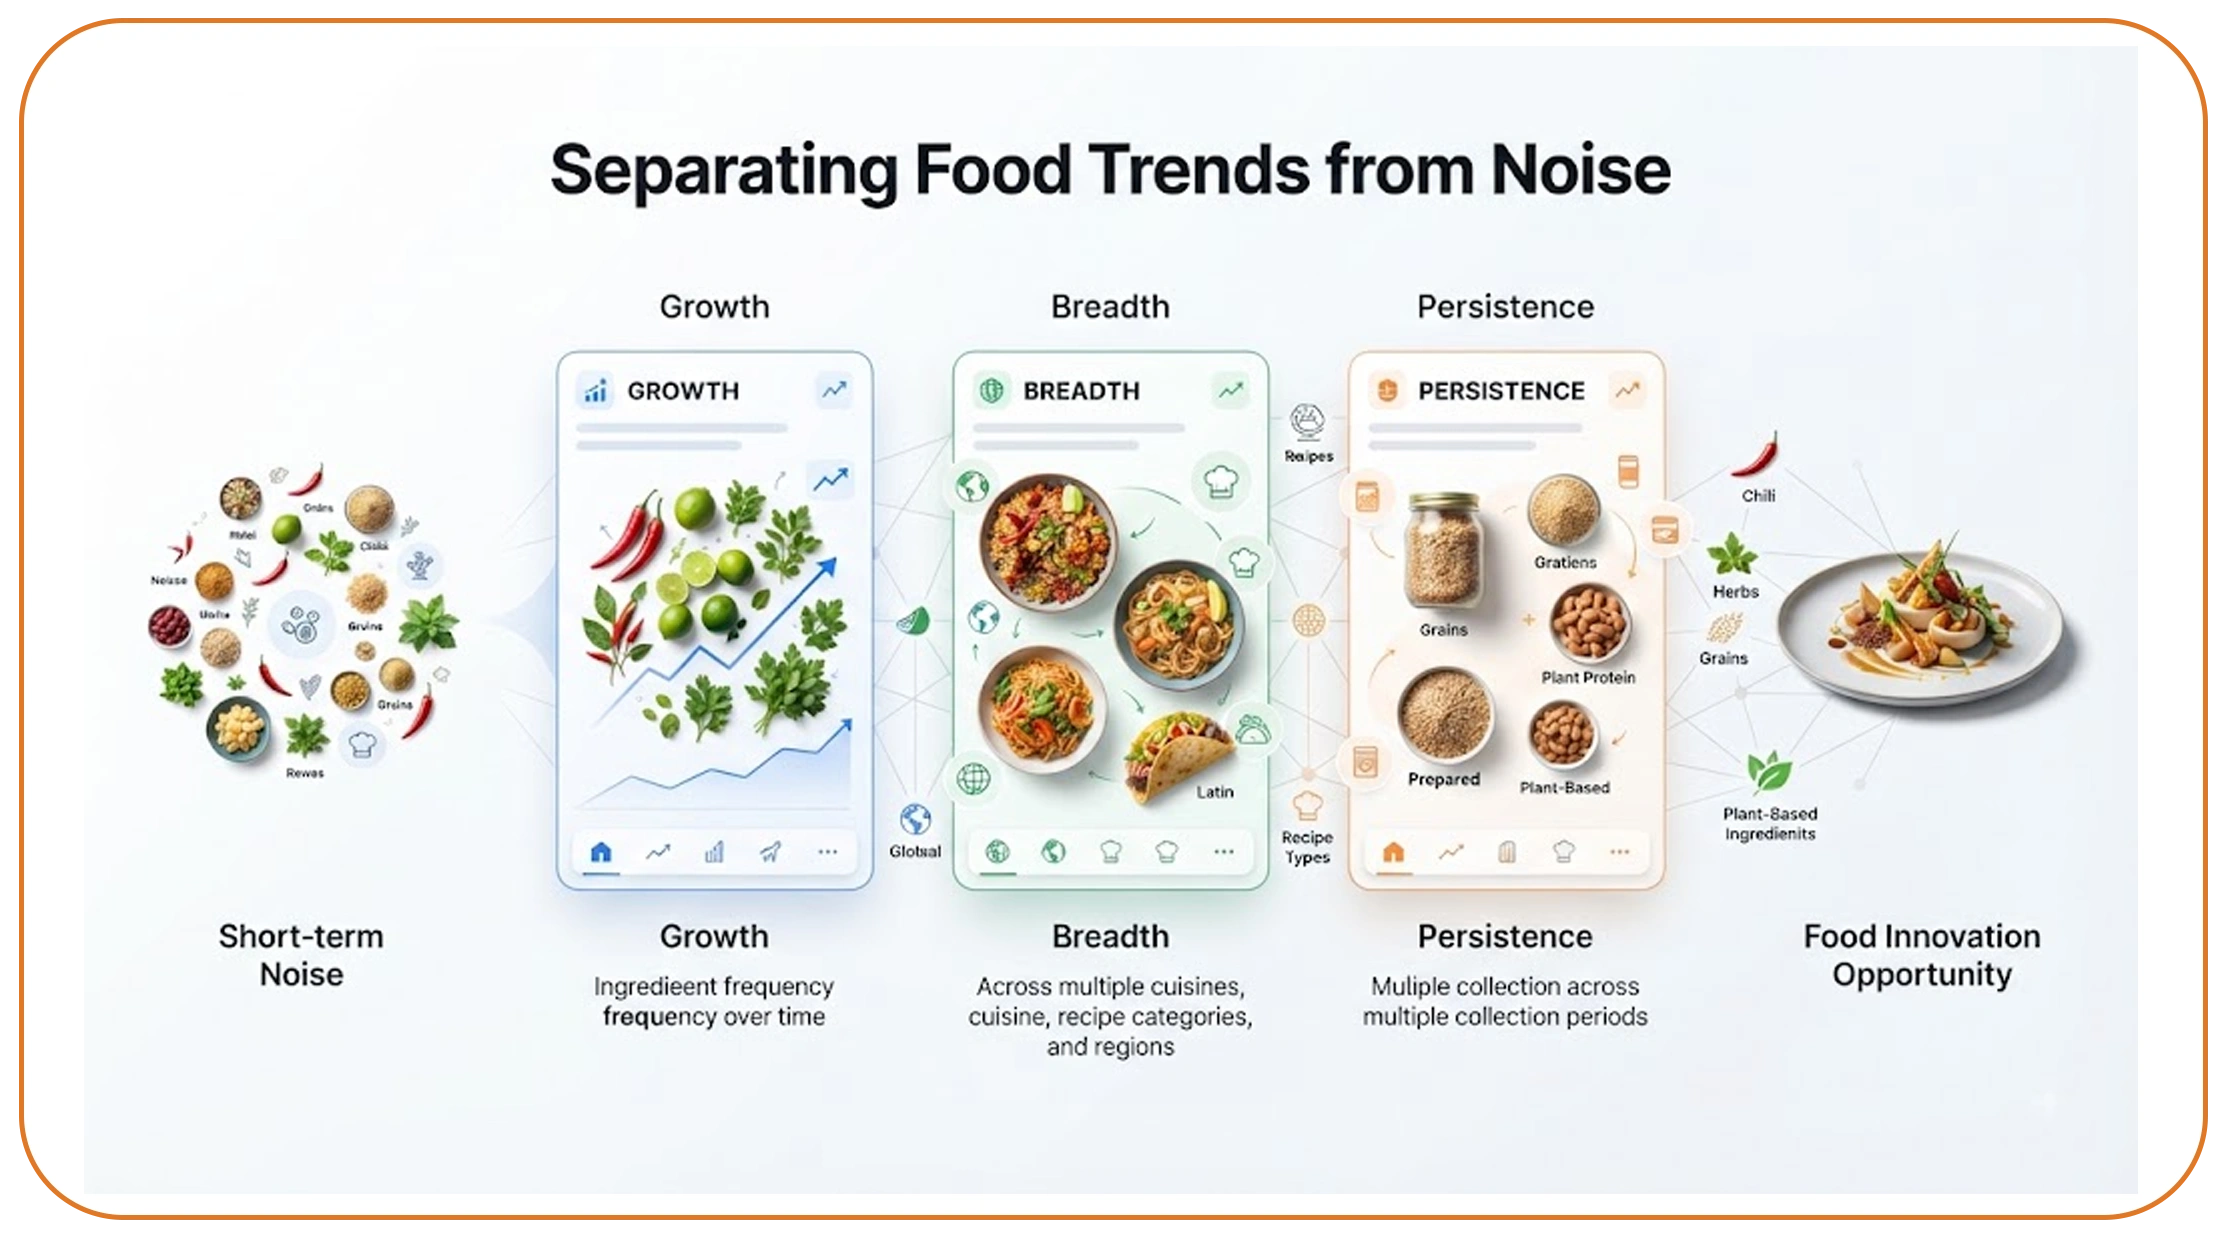
A useful approach is to apply a three-stage test:
Stage 1: Growth. Did the ingredient or dish gain frequency?
Stage 2: Breadth. Did the trend appear across multiple recipe categories or regions?
Stage 3: Persistence. Did the increase continue across several collection periods?
An ingredient that grows for one week may be a short-term trend. An ingredient that grows consistently for six months across several regions deserves more attention.
Researchers can also analyze ingredient networks. If two ingredients increasingly appear together, the combination itself may represent an emerging culinary pattern.
For example, a traditional ingredient may become associated with a new cuisine, cooking method, or dietary format. This can help food companies identify product innovation opportunities.
The 2024-2026 period provides many examples of rapid food-trend cycles. Whole Foods Market's trend reports have highlighted areas such as global peppers, plant-based foods, aquatic ingredients, crunchy textures, and international fusion snacks across recent years.
Recipe data can help test whether such industry predictions also appear in everyday cooking behavior.
That distinction is valuable. Trend reports show expert expectations. Recipe datasets can provide an additional behavioral signal.
How Can a Historical Food Dataset Improve Global Trend Analysis?
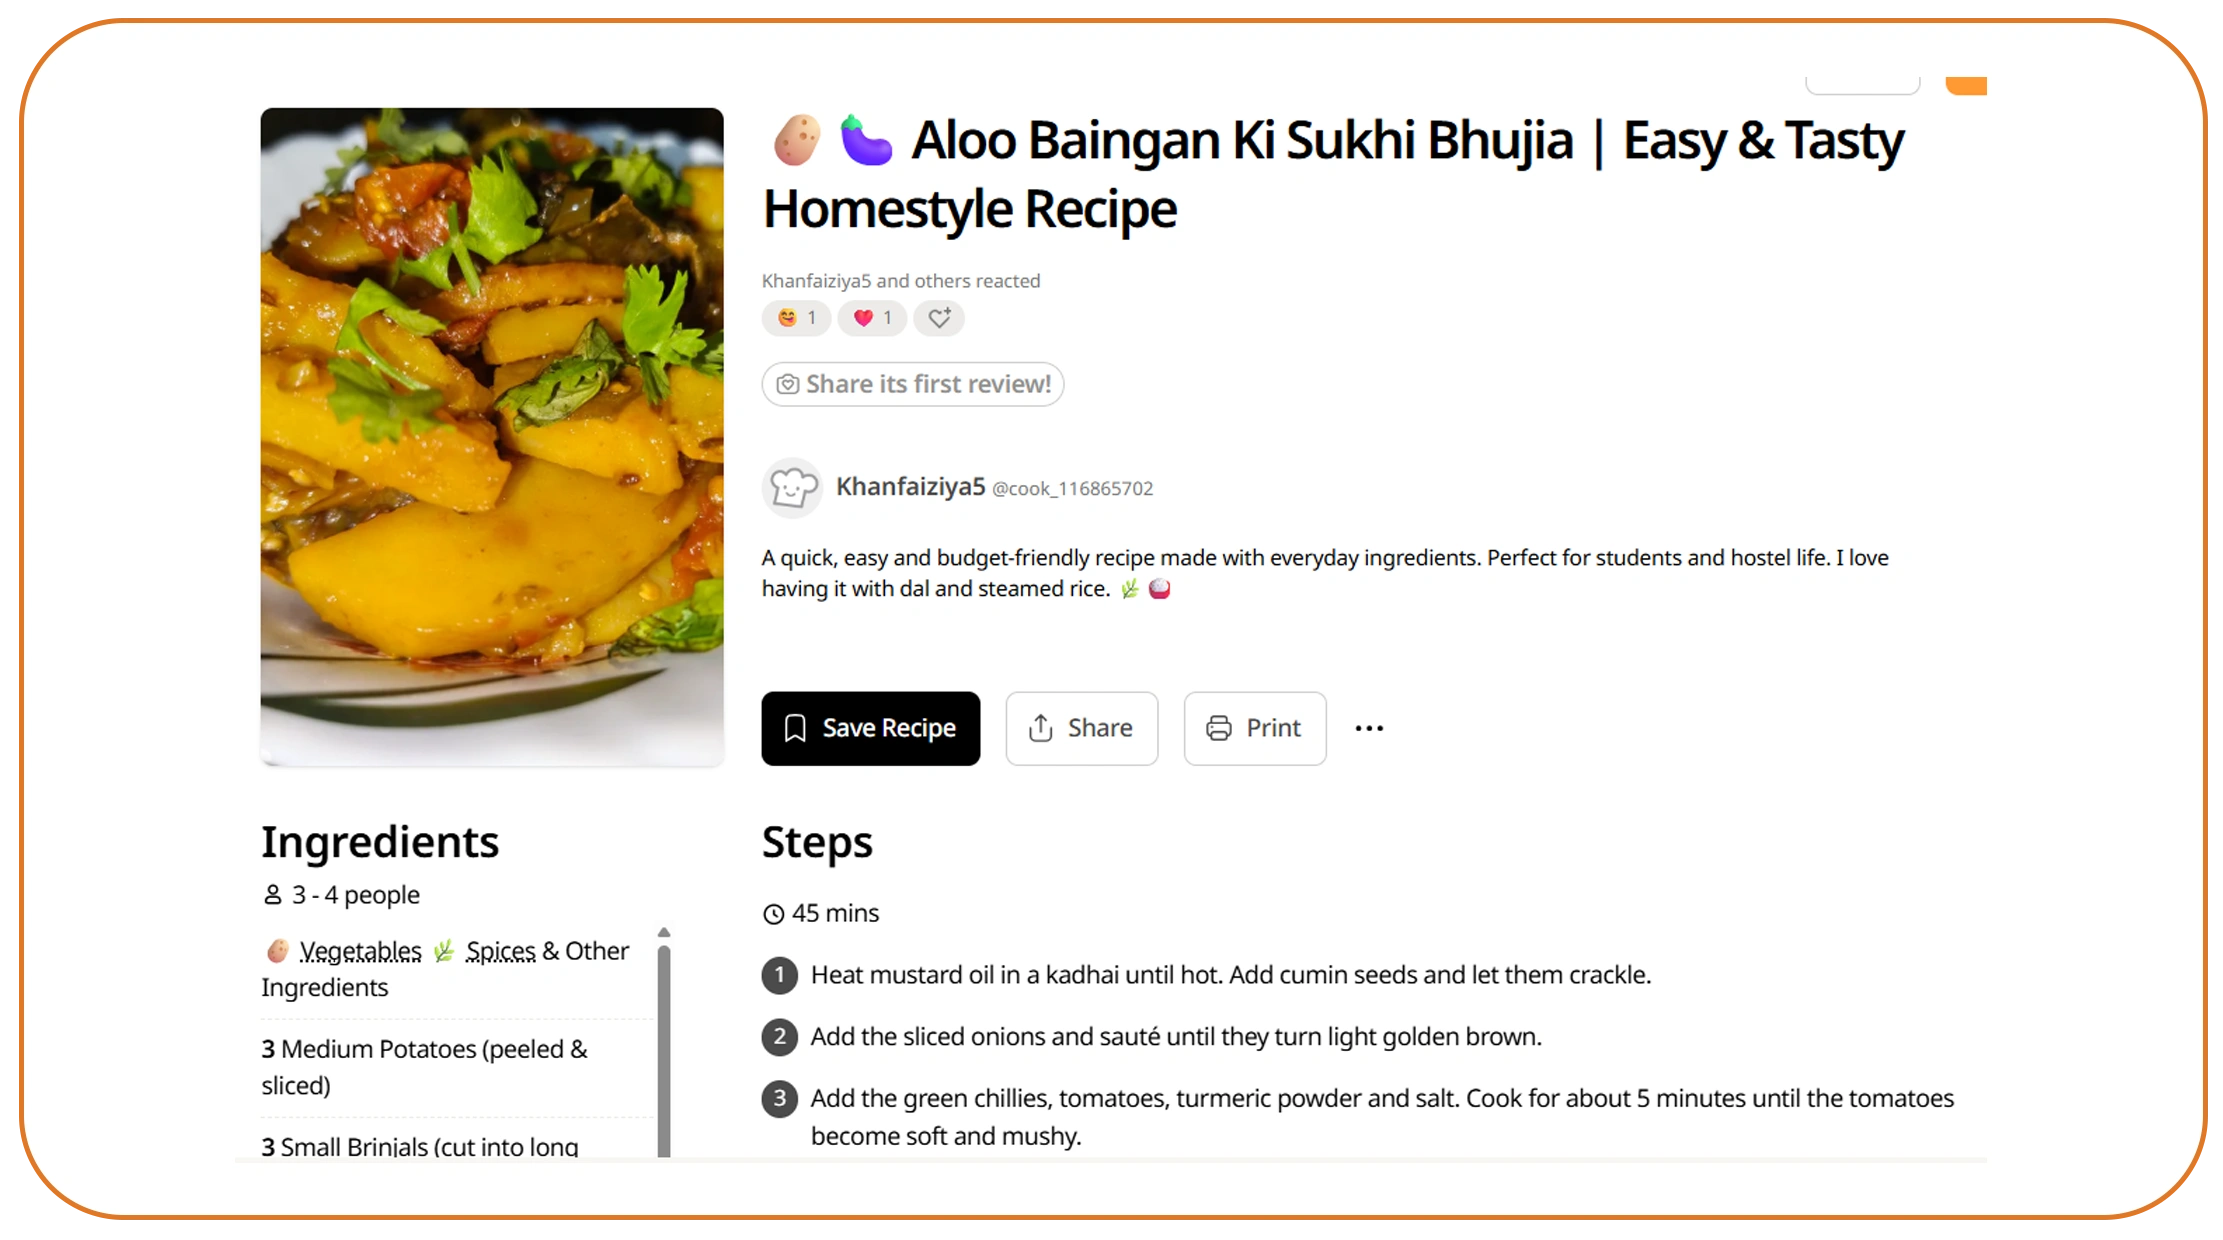
A structured Food Dataset can help food companies compare recipe behavior across years, countries, ingredients, and cuisines.
Cookpad recipe data scraping for global food trends becomes more powerful when analysts preserve historical records instead of collecting only current recipes.
Historical snapshots allow researchers to answer questions such as:
- When did an ingredient begin gaining attention?
- Did the trend start in one country?
- Did it spread to other cuisines?
- How long did the trend last?
- Did recipe diversity increase?
- Did related dishes appear afterward?
Example 2020-2026 food trend dataset
| Year | Key research dimension | Example output |
|---|---|---|
| 2020 | Home cooking | Recipe volume and category baseline |
| 2021 | Convenience | Quick-meal and simplified recipes |
| 2022 | Globalization | Cross-cuisine ingredient growth |
| 2023 | Wellness | Protein and health-related terms |
| 2024 | Viral discovery | Fast-moving recipe formats |
| 2025 | Global flavors | International ingredients and fusion |
| 2026 | Trend validation | Persistent versus temporary signals |
FAO's latest food balance sheet release covers 178 countries and 449 primary and derived products for 2010-2023. It reported that global average dietary energy supply passed 3,000 kilocalories per person per day in 2023.
This type of macroeconomic and food-supply information can complement recipe-level data. Recipe datasets show what people are publishing and cooking about. Food-balance data provides broader supply and consumption context.
A food manufacturer could combine both layers.
For example, if recipe interest in a particular ingredient rises while broader food-supply data also shows increased availability, the signal may deserve deeper investigation.
The same approach works for geographic analysis.
A company can compare:
- Ingredient popularity in India.
- Cuisine growth in the United States.
- Recipe patterns in Japan.
- Dietary terms in Europe.
- Seasonal dishes across multiple markets.
Cookpad itself lists communities across numerous countries and regions, including the United States, United Kingdom, Spain, India, Japan, Vietnam, Thailand, Indonesia, France, Saudi Arabia, Taiwan, Italy, and others.
This geographic breadth makes regional segmentation important.
A global average can hide meaningful local trends. A dish may be growing rapidly in one market while remaining flat elsewhere.
For food businesses, that insight can improve localization. A retailer can adapt product ranges. A restaurant can test regional menus. A CPG company can develop market-specific flavors.
Historical data also supports forecasting. While no dataset can guarantee future demand, recurring patterns can help identify seasonality and sustained growth.
Which Business Problems Can Recipe Data Solve?
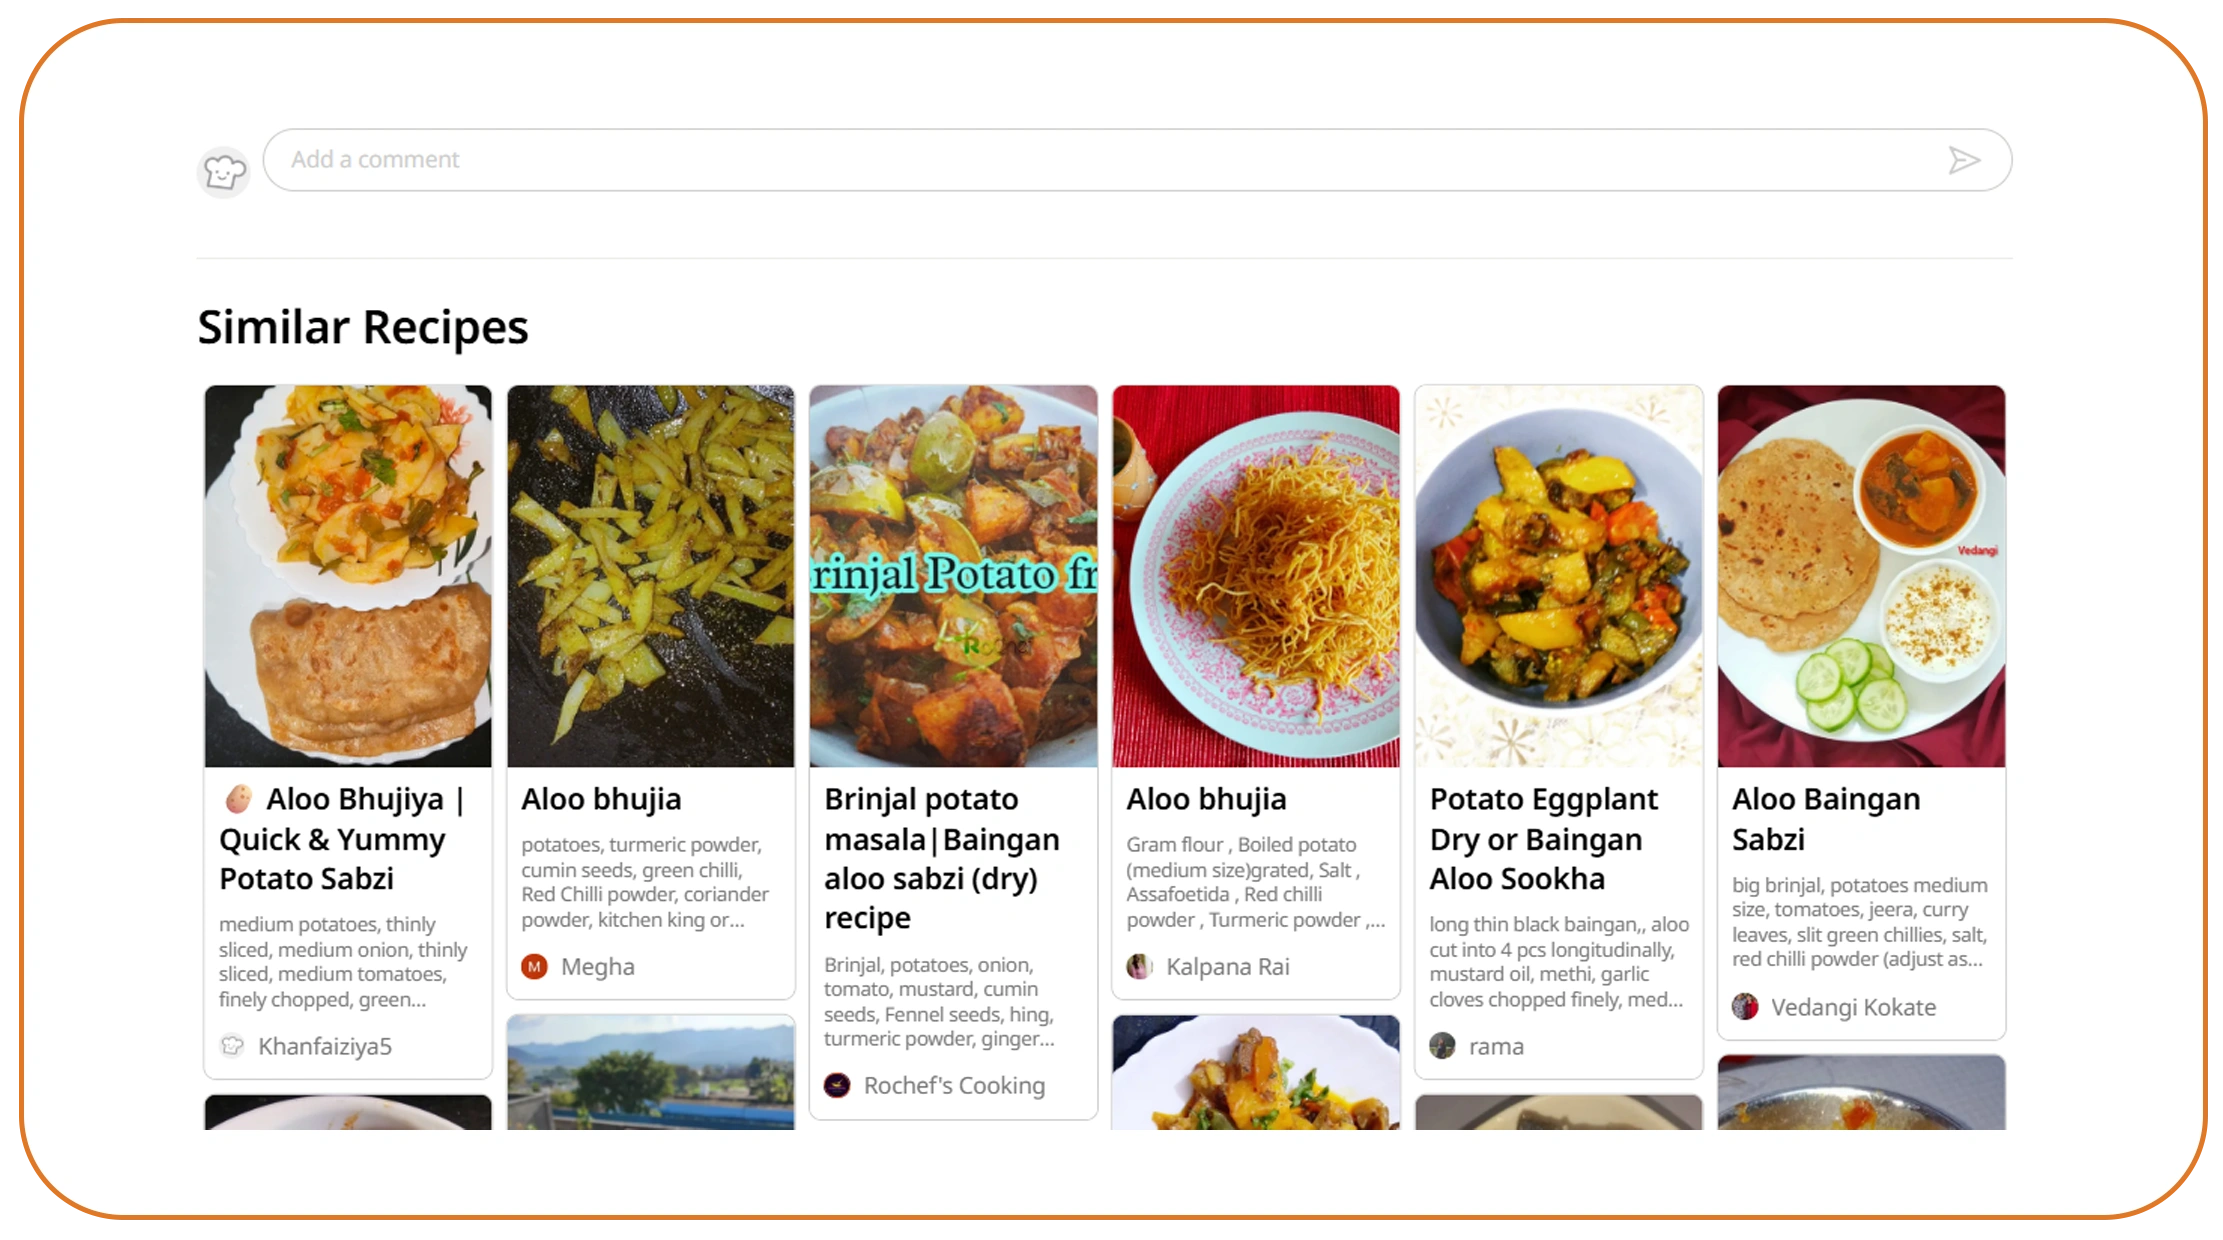
Food Scraping API Use Cases extend beyond basic recipe discovery. Structured food data can support product development, menu research, competitive intelligence, ingredient monitoring, content planning, and consumer trend analysis.
1. Product development
Food manufacturers can monitor ingredient combinations and recipe formats. This can help product teams generate ideas for new flavors, meal kits, sauces, snacks, and prepared foods.
2. Restaurant menu planning
Restaurant groups can compare emerging dishes and ingredients with existing menus. They can identify gaps and test new concepts.
3. Grocery assortment planning
Retailers can monitor ingredient and recipe trends to support assortment decisions. Recipe signals can complement sales data.
4. Content strategy
Food publishers can identify rising recipe themes and create content around emerging consumer interests.
5. Competitive research
Brands can compare their product categories with broader recipe trends.
6. Regional food intelligence
International businesses can compare ingredients and cuisines across markets.
7. Dietary trend monitoring
Analysts can track recipe terms associated with high-protein, vegetarian, vegan, gluten-free, low-sugar, or other dietary approaches.
Which metrics can businesses track?
| Business objective | Useful data signals |
|---|---|
| Product innovation | Ingredients and combinations |
| Menu planning | Dishes and cuisines |
| Retail planning | Ingredient frequency |
| Content planning | Trending recipes |
| Market research | Regional recipe patterns |
| Competitive analysis | Category and ingredient growth |
| Forecasting | Historical trend persistence |
Food trends often develop through multiple channels. National Geographic reported that social platforms continue to influence food behavior and can help trends move toward supermarket products.
This makes recipe data most useful when combined with social, search, retail, menu, and sales datasets.
For example, suppose a new ingredient appears frequently in recipes. The analyst can check whether search interest also rises. Next, they can examine whether restaurant menus mention it more often. Finally, retail sales can confirm whether the behavior has moved into purchasing.
The approach helps reduce the risk of investing heavily in a trend based on one data source.
It also supports faster decision-making. Instead of waiting for annual food reports, teams can monitor signals continuously.
How Can an API Automate Food Trend Monitoring?
A Food Data Scraping API can connect recurring recipe collection with a company's analytics infrastructure.
An API-based workflow can deliver structured records into a database, data warehouse, dashboard, research platform, or machine-learning pipeline.
The process can remain simple:
- Define the recipe fields.
- Identify permitted data sources.
- Collect the required information.
- Normalize ingredients and recipe names.
- Add geographic and time fields.
- Validate the records.
- Store historical snapshots.
- Calculate trend indicators.
- Deliver the structured dataset.
- Connect the results to business analytics.
What should an automated dataset contain?
| Field | Example purpose |
|---|---|
| Recipe ID | Record identification |
| Recipe title | Dish classification |
| Ingredients | Ingredient analysis |
| Cuisine | Geographic analysis |
| Publication date | Trend timing |
| Region | Market segmentation |
| Dietary labels | Consumer preference research |
| Cooking time | Convenience analysis |
| Popularity signal | Relative interest |
| Collection timestamp | Historical tracking |
The system should also include data-quality controls.
These controls can detect:
- Duplicate recipes.
- Missing ingredients.
- Invalid dates.
- Inconsistent units.
- Duplicate ingredient names.
- Unexpected category changes.
- Broken records.
- Source structure changes.
Automation should not mean uncontrolled collection. Businesses should review applicable terms, access permissions, robots directives, copyright restrictions, privacy requirements, and rate limits before collecting data.
An API can then serve as the delivery layer.
A food-tech company might use the data to power an ingredient-trend dashboard. A restaurant platform might build cuisine recommendations. A CPG company could send emerging ingredient data to its product-development team.
Historical data can also feed predictive models. Models may identify seasonality, ingredient relationships, and regional growth patterns.
The model should still treat recipe behavior as one signal rather than a direct measure of purchases.
This distinction matters because people can publish recipes without buying commercial products, and popular recipes do not always translate directly into sales.
The best business results come from combining recipe intelligence with other market signals.
Why Choose Real Data API?
For businesses that need recurring food intelligence, data collection must be consistent, scalable, and easy to integrate.
Cookpad recipe data scraping for global food trends can provide useful recipe-level signals when organizations collect permitted public information and preserve it in structured historical datasets.
Real Data API can help businesses create automated data pipelines that support structured extraction, transformation, historical storage, and API delivery.
Why can this help food businesses?
- Automation: Reduce repetitive recipe research.
- Scalability: Process larger datasets efficiently.
- Structured output: Make recipe data easier to analyze.
- Historical tracking: Compare trends over time.
- Regional analysis: Segment markets and cuisines.
- Integration: Connect data with analytics systems.
- Custom datasets: Focus on fields relevant to the business.
- Faster research: Reduce the time required to identify potential trends.
A strong data pipeline also improves research consistency. Analysts can use the same schema across collection periods.
This makes year-over-year comparisons easier.
For example, a business could track the monthly frequency of an ingredient from 2020 through 2026. It could then compare that trend with search activity, retail sales, restaurant menus, and social engagement.
The result is a broader food intelligence system.
Real Data API can support the data infrastructure while businesses apply their own analytics models and business rules.
The goal is not simply to collect recipes. The goal is to transform structured food information into useful business signals.
Conclusion
Cookpad recipe data scraping for global food trends helps businesses turn recipe information into structured signals about ingredients, dishes, cuisines, cooking methods, and changing food preferences. Historical collection makes those signals more useful because analysts can measure growth, regional spread, seasonality, and persistence.
Cookpad currently publishes popular ingredients, popular dishes, and trending keywords, providing a clear example of the type of observable food-content signals that can support market research.
The strongest strategy does not treat recipe data as a standalone measure of consumer spending. Instead, it combines recipe signals with search trends, restaurant menus, retail sales, social engagement, and broader food-market data.
A practical trend-analysis workflow
- Collect permitted recipe information.
- Normalize ingredients and dishes.
- Add timestamps and regional fields.
- Measure frequency and growth.
- Identify emerging combinations.
- Compare trends across markets.
- Validate signals with external datasets.
- Deliver insights through dashboards or APIs.
This approach can help food manufacturers discover product opportunities. Restaurants can improve menu planning. Retailers can identify emerging ingredients. Food publishers can create timely content. Market researchers can build richer consumer trend reports.
The 2020-2026 period also shows why historical data matters. Food behavior continues to evolve with changes in wellness, convenience, globalization, social media, pricing, and culinary experimentation. A current snapshot cannot explain those changes by itself.
A structured, continuously updated dataset provides the historical context needed to separate lasting trends from short-lived hype.
Contact Real Data API to build a scalable food data scraping solution for recipe analysis, ingredient tracking, consumer trend research, and global food-market insights!
Latest posts
How to Analyze Equity Market Trends Using Mubasher Data Scraping for Smarter Investment Decisions?
How To Identify Grocery Demand Trends And Competitor Gaps With Flaschenpost Scraped Data For Grocery Market Analysis?

How to Extract Meesho product data for seller analytics for Better Business Insights?

How to Scrape OpenRent property data for UK rental market trends for Better Market Insights?







.png)



