Introduction
Australian grocery prices have become an important indicator of household affordability, retail competition, and changing consumer behaviour. Food inflation is influenced by multiple factors, including weather conditions, agricultural production, transport expenses, labour costs, commodity prices, exchange rates, supply availability, and retailer promotions. Because grocery prices can change frequently at the product level, businesses need detailed datasets to understand how inflation translates into actual shelf prices.
The Coles Australian grocery inflation report provides a framework for examining grocery price movements through structured product-level information. Instead of relying only on broad inflation indexes, businesses can analyze individual products, categories, brands, package sizes, promotional prices, and availability. This allows analysts to connect macroeconomic inflation trends with the actual products consumers encounter during their shopping journeys.
An Coles Grocery Scraping API can support automated collection of online grocery information and transform changing product pages into structured datasets. Such data can be used to compare prices over time, identify promotional activity, monitor product availability, measure category-level inflation, and develop competitive pricing intelligence.
The Australian Bureau of Statistics reported that food and non-alcoholic beverage prices rose 3.3% in the 12 months to May 2026, while overall CPI increased 4.0%. Meat and seafood increased 5.4%, dairy and related products rose 5.2%, and fruit and vegetables increased 2.0%.
Australian Food & Non-Alcoholic Beverage Inflation (2020-2026)
| Year / Period | Australian Food & Non-Alcoholic Beverage Inflation | Key Market Signal |
|---|---|---|
| 2020 | 2.3% | Pandemic-era demand and supply changes |
| 2021 | 1.9% | Relatively moderate food inflation |
| 2022 | 9.5% | Major inflationary acceleration |
| 2023 | 4.5% | Inflation began easing |
| 2024 | 3.0% | Further moderation |
| 2025 | 3.4% | Food inflation increased modestly |
| May 2026 | 3.3% | Inflation remained elevated |
Source: Australian Bureau of Statistics. Figures represent annual movement to December for 2020-2025 and the 12 months to May 2026.
This seven-year trend demonstrates why historical grocery data is valuable. Food inflation peaked at 9.5% in December 2022 before declining to 4.5% in December 2023 and 3.0% in December 2024. By December 2025, annual food inflation had increased slightly to 3.4%.
Building a Product-Level Inflation Dataset
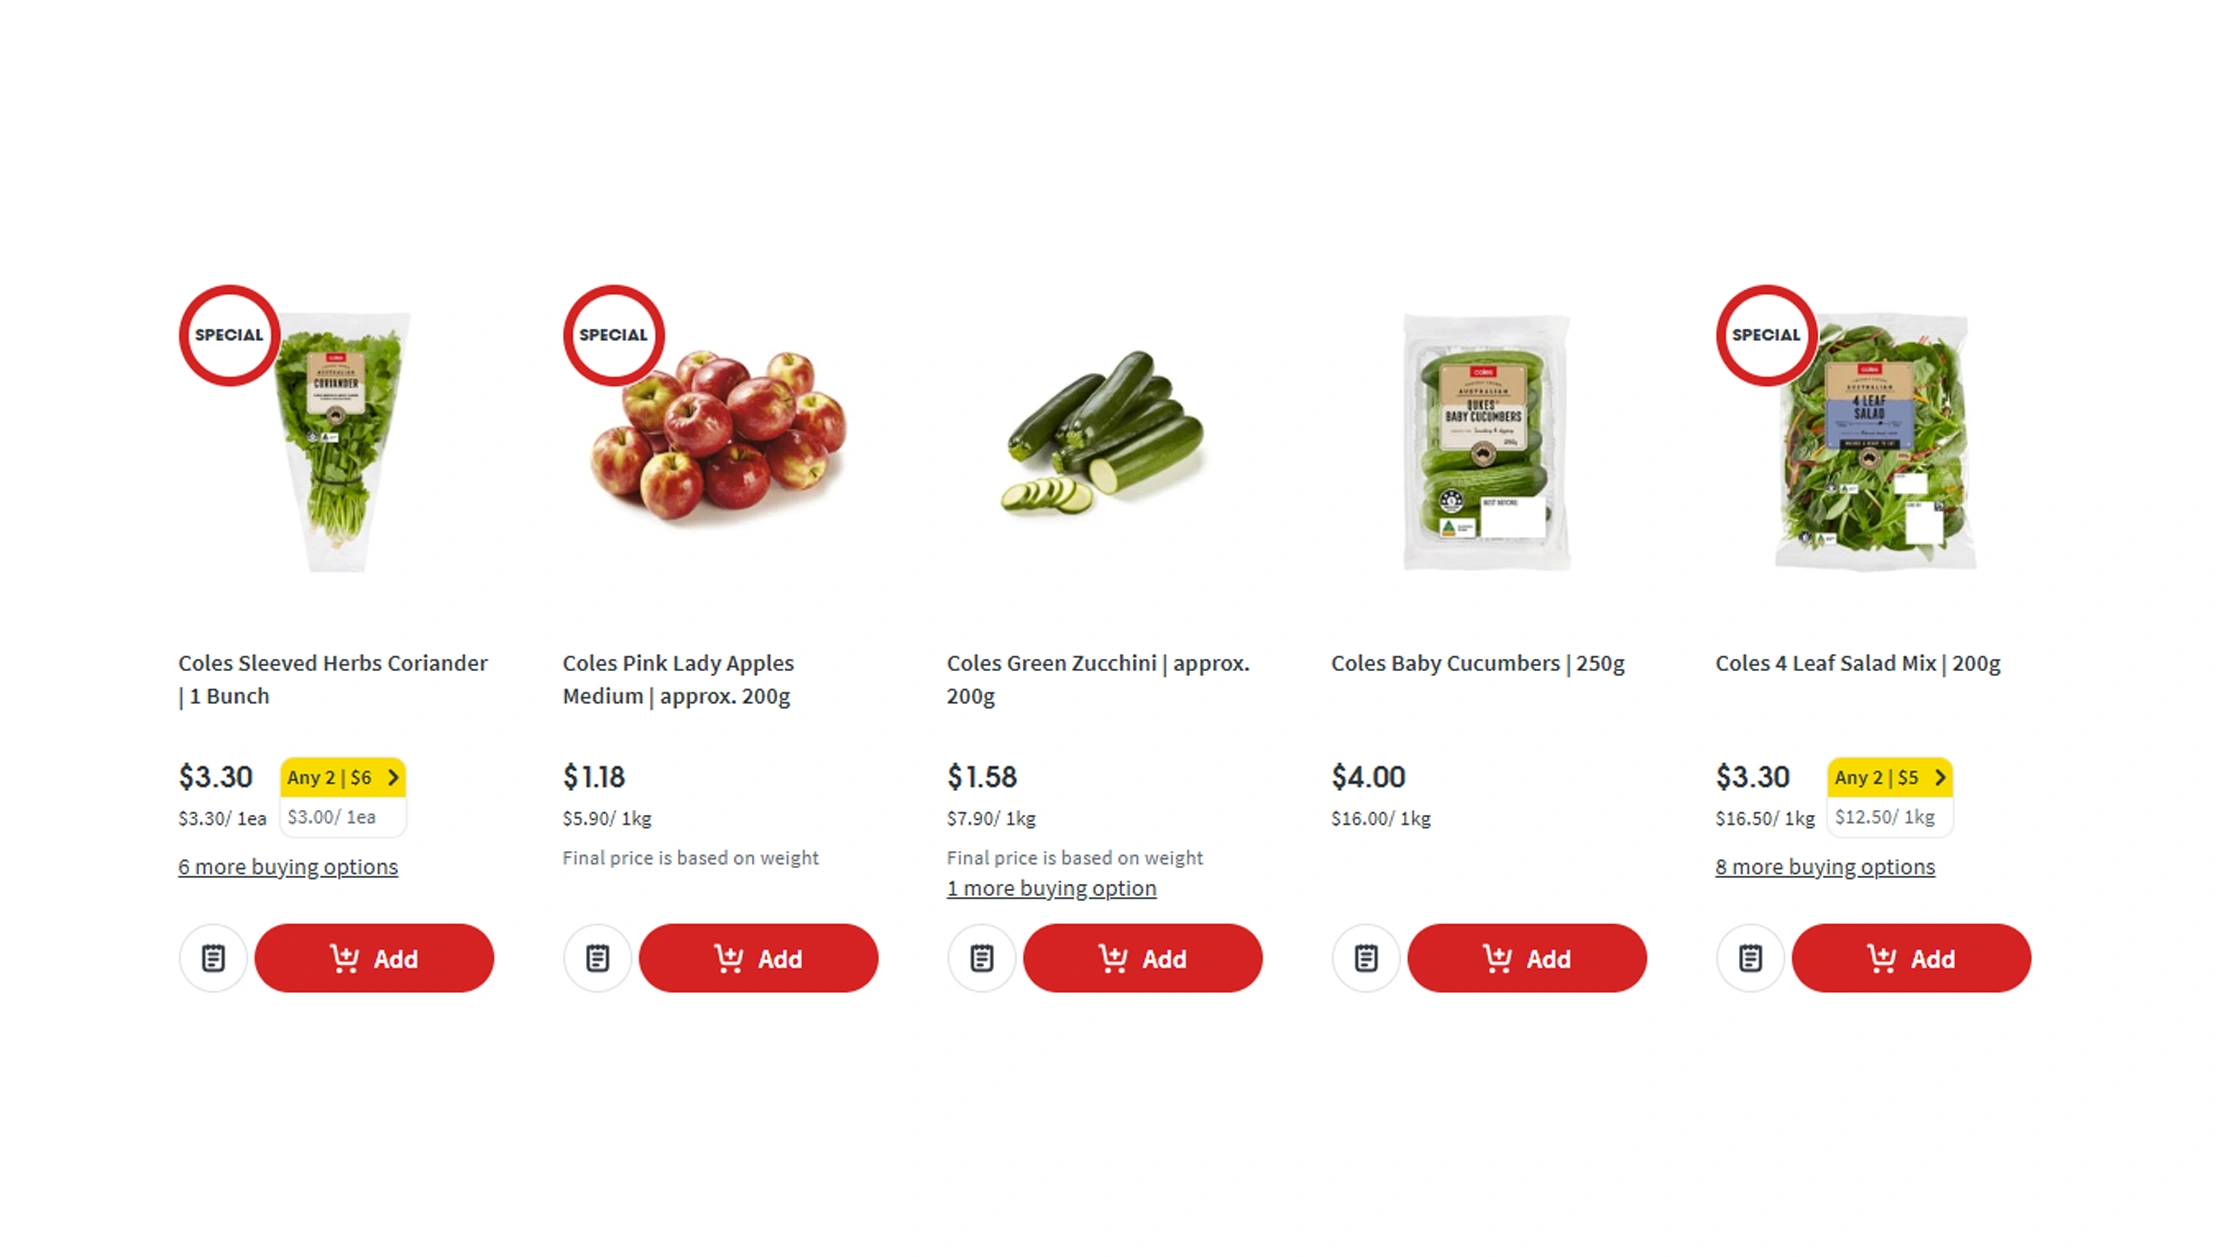
The ability to scrape grocery inflation using Coles product data allows businesses to move from broad inflation measurements toward detailed product-level analysis. A national inflation figure may indicate that food prices increased by a particular percentage, but it does not explain how individual products, brands, package sizes, or categories contributed to that movement.
A structured grocery dataset can capture product name, brand, category, SKU, package size, regular price, promotional price, unit price, availability, product URL, and collection timestamp. Repeated collection creates a historical record that allows analysts to calculate price changes between periods.
This approach is particularly useful when examining inflation across different grocery categories. For example, ABS data showed food inflation at 9.5% in December 2022, with bread and cereal products rising 12.9%, dairy and related products increasing 14.4%, and food products not elsewhere classified increasing 11.9%.
Food Inflation and Analytical Use (2020-2026)
| Year | Food Inflation | Example Analytical Use |
|---|---|---|
| 2020 | 2.3% | Establish product-price baseline |
| 2021 | 1.9% | Track moderate price movement |
| 2022 | 9.5% | Identify inflation shock |
| 2023 | 4.5% | Measure price-growth moderation |
| 2024 | 3.0% | Identify stabilizing categories |
| 2025 | 3.4% | Detect renewed pressure |
| 2026* | 3.3% | Monitor current inflation |
*2026 represents the annual movement to May.
At the product level, analysts can calculate absolute price changes and percentage increases while controlling for package size. A product moving from $4.00 to $4.50 represents a 12.5% increase, but a smaller package could create a much larger effective increase in unit pricing. This makes unit-price normalization essential.
Historical snapshots can also distinguish temporary promotions from persistent price changes. If a product falls from $6.00 to $4.50 for one week and subsequently returns to $6.00, the event can be classified as promotional rather than structural inflation.
For retailers and brands, this information can support price benchmarking, category management, assortment analysis, promotion effectiveness, and competitor monitoring. For researchers, it creates a granular dataset that complements official inflation statistics with observed online retail prices.
Tracking Price Changes as They Happen
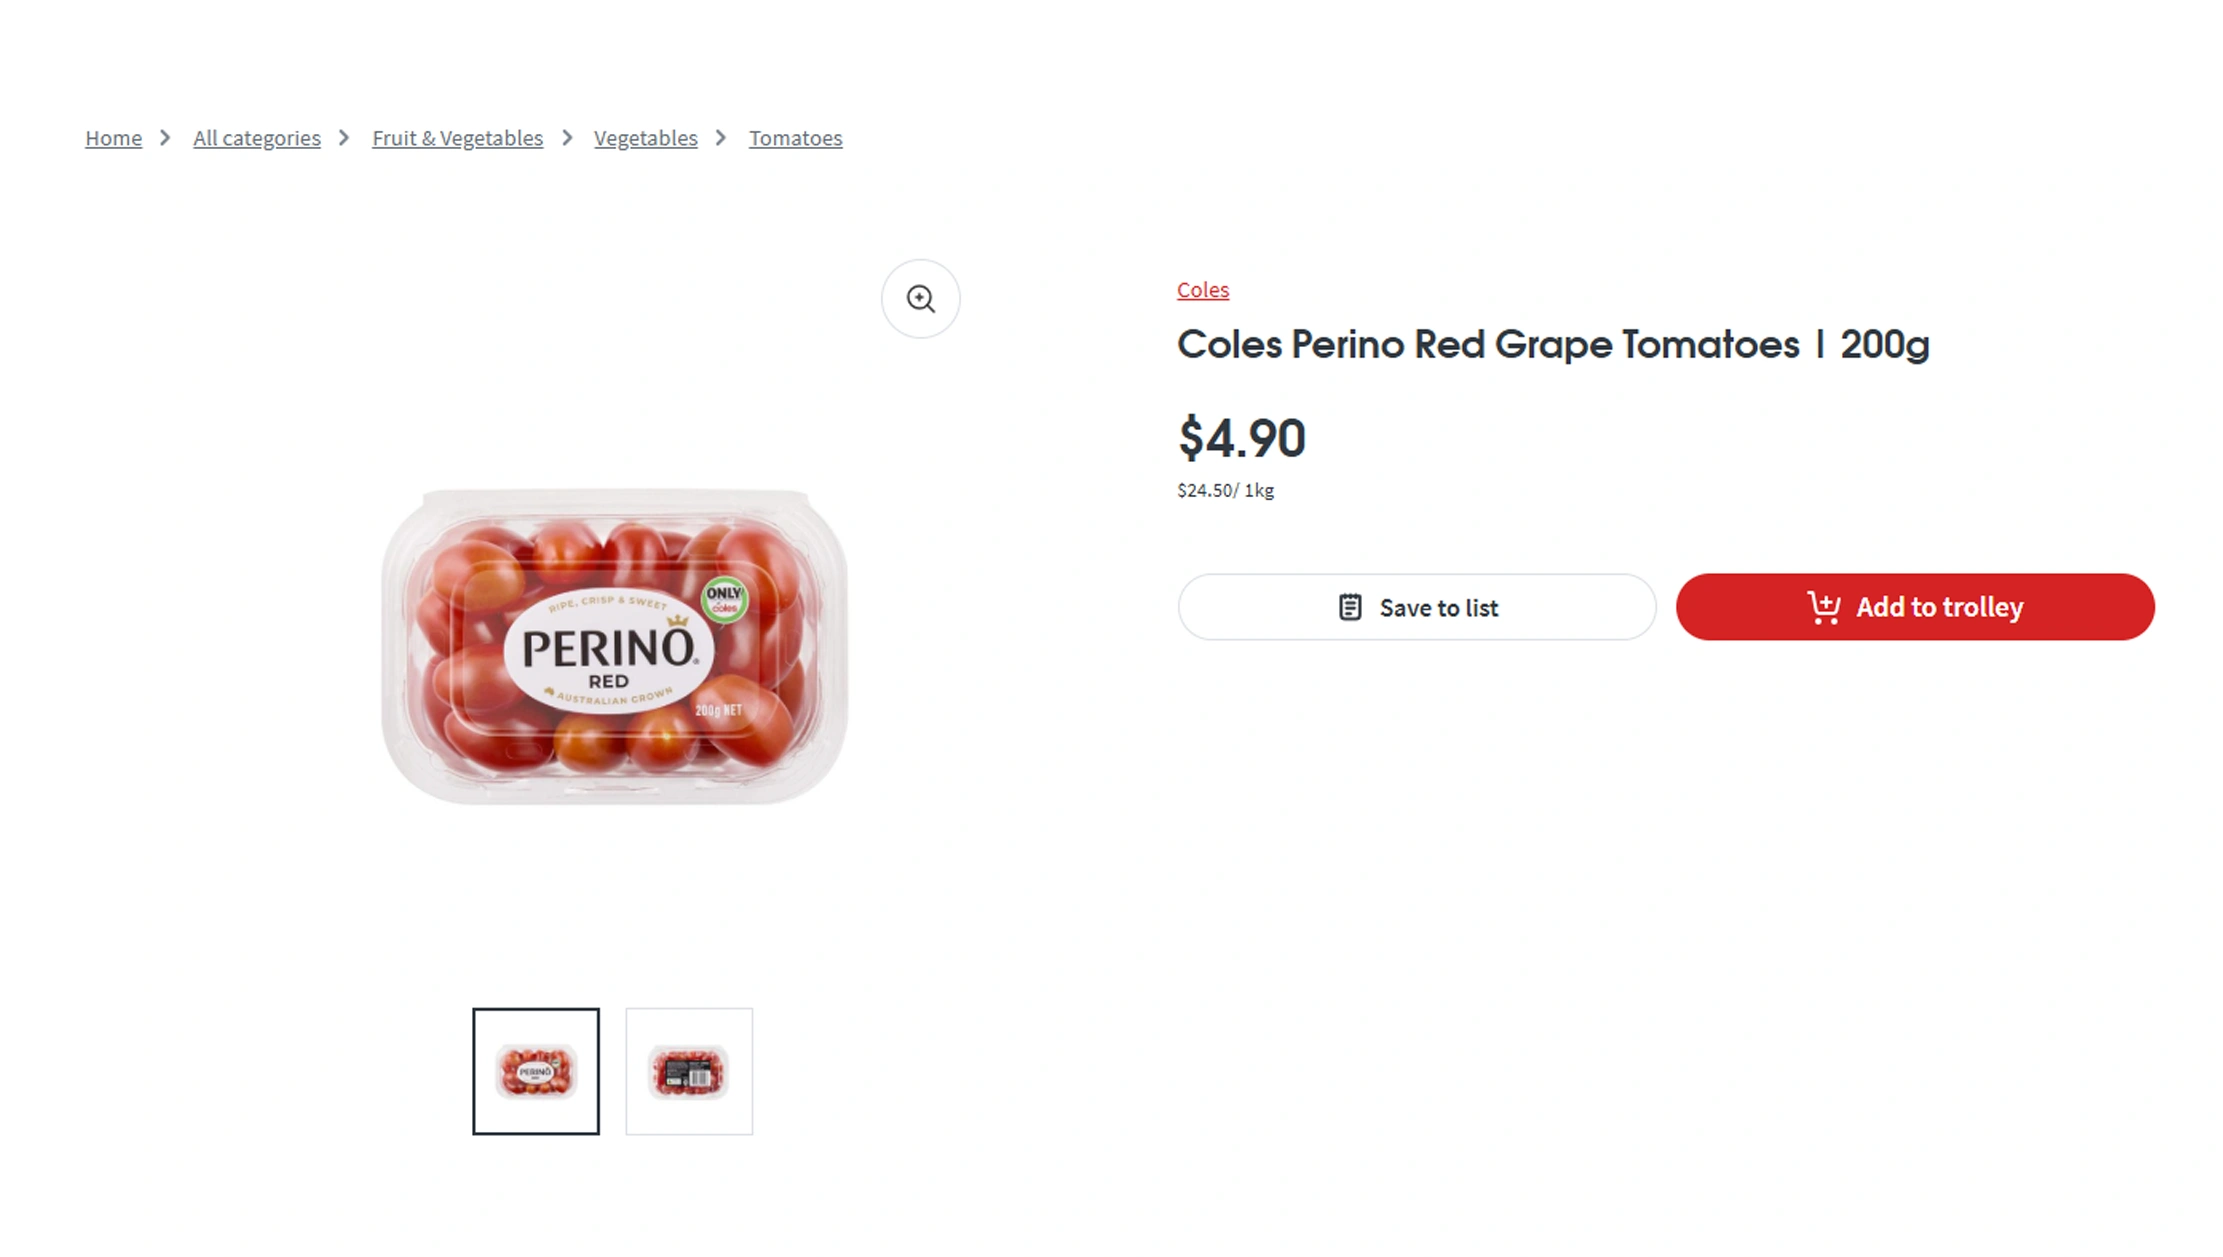
Real-time grocery price monitoring from Coles can provide businesses with faster visibility into pricing changes than periodic manual research. Grocery websites contain thousands of products, and prices can change because of promotions, supplier costs, seasonal availability, competitive activity, or changing consumer demand.
An automated monitoring workflow can periodically collect product information and compare each new record with historical observations. When a price changes, the system can record the previous value, current value, percentage movement, timestamp, and promotional status.
This becomes especially valuable when inflation is uneven across categories. In May 2026, ABS reported food and non-alcoholic beverage inflation of 3.3%, but meat and seafood rose 5.4% and dairy and related products increased 5.2%.
Notable Category Movements During Inflation Periods
| Period | Food Inflation | Notable Category Movement |
|---|---|---|
| Dec 2022 | 9.5% | Dairy +14.4% |
| Dec 2023 | 4.5% | Bread/cereals +8.2% |
| Dec 2024 | 3.0% | Fruit/vegetables +6.3% |
| Nov 2025 | 3.3% | Meat/seafood +3.9% |
| Dec 2025 | 3.4% | Food inflation increased |
| Apr 2026 | 2.8% | Lowest recent level |
| May 2026 | 3.3% | Meat/seafood +5.4%; dairy +5.2% |
ABS data shows that food inflation eased to 2.8% in April 2026 before increasing to 3.3% in May.
A real-time monitoring system can identify similar movements at the product level. For example, a retailer or brand could detect that a particular dairy product has increased by 8%, while the broader dairy category has risen by 5.2%.
The data can also reveal promotional patterns. Analysts can identify the frequency of discounts, average discount depth, promotion duration, and changes between promotional and regular pricing. These indicators can provide a more complete picture of consumer-facing inflation.
Real-time data can further support alerts. Businesses can establish rules that flag price changes above a selected threshold, sudden availability changes, new promotions, or products that disappear from an online catalog. This transforms raw product data into an operational intelligence system.
Measuring Inflation Across Australian Grocery Categories
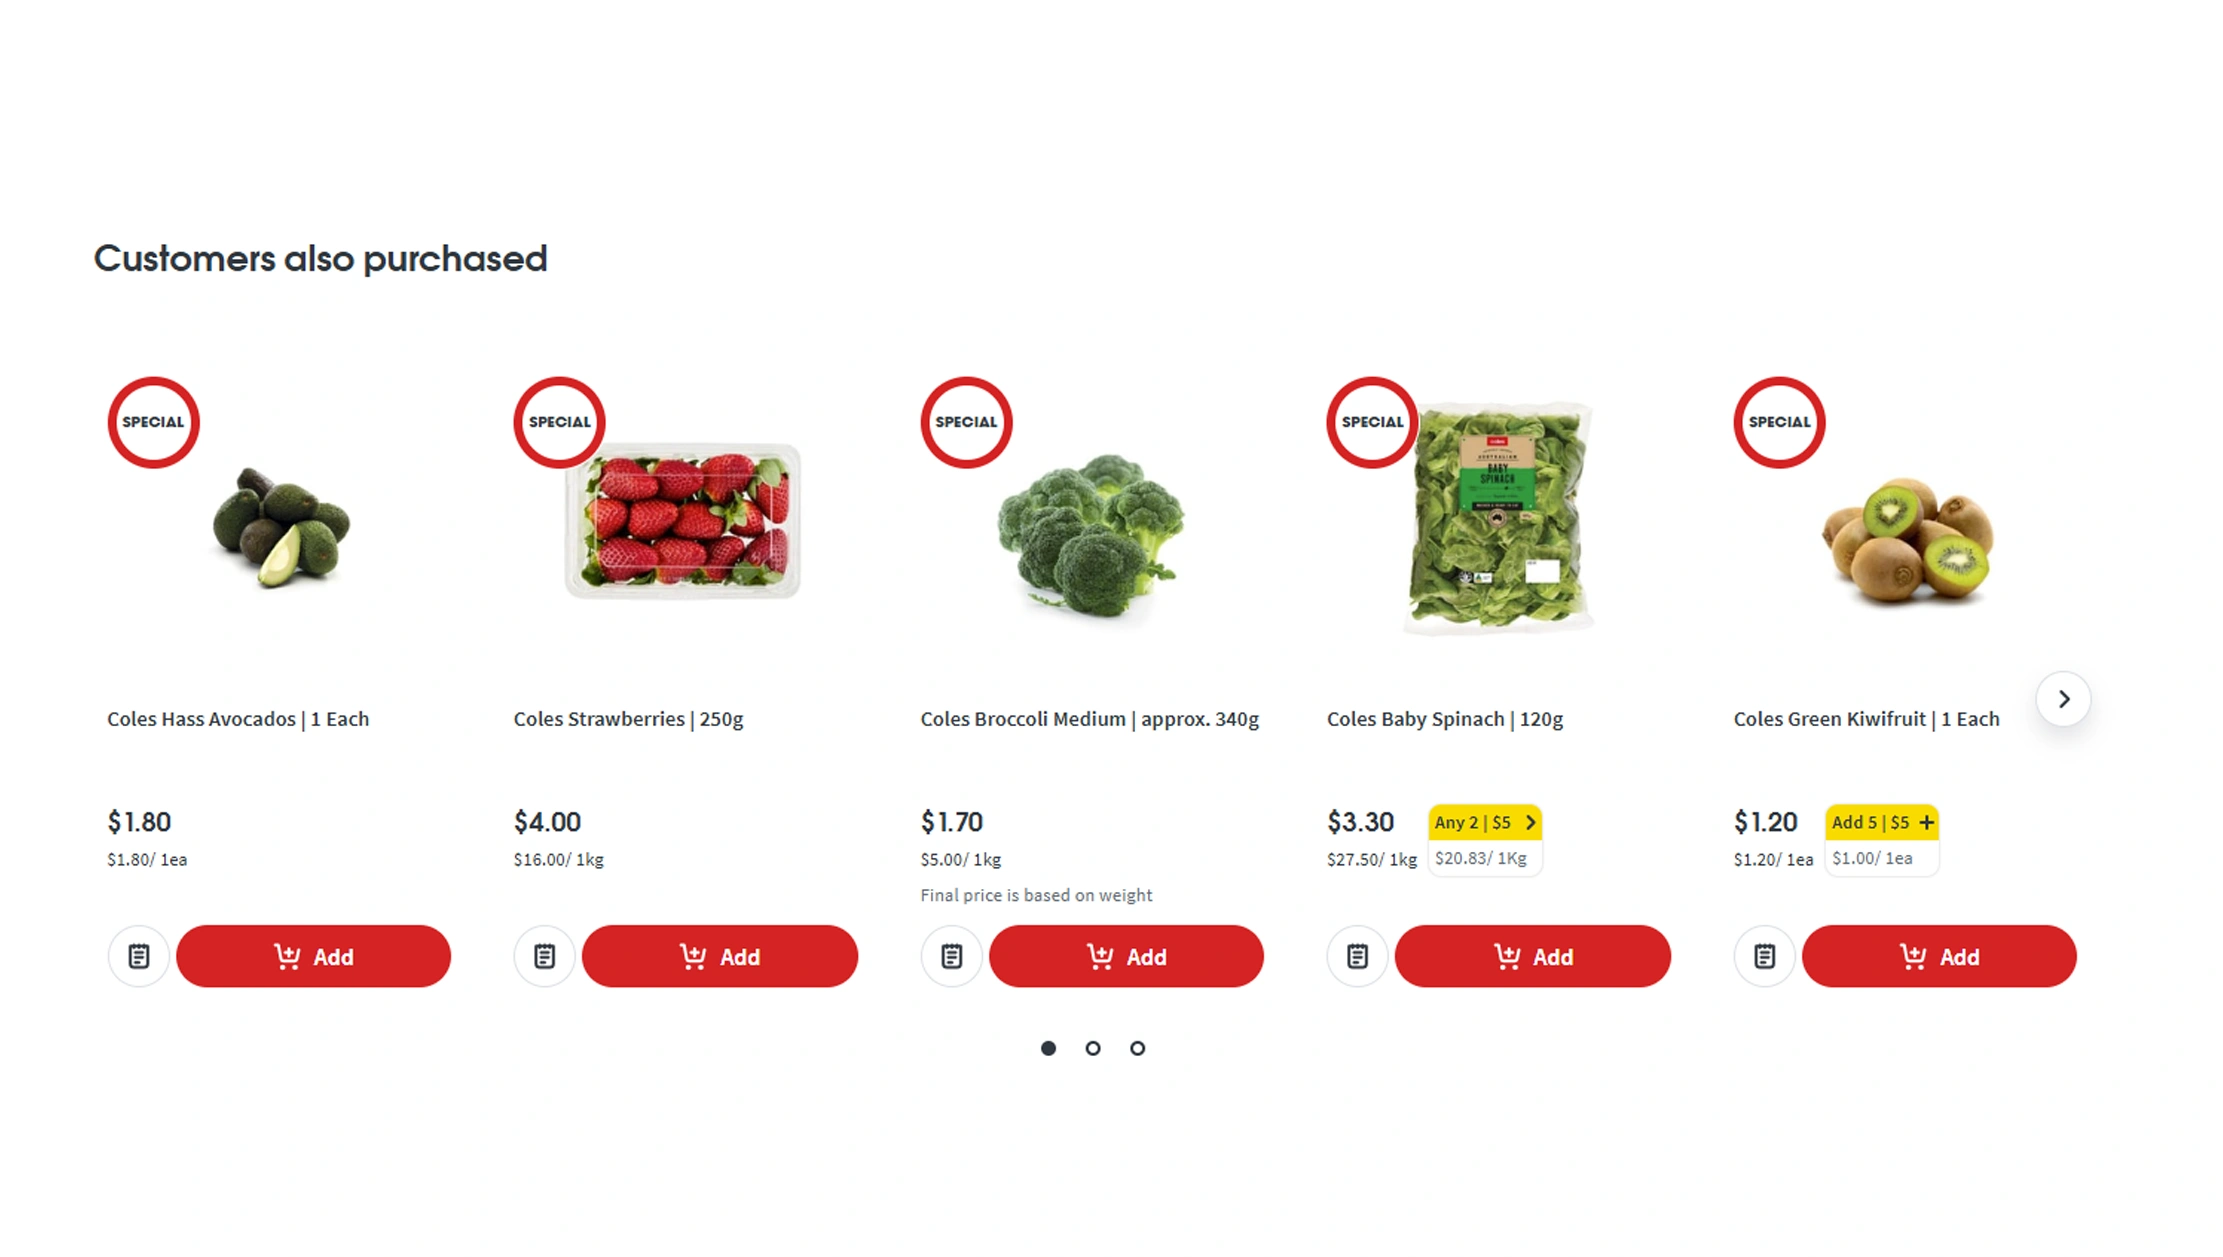
Australian grocery supermarket inflation analysis becomes more effective when product-level observations are combined with official macroeconomic statistics. The ABS CPI provides a national measurement of price changes, while retailer-level datasets can reveal how those changes appear across individual products.
The distinction matters because grocery inflation is rarely uniform. Weather-sensitive fruit and vegetables can experience sudden price fluctuations, while packaged products may respond more gradually to commodity and manufacturing costs. Meat prices can also be influenced by export demand and supply conditions.
In May 2026, ABS reported annual increases of 13.3% for beef and veal and 14.8% for lamb and goat, while dairy and related products increased 5.2%.
Food Inflation and Analytical Interpretation
| Year / Period | Food Inflation | Analytical Interpretation |
|---|---|---|
| 2020 | 2.3% | Low-to-moderate growth |
| 2021 | 1.9% | Relatively stable food prices |
| 2022 | 9.5% | Strong inflationary pressure |
| 2023 | 4.5% | Significant moderation |
| 2024 | 3.0% | Continued easing |
| 2025 | 3.4% | Slight acceleration |
| May 2026 | 3.3% | Persistent category pressure |
The 2022 peak illustrates why historical comparisons matter. Food and non-alcoholic beverage prices rose 9.5% over the year to December 2022, with strong increases across bread, dairy, fruit and vegetables, and other food products. By December 2024, annual food inflation had eased to 3.0%.
Product-level data can be grouped into categories such as fresh produce, meat, seafood, dairy, bakery, beverages, snacks, pantry goods, frozen food, and household essentials. Analysts can then calculate average price changes for each category and compare them with official CPI movements.
Another important metric is inflation dispersion. Instead of calculating only an average, researchers can identify how many products increased, decreased, or remained unchanged. This provides a richer view of pricing conditions.
For example, if a category records 4% average inflation but 70% of products remain unchanged while a small number of products experience substantial increases, the consumer experience may differ from the headline figure. Product-level data can expose this distribution.
Comparing Historical Pricing Patterns and Consumer Impact
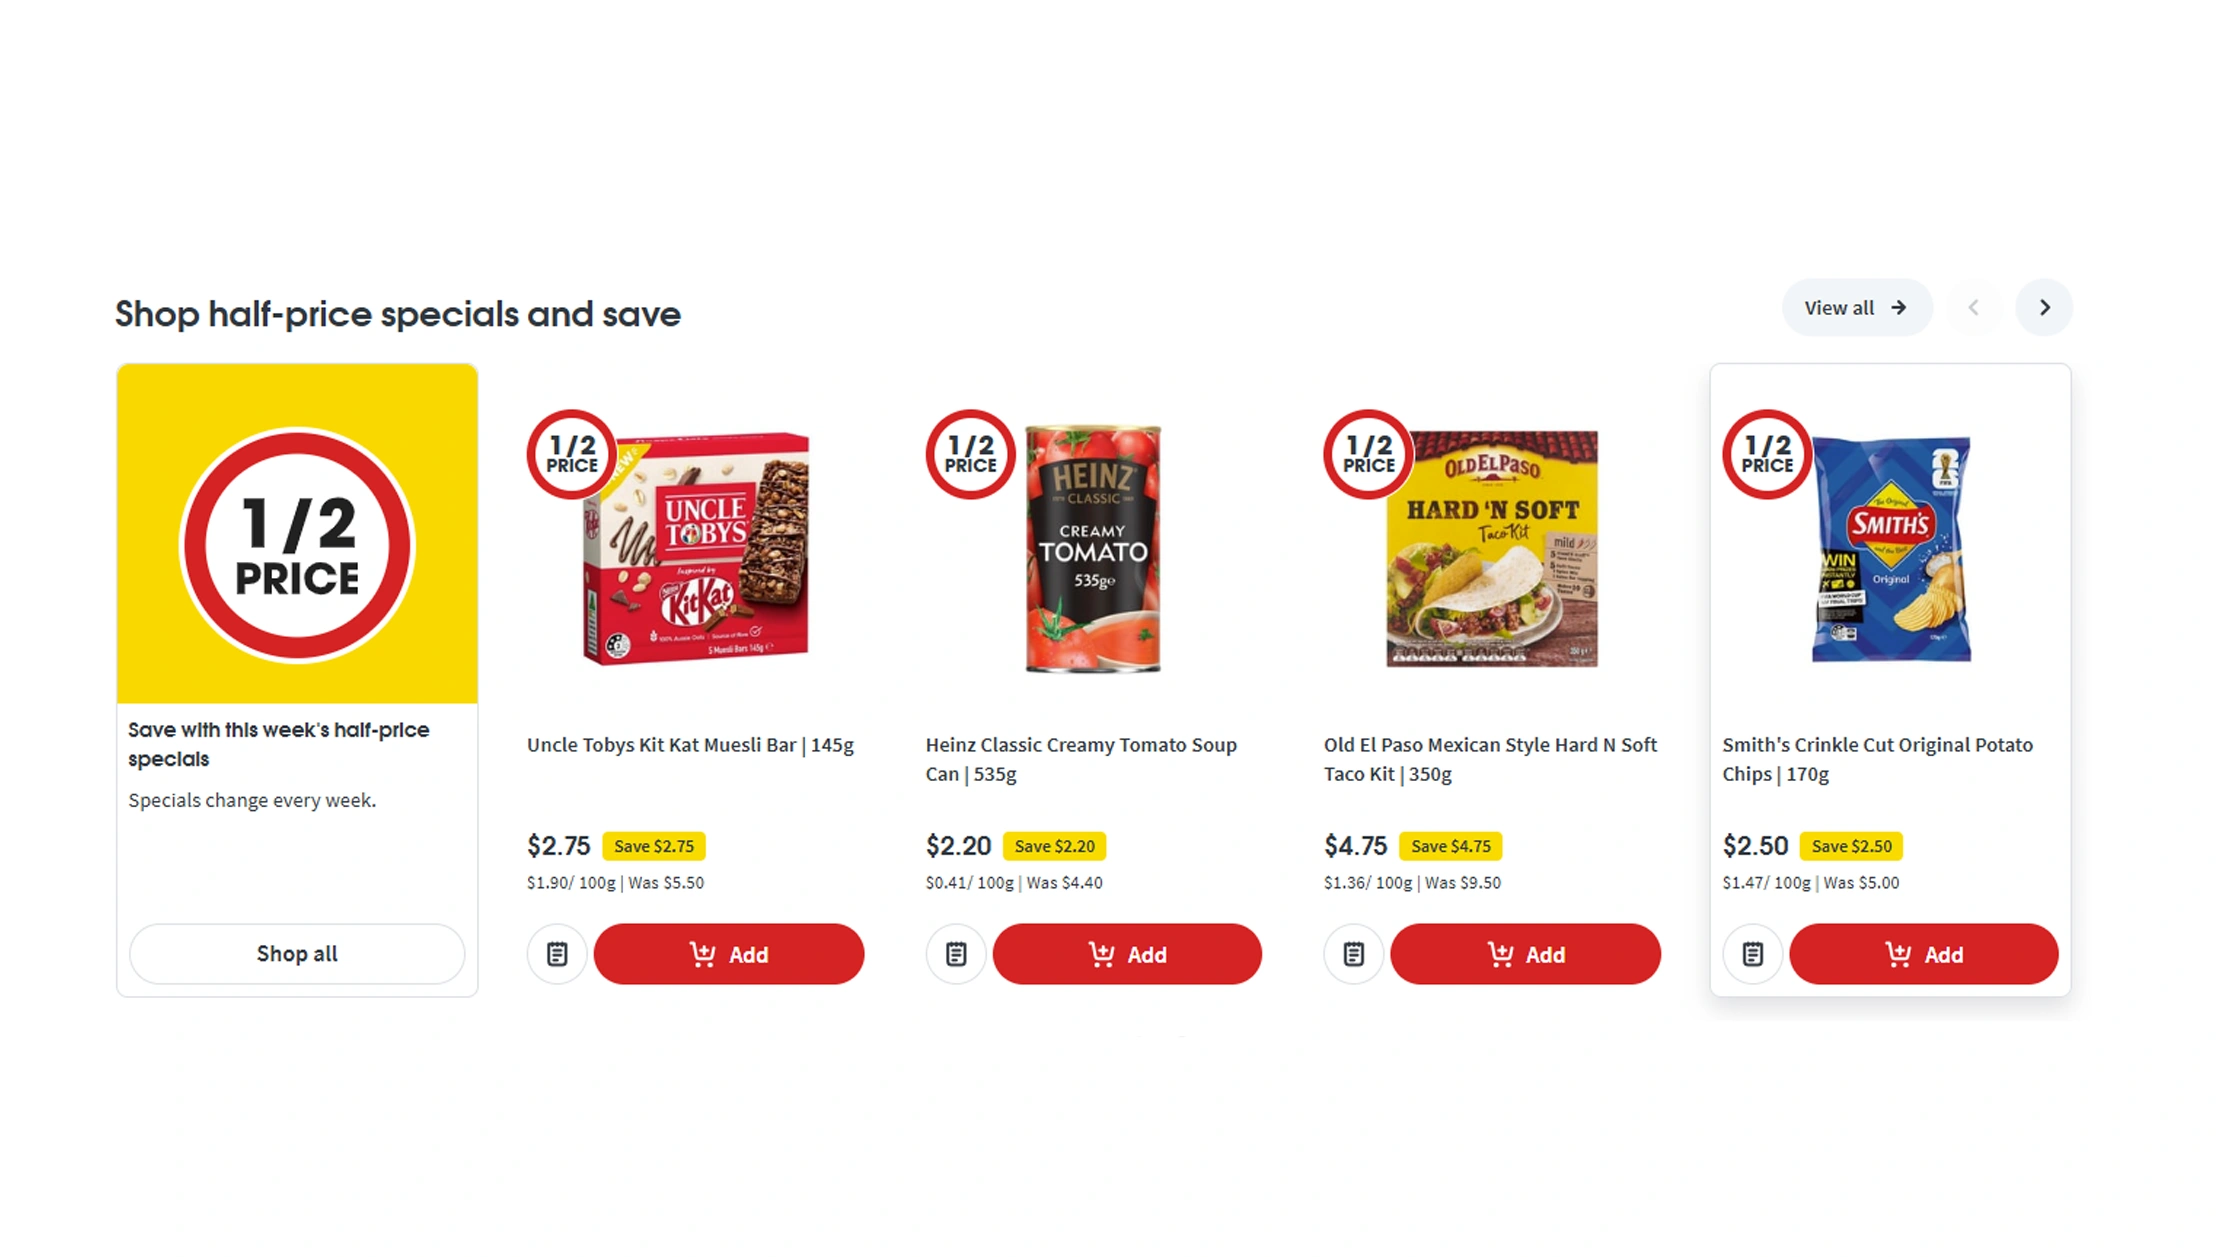
Coles Grocery Price Trends Australia can be studied through longitudinal product datasets that preserve prices over time. This makes it possible to compare current prices against historical observations and determine whether changes are temporary, seasonal, promotional, or part of a longer-term trend.
The Coles Australian grocery inflation report can therefore complement official inflation measurements by connecting macroeconomic indicators with observable online grocery pricing.
Retail Research Opportunities by Year
| Year | Food Inflation | Retail Research Opportunity |
|---|---|---|
| 2020 | 2.3% | Build historical benchmark |
| 2021 | 1.9% | Establish normal price movement |
| 2022 | 9.5% | Study inflation shock |
| 2023 | 4.5% | Track post-peak normalization |
| 2024 | 3.0% | Analyze price stabilization |
| 2025 | 3.4% | Detect renewed increases |
| May 2026 | 3.3% | Monitor current conditions |
The 2023 and 2024 data demonstrate the moderation that followed the 2022 peak. Food inflation fell from 9.5% in December 2022 to 4.5% in December 2023 and 3.0% in December 2024.
A historical product database can calculate price indexes for individual products and categories. Researchers can also measure cumulative price increases. For example, if a product rises from $3.00 to $3.60 over several years, the cumulative increase is 20%, even if annual changes appear relatively small.
Promotional pricing should be analyzed separately from regular pricing. Grocery retailers frequently use discounts to influence purchasing behaviour, so a simple comparison of displayed prices may not represent the typical price paid by consumers.
Another useful metric is price volatility. Products with frequent price changes may require more frequent monitoring than products with relatively stable prices. Fresh produce, seasonal goods, and promotional categories can receive higher monitoring frequency.
The resulting dataset can support consumer affordability studies, competitive pricing research, category intelligence, and retail strategy. It can also help brands understand how their products are positioned relative to competing products during inflationary periods.
Creating a Reusable Digital Grocery Dataset
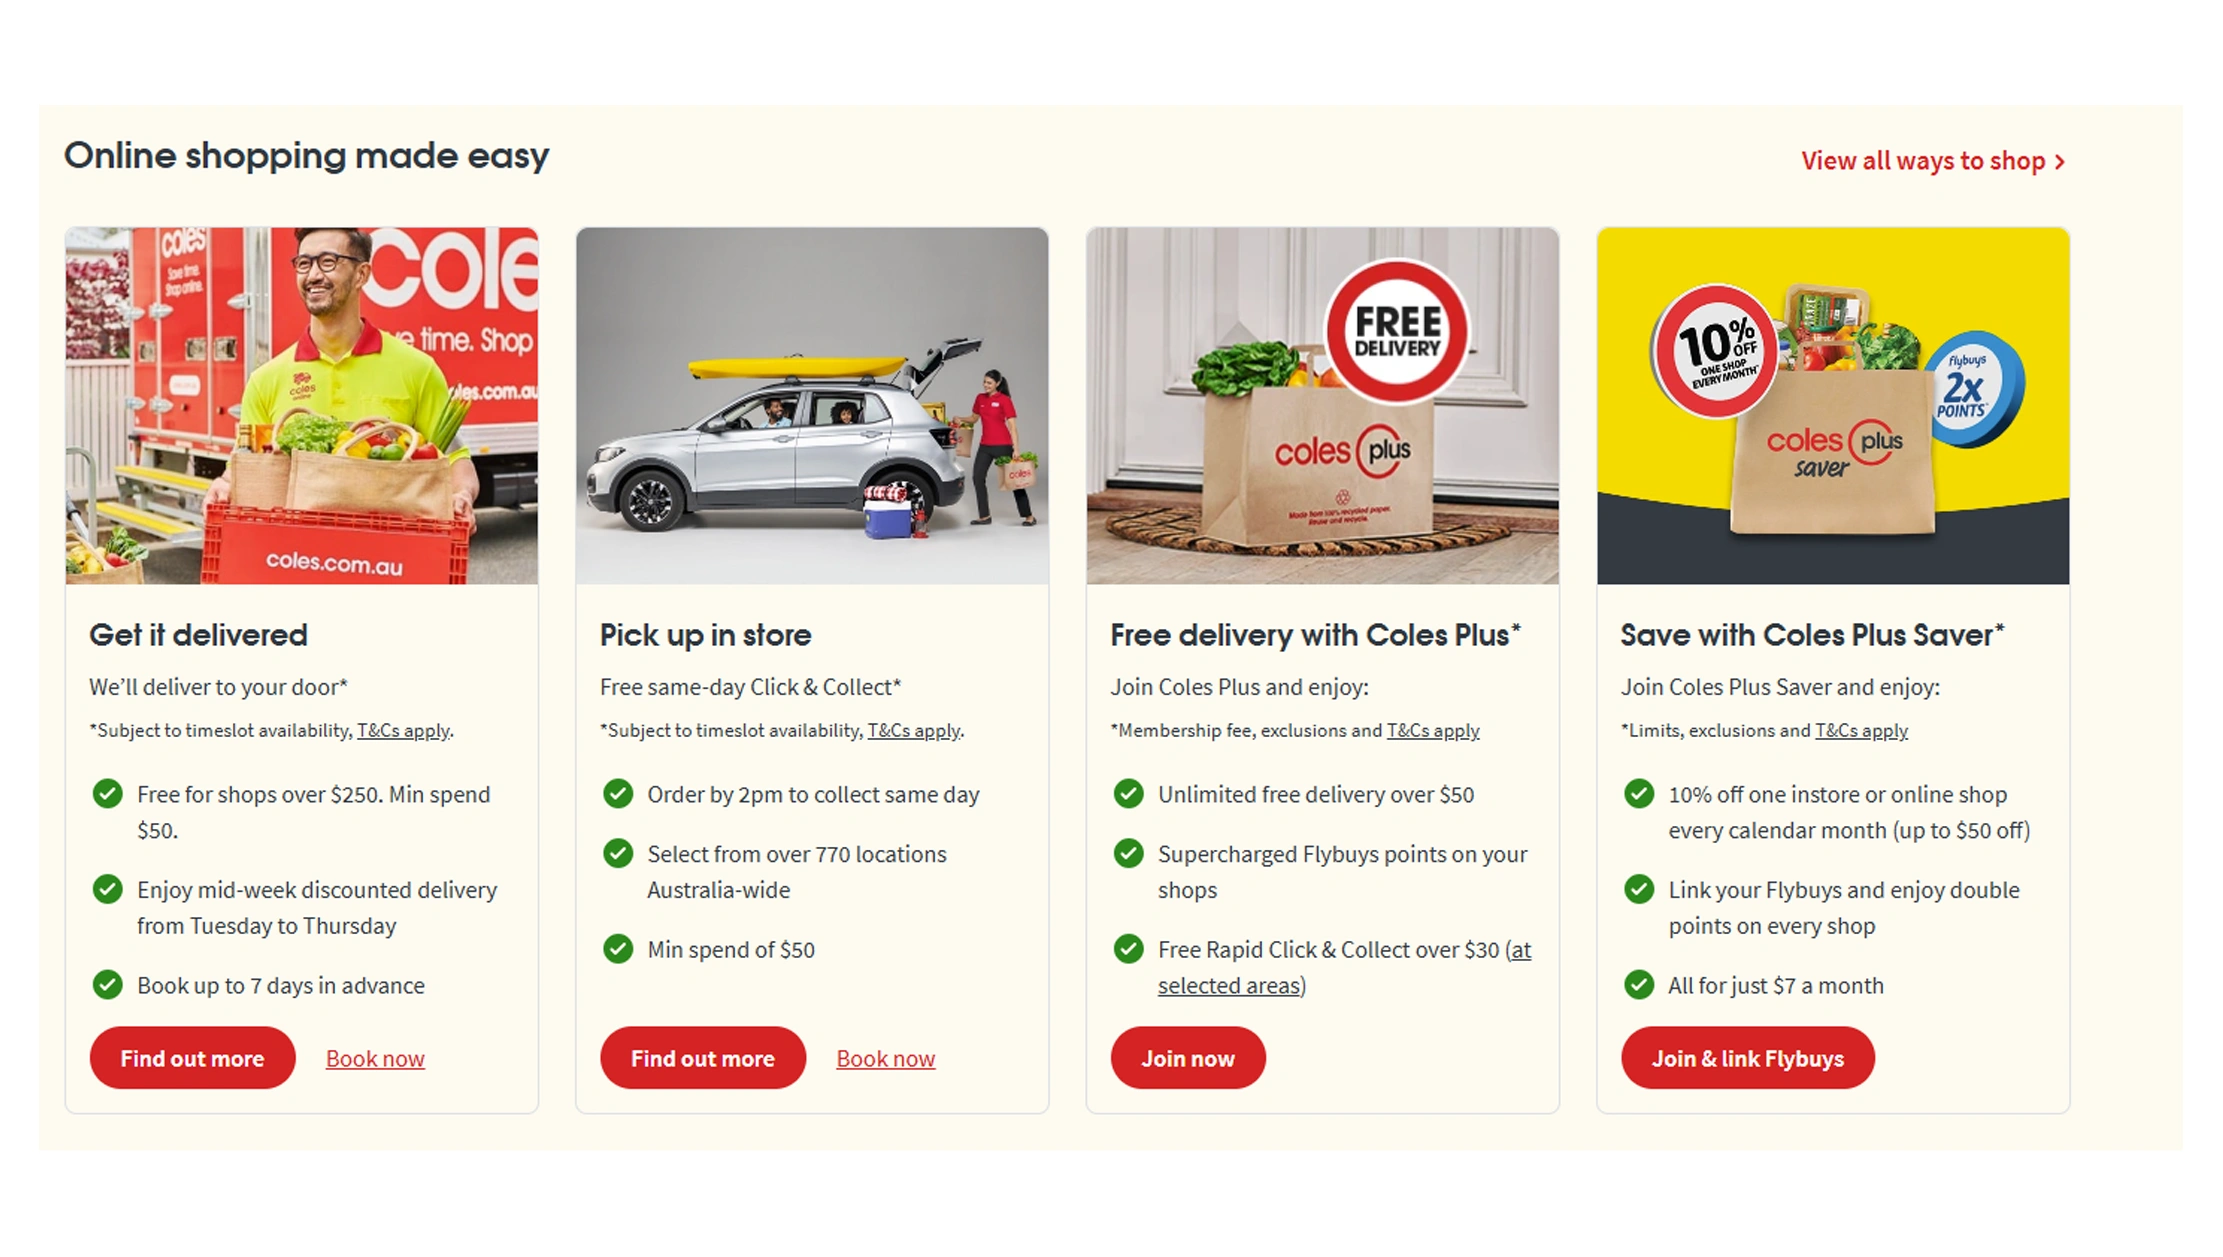
A Web Scraping Coles Online Dataset can serve as a reusable foundation for pricing intelligence, market research, assortment monitoring, and grocery analytics. Rather than collecting data for a single report, businesses can maintain a historical database that continuously records product changes.
A robust dataset should include product identifiers, names, brands, categories, subcategories, package sizes, prices, unit prices, promotional information, availability, ratings where available, product URLs, and timestamps.
Dataset Priorities by Year
| Year | Food Inflation | Dataset Priority |
|---|---|---|
| 2020 | 2.3% | Historical baseline |
| 2021 | 1.9% | Stable-price reference |
| 2022 | 9.5% | Inflation-event analysis |
| 2023 | 4.5% | Trend normalization |
| 2024 | 3.0% | Category comparison |
| 2025 | 3.4% | Renewed monitoring |
| 2026* | 3.3% | Current intelligence |
*May 2026 annual movement.
The ABS data confirms that food inflation remained a significant contributor to household price changes in 2025 and 2026. In December 2025, food and non-alcoholic beverages increased 3.4% annually, while in May 2026 the increase was 3.3%.
A structured online dataset can support several analytical processes. Product matching can identify equivalent items across different periods or retailers. Unit-price normalization can make products with different package sizes comparable. Historical snapshots can calculate cumulative inflation and price volatility.
The dataset can also be integrated with business intelligence systems. Analysts may create dashboards showing average category prices, price changes, promotional frequency, availability rates, and inflation trends. Data can be segmented by product type, brand, category, location, or time period.
Data validation is essential. Duplicate products, missing prices, inconsistent units, incorrect categories, and stale availability values can distort analysis. Automated validation rules can identify anomalies before information reaches downstream dashboards.
For businesses operating multiple grocery-data projects, the same schema can be extended to additional retailers. This creates a standardized retail intelligence environment where products can be matched and prices compared across multiple sources.
Automating Grocery Intelligence at Scale
A Coles Grocery Scraper can automate the collection of online product information and provide a consistent stream of structured retail data. Automation is particularly useful when the objective is to monitor thousands of products repeatedly rather than perform a one-time catalog review.
The value of automation becomes clearer during periods of changing inflation. When food prices move rapidly, manually collecting product prices can produce outdated results before analysis is complete. Automated extraction allows businesses to establish scheduled collection intervals based on their monitoring requirements.
Automation Requirements by Inflation Period
| Period | Food Inflation | Automation Requirement |
|---|---|---|
| 2020 | 2.3% | Periodic data collection |
| 2021 | 1.9% | Historical monitoring |
| 2022 | 9.5% | Increased refresh frequency |
| 2023 | 4.5% | Promotional tracking |
| 2024 | 3.0% | Category benchmarking |
| 2025 | 3.4% | Continuous monitoring |
| May 2026 | 3.3% | Near-real-time intelligence |
The 2022 inflation peak demonstrates why high-frequency monitoring can become important. Food inflation reached 9.5% that year, while several categories experienced double-digit increases. By comparison, annual food inflation was 3.0% in December 2024 and 3.4% in December 2025.
An automated pipeline can collect product records, normalize fields, compare new observations against historical values, and deliver structured outputs to databases or analytics systems. This eliminates much of the repetitive work involved in manual monitoring.
Businesses can also configure alerts for significant price changes. For example, an alert can be generated when a product increases by more than 5%, when a promotion begins or ends, or when an item changes from available to unavailable.
The same infrastructure can support competitive benchmarking. By collecting equivalent products from multiple retailers, analysts can compare prices, promotions, assortment depth, and availability.
Automation also improves consistency. Scheduled collection creates a repeatable methodology, while timestamped records establish an audit trail for historical analysis.
Why Choose Real Data API?
Real Data API provides an API-driven approach for organizations that need structured web data for retail research, competitive intelligence, pricing analytics, and business intelligence. Instead of depending on manually maintained spreadsheets, businesses can establish automated data pipelines that collect and structure information for recurring analysis.
A Grocery Delivery Dashboard can use structured product information to display prices, promotions, product availability, categories, brands, and historical changes in a centralized interface. Such dashboards can help pricing teams and analysts identify important market movements without manually reviewing thousands of product pages.
The Coles Australian grocery inflation report demonstrates how retailer-level product information can complement official economic statistics. ABS inflation figures provide the broader market context, while detailed product data can reveal how pricing changes are distributed across products and categories.
Real Data API can support workflows that require structured data extraction, recurring collection, data normalization, and integration with analytical systems. Historical data can be retained to support trend analysis, while current records can support operational monitoring.
For grocery businesses, brands, researchers, and technology providers, this creates opportunities to build pricing dashboards, competitor monitoring systems, assortment intelligence platforms, market research databases, and product analytics applications.
Conclusion
Australian food inflation has moved through several distinct phases since 2020. Food and non-alcoholic beverage inflation was relatively moderate in 2020 and 2021, accelerated sharply to 9.5% in 2022, and then eased to 4.5% in 2023 and 3.0% in 2024. It increased slightly to 3.4% in December 2025 before reaching 3.3% in the 12 months to May 2026.
The Coles Australian grocery inflation report provides a practical framework for understanding these movements at the product level. By collecting product prices, promotional information, package sizes, categories, brands, and availability over time, businesses can move beyond broad inflation indicators and examine the actual retail pricing environment.
Product-level data can reveal which categories are experiencing the strongest pressure, which products are frequently discounted, how prices change over time, and where consumer-facing costs are diverging from broader market averages. Combining structured grocery data with official CPI statistics creates a stronger foundation for pricing intelligence and retail market research.
For businesses operating in Australia's competitive grocery sector, automated data collection can reduce manual research while creating consistent historical records for analysis.
Ready to transform grocery pricing data into actionable retail intelligence? Contact Real Data API today to build a scalable grocery data extraction and monitoring solution tailored to your pricing, inflation, and competitive research needs!
Latest posts

How to Track Global Anime Viewing Trends via Crunchyroll Data Scraping for Smarter Audience Insights?

How to Scrape streaming content trends using HBO Max data for Smarter Content Strategy?

Traveloka Data Scraping For Travel Price Intelligence - How To Monitor Price Changes, Discounts, And Travel Demand
How Bolt Food Data Scraping for Food Delivery Market Trends Helps Businesses Overcome Delivery Market Intelligence Challenges?






.png)



