Introduction
Real estate valuation depends on timely, granular, and reliable property information. Traditional valuation methods often rely on historical transactions, manually collected comparable properties, broker opinions, and periodic market reports. These approaches can become less effective when listing prices, inventory, buyer demand, and neighborhood conditions change rapidly. Automated property data collection provides a practical way to build a continuously updated view of the market.
Businesses can Scrape home prices using HouseSigma property data to organize property listings, historical pricing information, property characteristics, listing activity, and location-level signals into structured datasets. This information can support valuation models, investment research, market monitoring, competitive analysis, and pricing strategies.
The Canadian housing market demonstrates why granular data matters. CREA reported that the national average home price reached $702,079 in May 2026, up 1.5% year over year, while the MLS Home Price Index was down 4.1% year over year. By June 2026, the national average price remained close to $700,000, while the HPI decline narrowed to 3.6%.
A structured data pipeline can help businesses distinguish between broad national movements and neighborhood-level changes. Instead of evaluating a property using a single average, analysts can compare similar homes by location, property type, size, bedrooms, bathrooms, listing history, and transaction timing.
For organizations building automated valuation models, investment dashboards, or property intelligence platforms, a scalable HouseSigma Data Scraping API can help transform publicly accessible property information into analysis-ready datasets, subject to applicable website terms, permissions, and data-use requirements.
Turning Property Listings Into Structured Market Intelligence
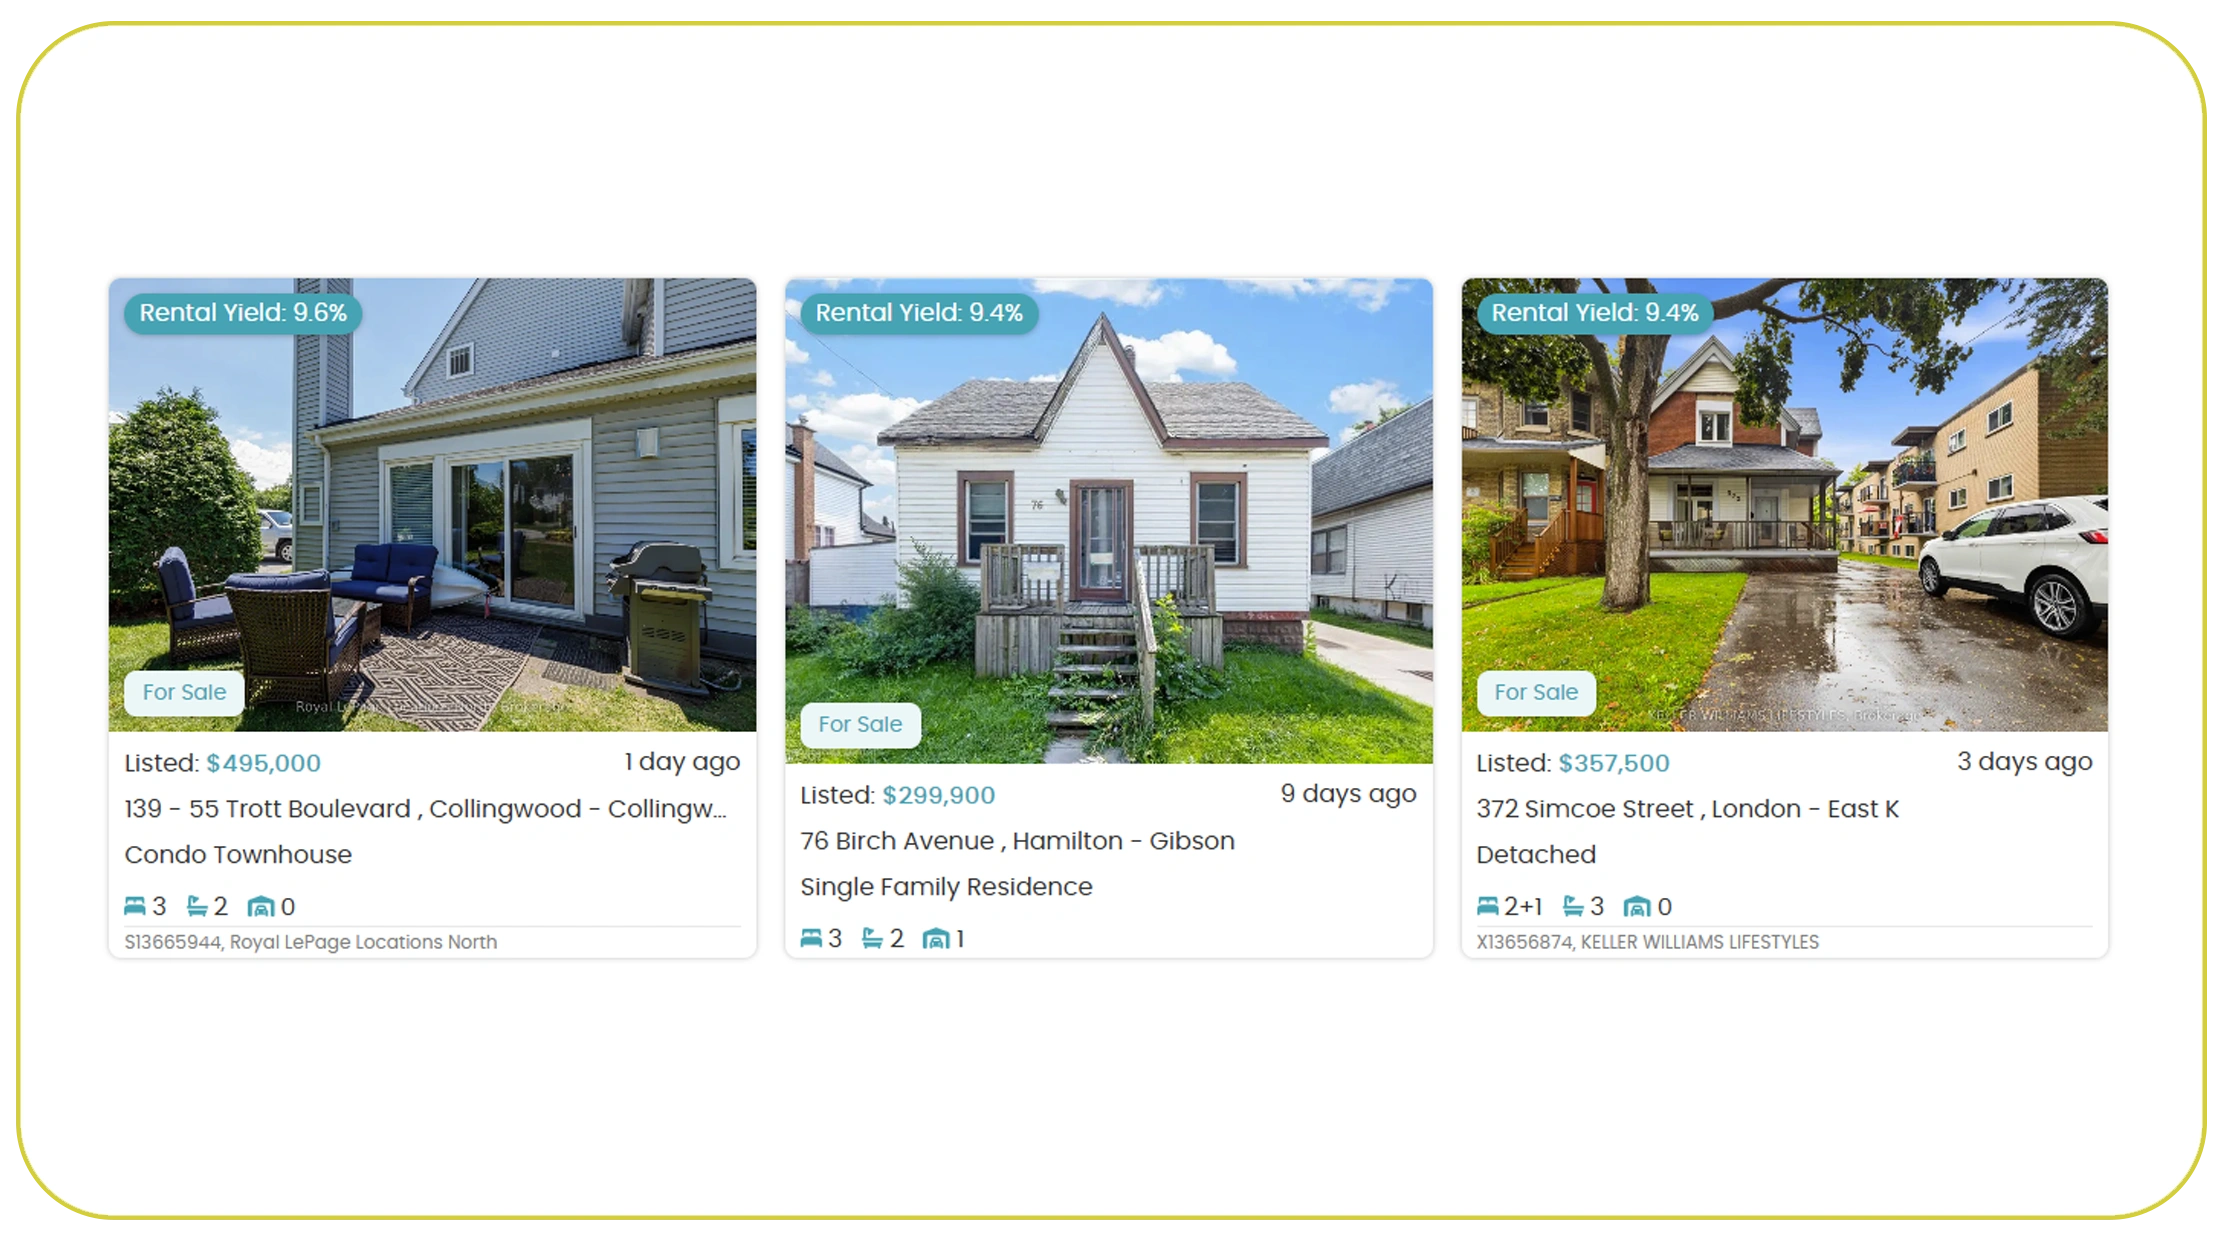
Extract HouseSigma property listings data to create a standardized property intelligence workflow that captures the attributes required for valuation and market analysis. A useful dataset can contain listing price, sold price where available, property type, bedrooms, bathrooms, square footage, location, listing date, price changes, status, and other relevant property characteristics.
The primary advantage is consistency. When property records are collected in a standardized format, analysts can compare hundreds or thousands of properties without manually switching between listings. Records can also be deduplicated and enriched with calculated fields such as price per square foot, days on market, price-change percentage, and listing-to-sale differences.
From 2020 onward, Canadian housing conditions have moved through several distinct phases. The pandemic period produced rapid changes in demand and pricing, followed by higher borrowing costs and a cooling period. More recently, activity has shown signs of stabilization. CREA reported that national home sales increased 0.9% month over month in April 2026, 5.5% in May, and another 0.5% in June.
| Year | Market-data priority | Valuation challenge |
|---|---|---|
| 2020 | Listing and transaction monitoring | Rapid demand shifts |
| 2021 | Sold-price comparison | Accelerating prices |
| 2022 | Price-change tracking | Market reversal |
| 2023 | Inventory monitoring | Regional divergence |
| 2024 | Comparable-property analysis | Uneven recovery |
| 2025 | Listing and sale monitoring | Economic uncertainty |
| 2026 | Real-time market intelligence | Stabilizing but mixed conditions |
By extracting structured listing records, businesses can create historical datasets that support comparable-property selection, automated reporting, and neighborhood-level market analysis.
Improving Comparable-Property Analysis With Historical Records
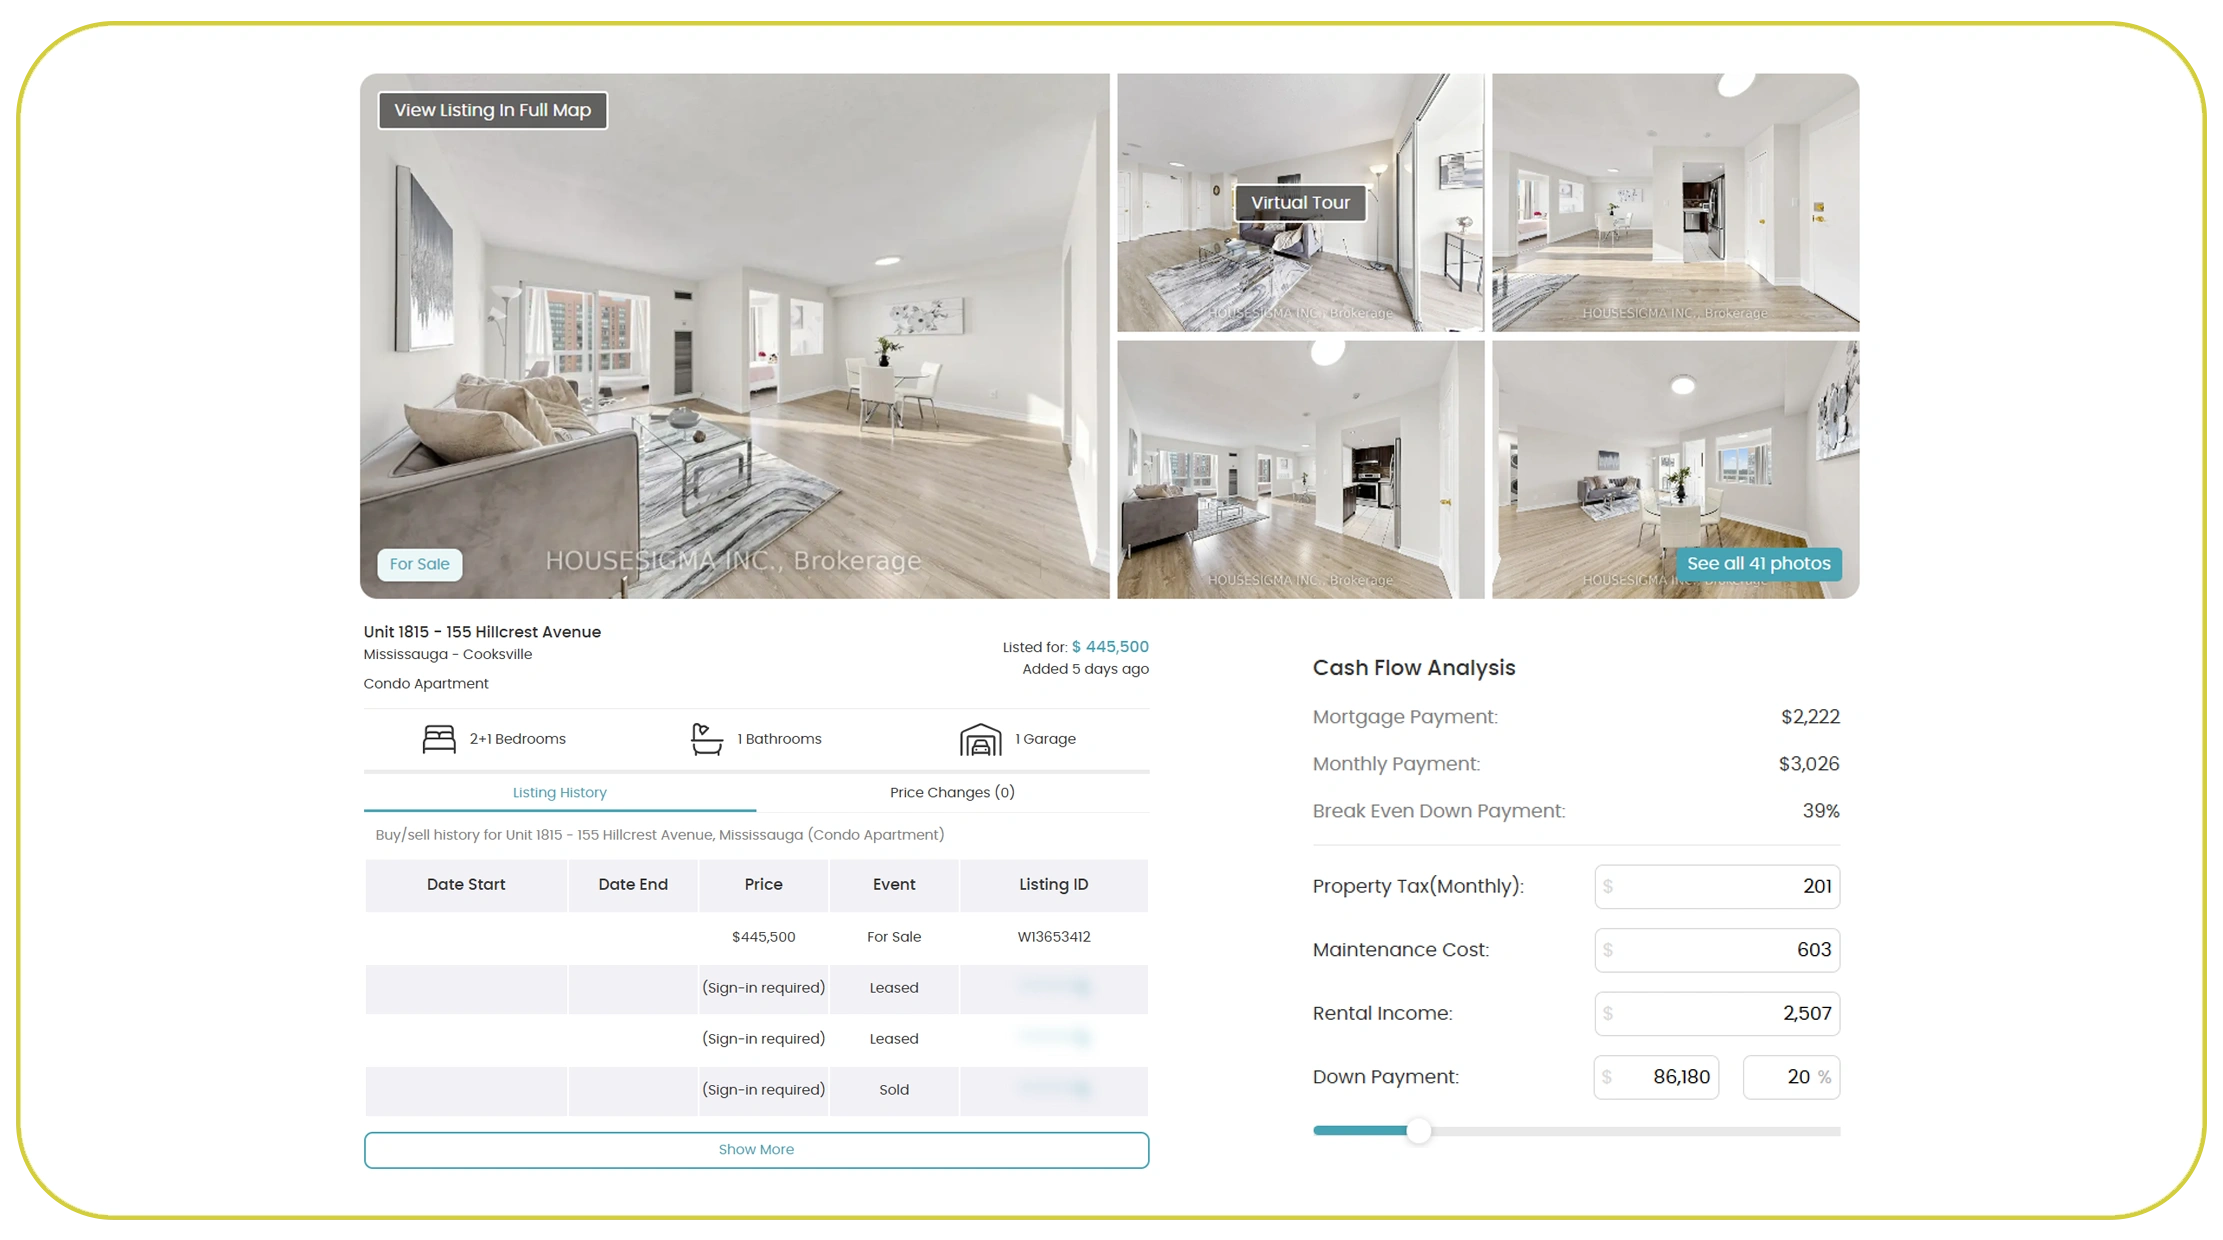
Residential property prices using HouseSigma data Scraper can help analysts build comparable-property datasets rather than relying on broad averages. Comparable analysis becomes more useful when properties are matched according to meaningful characteristics such as neighborhood, property type, floor area, bedroom count, bathroom count, construction characteristics, and transaction date.
For example, an analyst evaluating a detached home should not simply compare it with every property sold within a city. A better approach is to identify recently sold detached properties within a defined geographic radius and then normalize their prices based on size and characteristics. The same methodology can be applied to condos, townhouses, and other property categories.
This is particularly important in markets where prices vary substantially between neighborhoods. CREA itself cautions that national average prices are useful for identifying trends but do not represent actual prices in areas with widely different neighborhoods and property mixes.
| Year | Comparable-data objective | Example metric |
|---|---|---|
| 2020 | Establish baseline | Median sold price |
| 2021 | Capture appreciation | Year-over-year change |
| 2022 | Detect correction | Price decline |
| 2023 | Compare neighborhoods | Price per sq. ft. |
| 2024 | Monitor recovery | Sales-to-list ratio |
| 2025 | Track uncertainty | Days on market |
| 2026 | Update valuation models | Recent comparable sales |
A structured scraper can therefore support repeatable comparable-property workflows. Instead of manually selecting a few properties, analysts can create rules for filtering and ranking comparable homes.
The resulting dataset can feed valuation models, investment scoring systems, broker dashboards, and property research tools. When combined with historical records, it can also reveal whether a current listing is priced above, below, or near comparable market levels.
Understanding Regional Housing Movements Across Canada
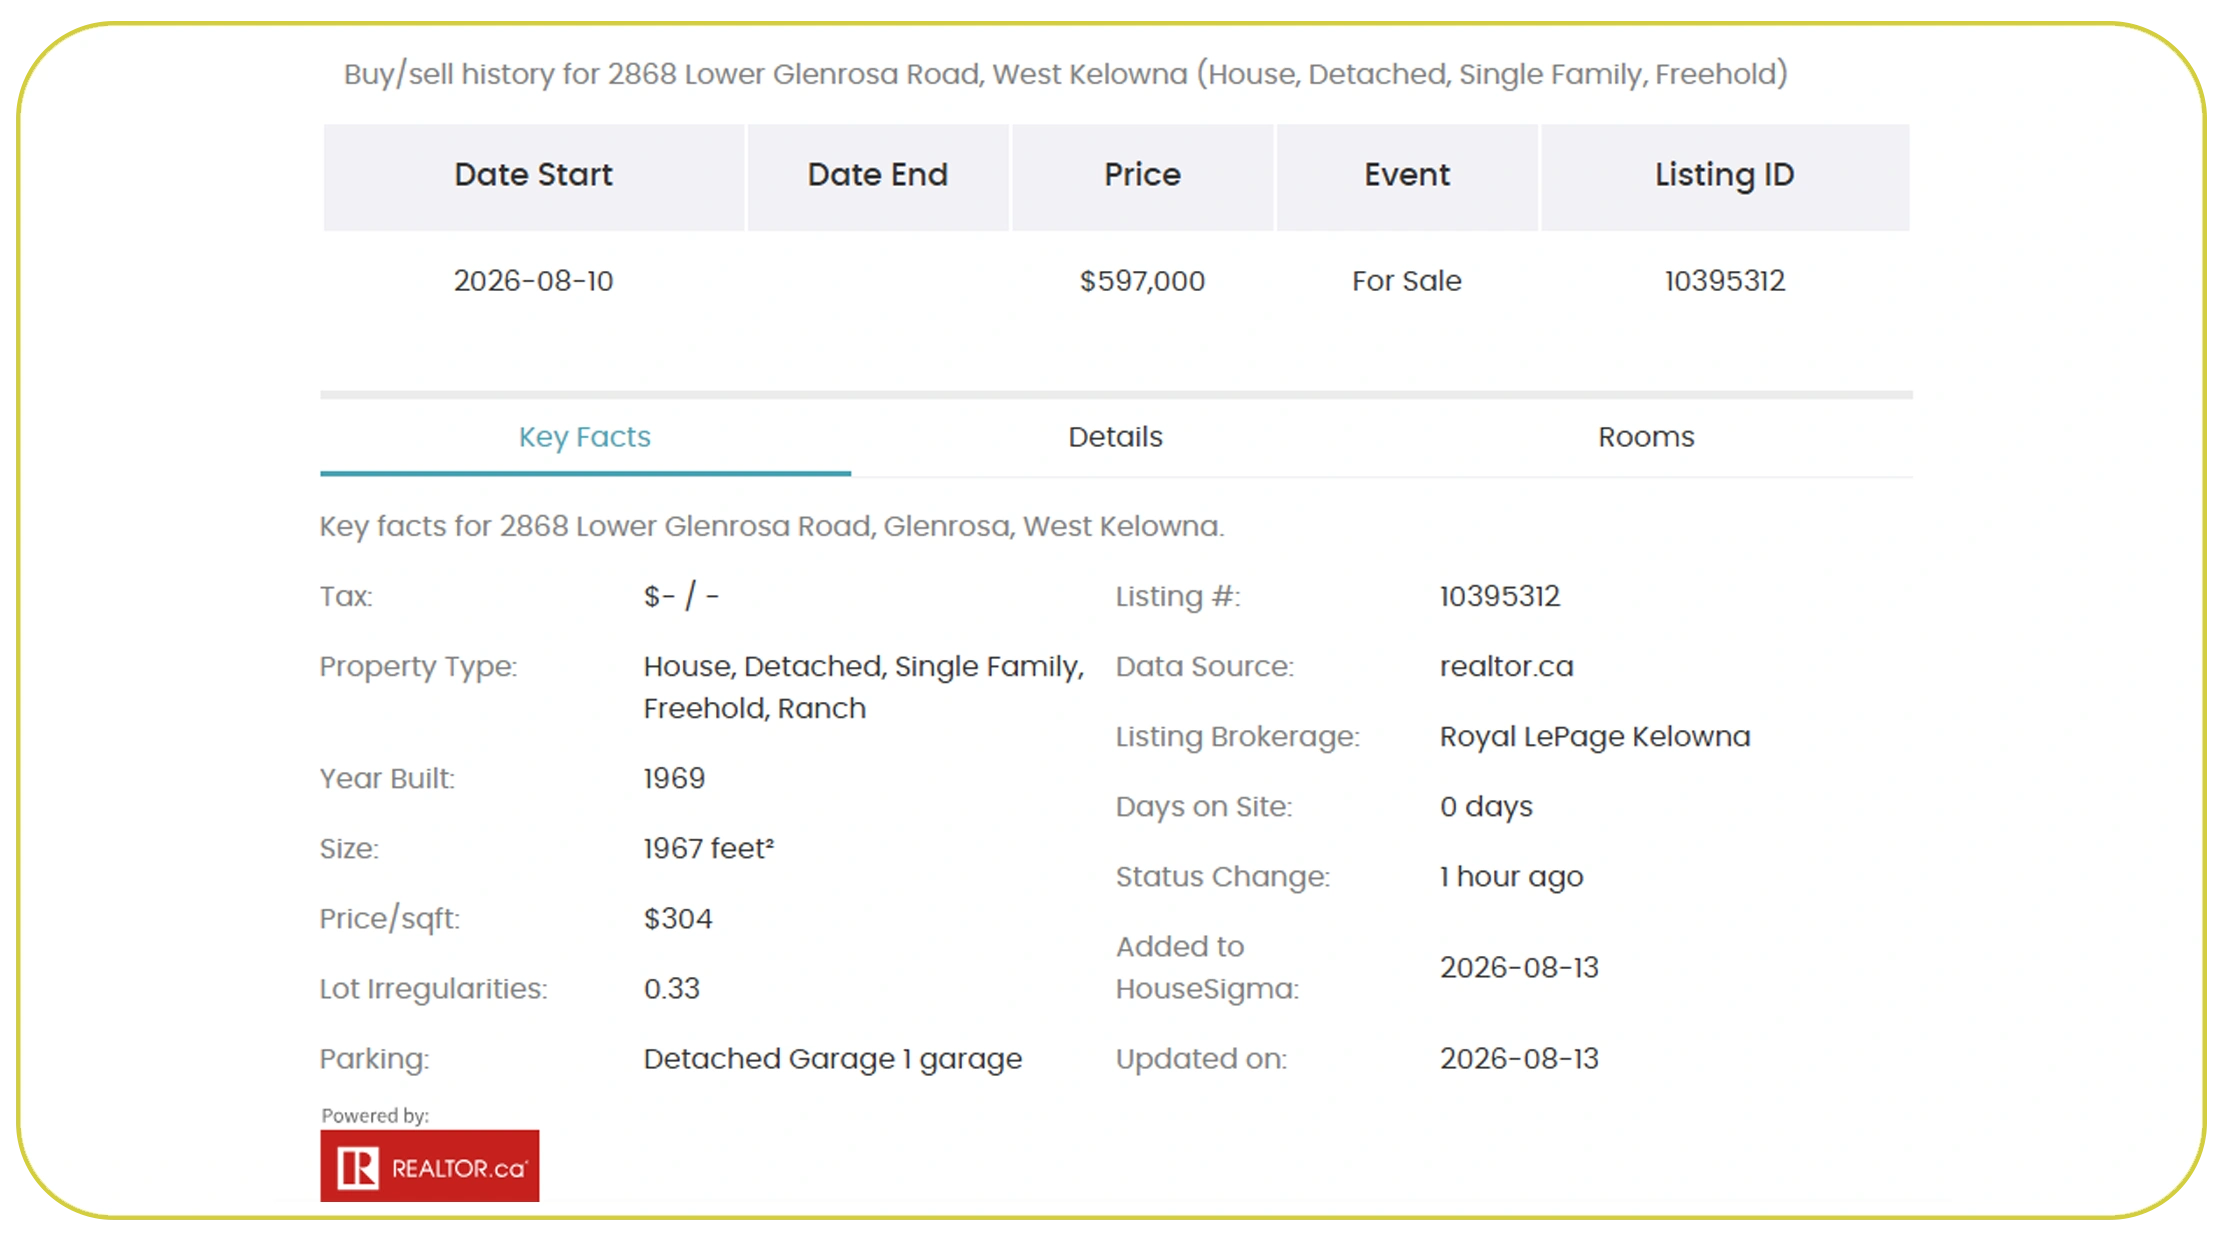
Canadian real estate market trends via HouseSigma API can be analyzed at a much more granular level than national statistics alone. Canada contains highly diverse housing markets, meaning national averages can hide important differences between provinces, cities, neighborhoods, and property types.
Toronto provides a useful illustration. CREA data for Q2 2026 shows that residential sales in the Greater Toronto Area reached 19,269 units, 7.4% higher than Q2 2025. However, median prices were lower year over year across major housing categories: detached homes were down 4.1%, semi-detached homes 7.8%, condo townhouses 7.0%, and condo apartments 8.9%.
This demonstrates why transaction volume and price movement should be analyzed together.
| Year | Regional analysis focus | Important indicator |
|---|---|---|
| 2020 | Pandemic demand | Sales acceleration |
| 2021 | Market expansion | Price appreciation |
| 2022 | Rate-driven correction | Price decline |
| 2023 | Market normalization | Inventory |
| 2024 | Recovery signals | Sales volume |
| 2025 | Regional divergence | Listing activity |
| 2026 | Stabilization | Sales and HPI |
A property intelligence system can segment records by city, postal region, neighborhood, housing type, and price range. Analysts can then identify locations where prices are rising faster than the broader market or where inventory is increasing while demand weakens.
CREA reported 208,578 properties listed for sale across Canadian MLS systems at the end of June 2026, up 0.6% from a year earlier, with 4.8 months of inventory nationally.
These signals become more actionable when combined with property-level information. Investors can identify neighborhoods with changing inventory, while valuation teams can adjust comparable-property models according to local market conditions.
Building a Reliable Historical Resource for Pricing Decisions
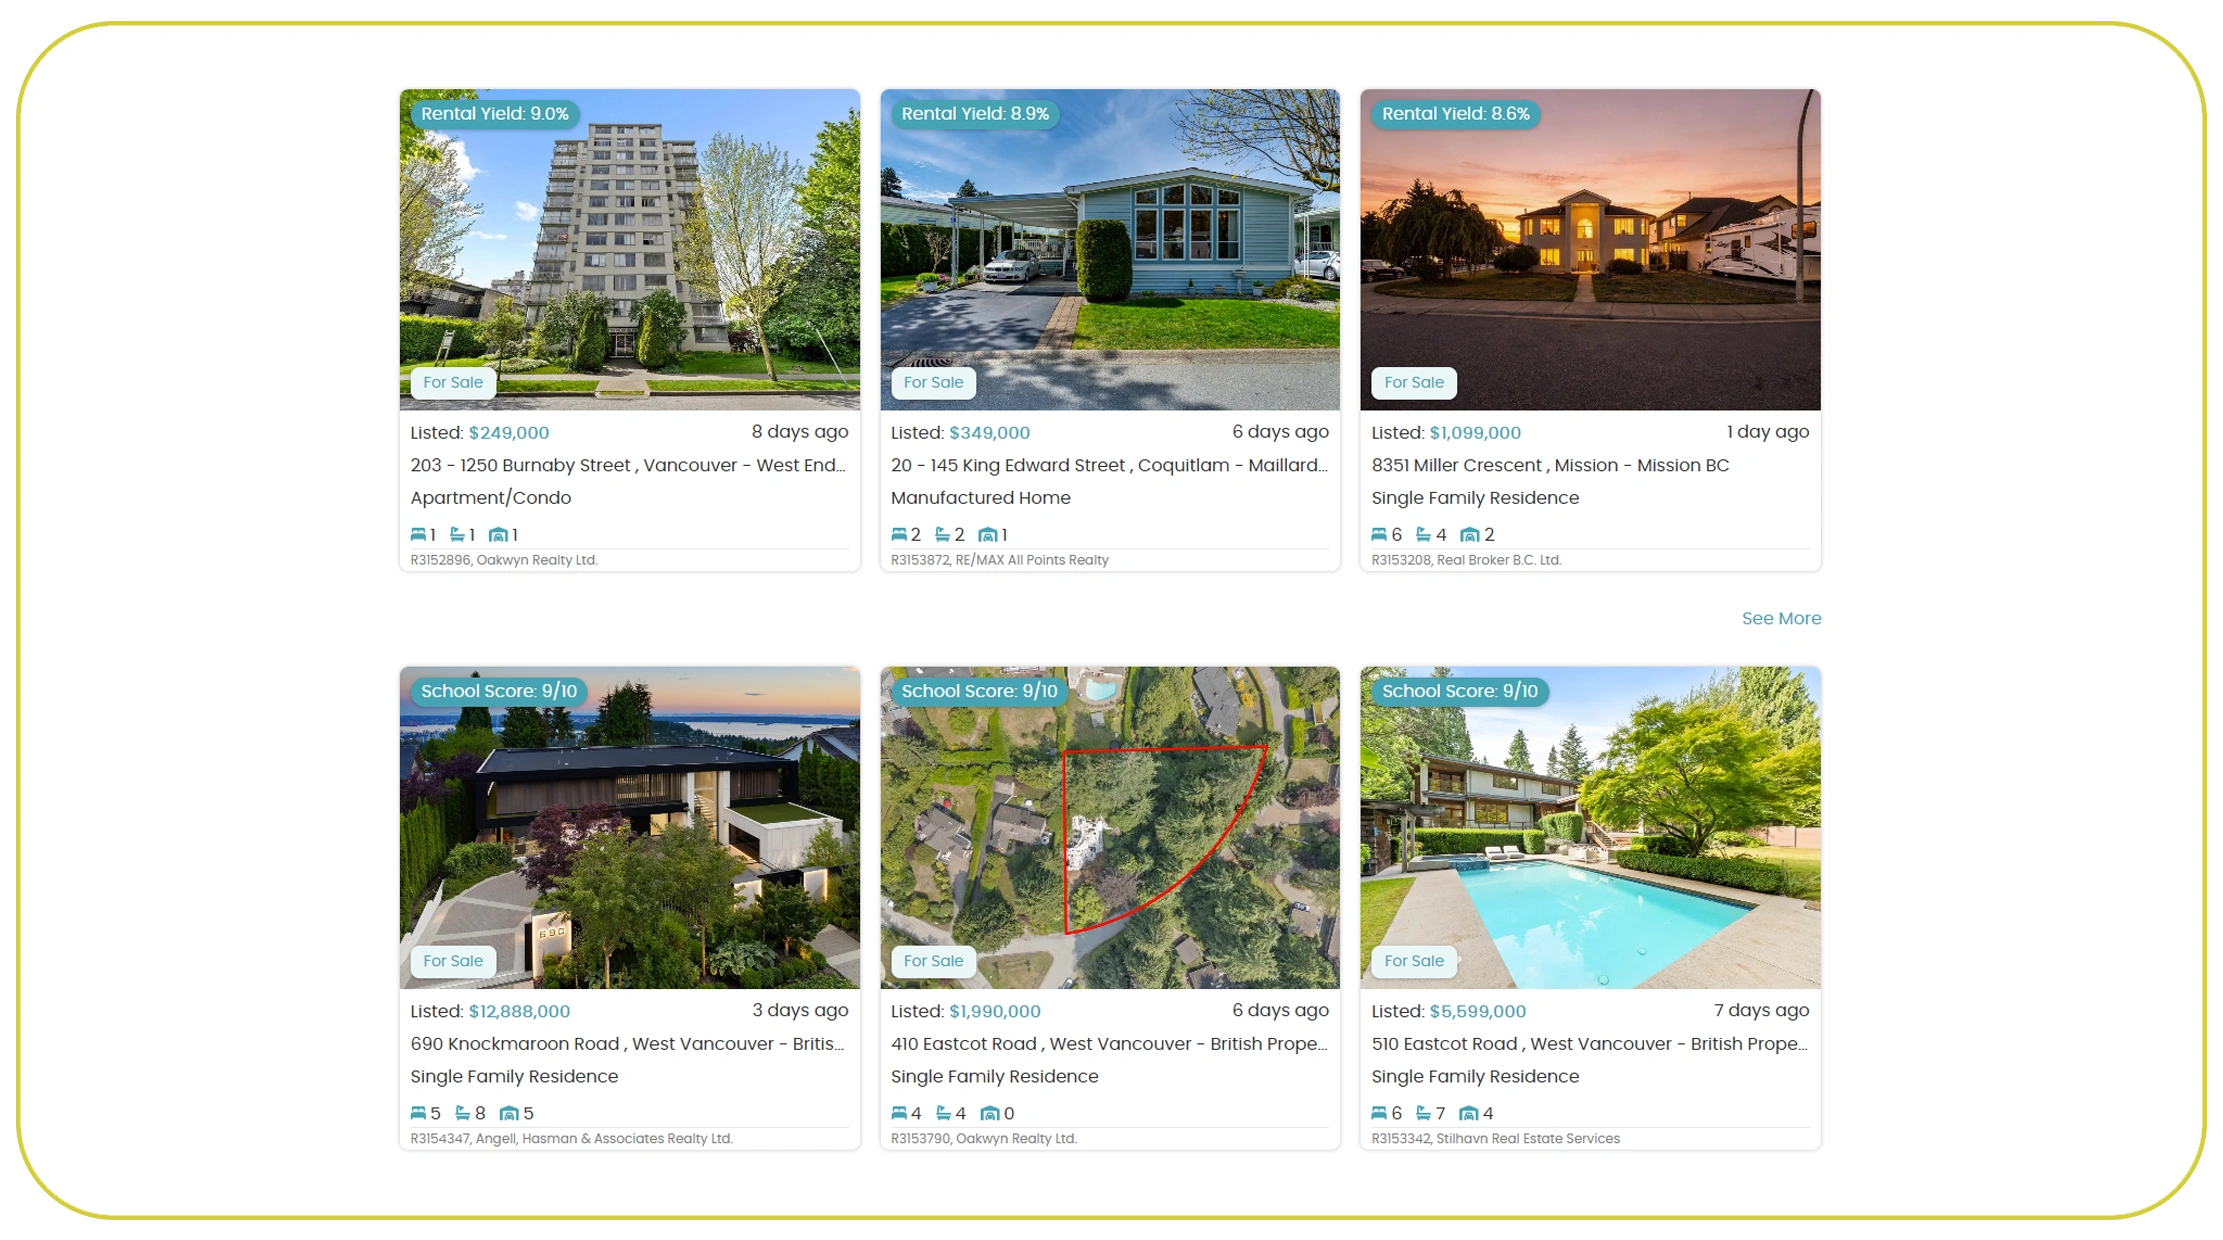
A comprehensive Real Estate Dataset , Scrape home prices using HouseSigma property data can serve as the foundation for historical analysis, valuation modeling, and market intelligence. Instead of evaluating individual properties in isolation, businesses can maintain a historical record of market activity and analyze how prices evolve over time.
A useful dataset should preserve historical observations rather than simply overwriting old values. This enables analysts to calculate price changes, identify repeated listings, monitor market duration, and compare historical transactions with current asking prices.
Historical data is particularly important because real estate markets are cyclical. A property priced at a certain level in 2021 cannot necessarily be evaluated using the same assumptions in 2022, 2023, or 2026. Interest rates, inventory, employment conditions, migration, local development, and buyer preferences can all affect pricing.
| Year | Dataset application | Example output |
|---|---|---|
| 2020 | Historical baseline | Neighborhood price index |
| 2021 | Growth analysis | Appreciation rate |
| 2022 | Correction analysis | Price decline |
| 2023 | Market comparison | Inventory-to-sales ratio |
| 2024 | Recovery monitoring | Median price trend |
| 2025 | Forecast preparation | Comparable sales |
| 2026 | Current valuation | Updated market estimate |
The dataset can also support machine-learning workflows. Features such as location, property type, bedrooms, bathrooms, floor area, historical price, listing duration, and nearby comparable transactions can be transformed into model variables.
Research on automated Toronto property valuation has demonstrated the value of combining spatial and temporal housing information for predicting property prices.
For businesses, the objective is not merely collecting more records. The objective is creating a consistent, validated, time-aware dataset that can support better pricing decisions.
Scaling Data Collection for Faster Real Estate Analysis
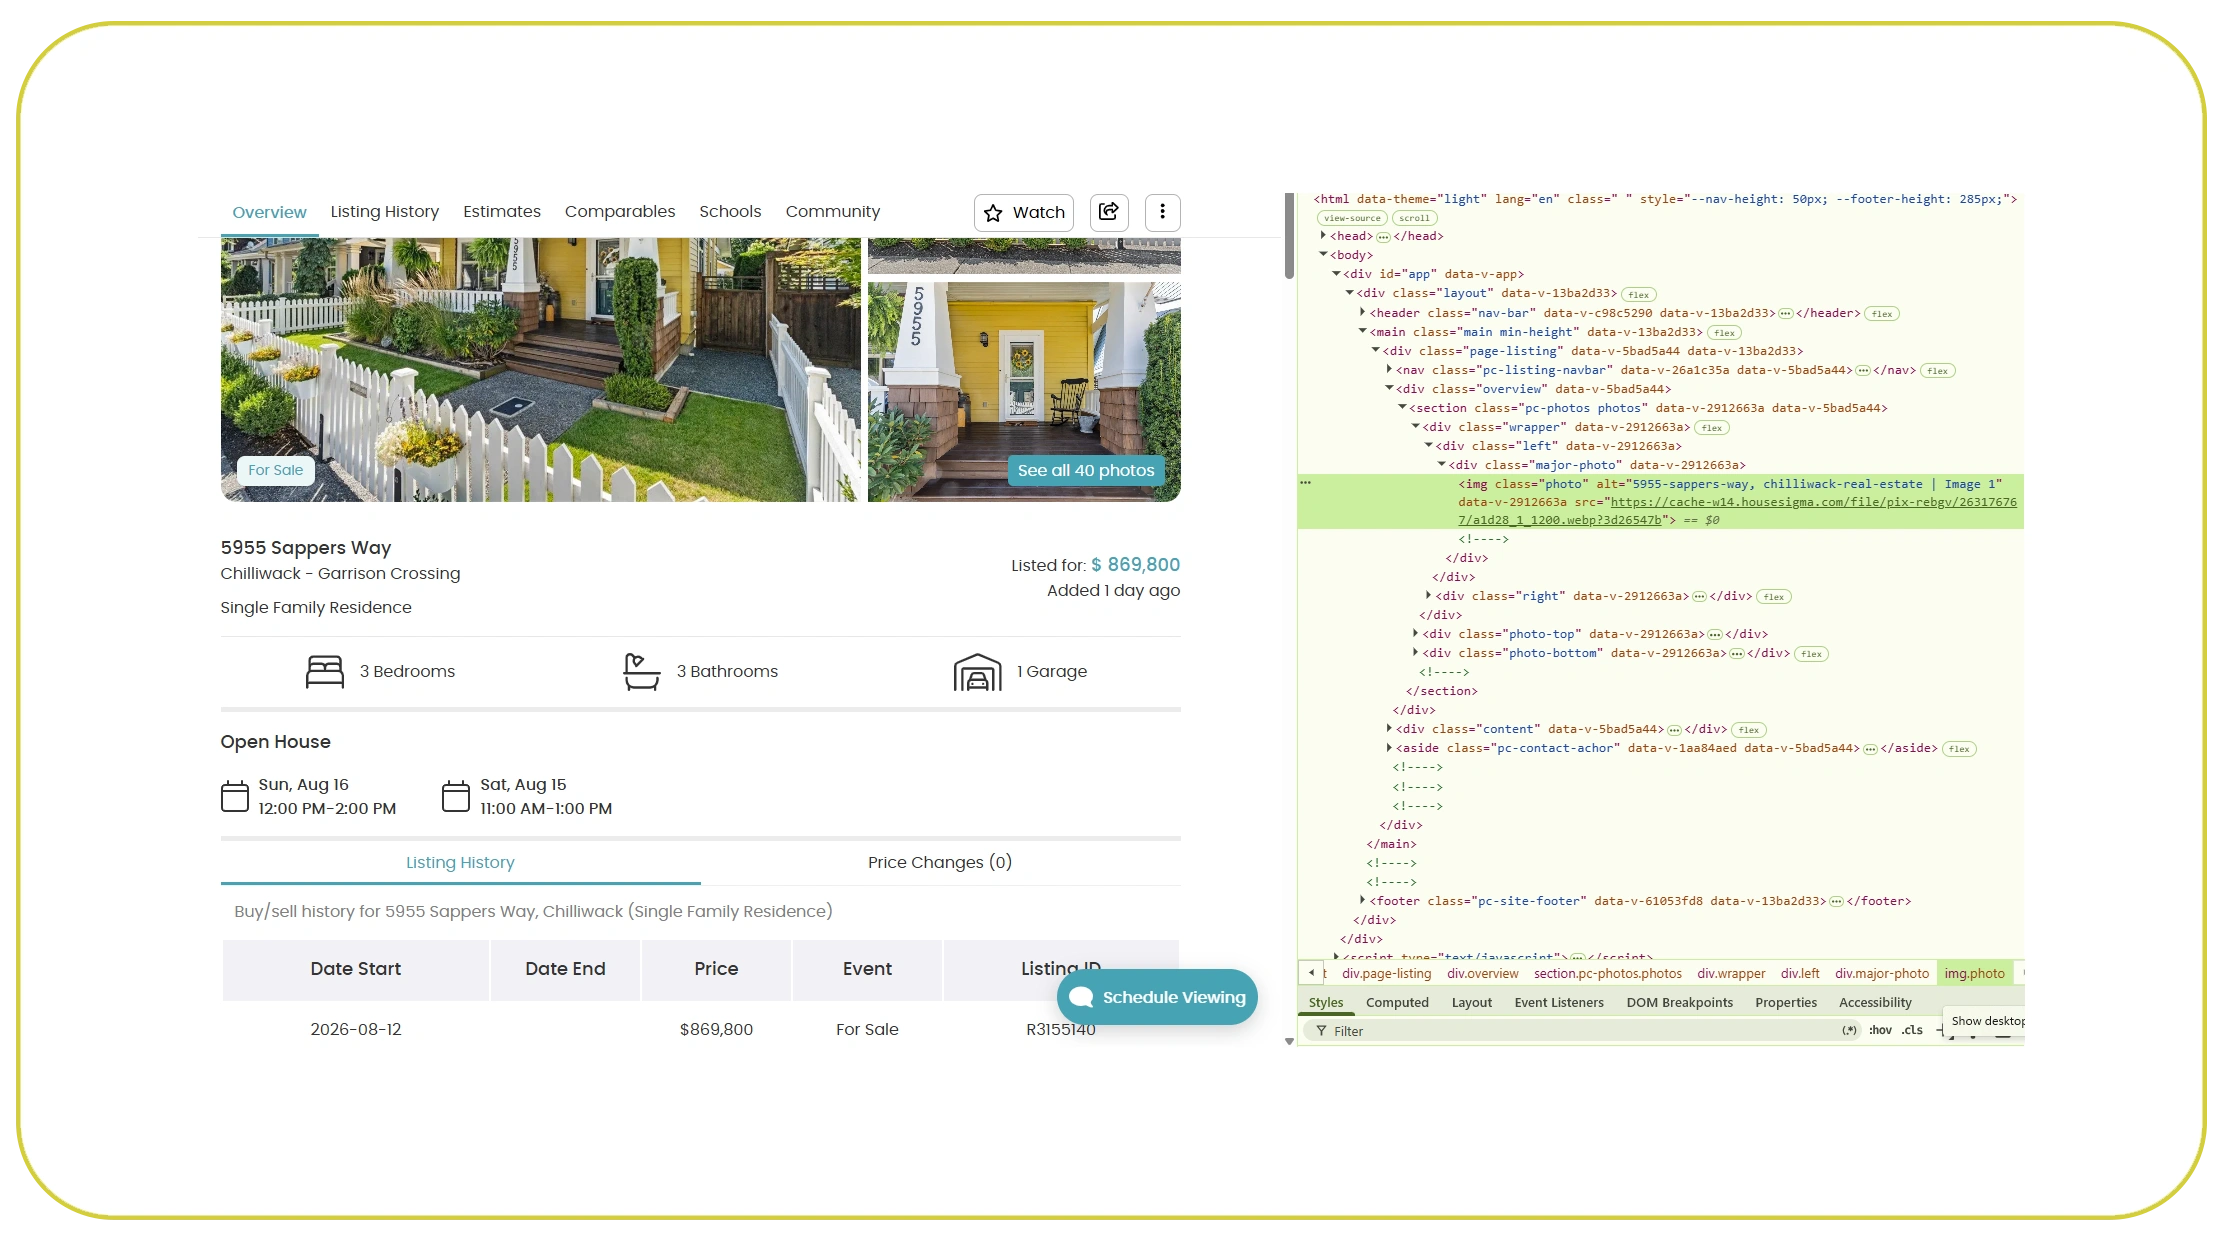
A Web Scraping Real Estate Data API can help organizations move from manual property research to automated data pipelines. Instead of repeatedly visiting individual listings and copying information into spreadsheets, businesses can structure collection, transformation, validation, and storage into a repeatable workflow.
An API-based approach can support scheduled data collection, allowing businesses to refresh datasets at predefined intervals. The frequency can depend on the use case. A valuation dashboard may require frequent updates, while a long-term housing research project may only require daily or weekly collection.
Data quality is equally important. Real estate listings can change status, prices can be modified, and properties can appear multiple times. Therefore, a production workflow should include duplicate detection, field normalization, timestamping, validation, and historical versioning.
| Year | Data challenge | Recommended capability |
|---|---|---|
| 2020 | Rapid market changes | Frequent collection |
| 2021 | High transaction activity | Scalable extraction |
| 2022 | Volatile pricing | Historical tracking |
| 2023 | Inventory changes | Status monitoring |
| 2024 | Market normalization | Data standardization |
| 2025 | Economic uncertainty | Automated refreshes |
| 2026 | Mixed regional trends | Real-time intelligence |
API-based infrastructure can also make the data easier to integrate with business systems. Structured records can flow into databases, spreadsheets, business intelligence dashboards, analytics platforms, or machine-learning pipelines.
For example, a property investment company could collect listing information, calculate price-per-square-foot metrics, compare current prices with historical medians, and flag properties that fall below a defined market benchmark.
The result is a more efficient research process. Analysts spend less time collecting repetitive information and more time interpreting market signals, evaluating opportunities, and developing pricing strategies.
Turning Property Information Into Practical Business Solutions

Real Estate Scraping API Use Cases extend beyond simple property-price monitoring. Once structured property information is available, businesses can use it for valuation, investment analysis, competitive research, market forecasting, lead generation, portfolio monitoring, and real estate research.
One major use case is automated valuation. A business can compare a target property against recently sold homes with similar characteristics and generate a valuation range. Another is competitive pricing, where agencies monitor comparable active listings and identify properties that appear overpriced or underpriced relative to local benchmarks.
Investment teams can also use historical property records to discover neighborhoods with changing prices, inventory, or transaction activity. Developers may analyze property-level data to understand market positioning before launching new projects.
| Use case | Data requirement | Business outcome |
|---|---|---|
| Property valuation | Sold prices and attributes | Better estimates |
| Competitive analysis | Active listings | Pricing insights |
| Investment research | Historical transactions | Opportunity discovery |
| Market forecasting | Time-series records | Trend identification |
| Portfolio monitoring | Property and market data | Risk visibility |
| Lead generation | Listing activity | Prospect identification |
| Neighborhood analysis | Location-level records | Local intelligence |
The June 2026 Canadian market illustrates why these use cases matter. National inventory stood at 4.8 months, while CREA reported that the MLS HPI was down 3.6% year over year. At the same time, sales were increasing month over month.
Such conditions make simple price averages insufficient. Businesses need multiple signals to understand whether a market is strengthening, weakening, or stabilizing.
By combining property characteristics, historical pricing, listing activity, and location information, automated data pipelines can transform raw property records into actionable market intelligence. The key is to use the information responsibly, validate extracted records, and comply with applicable terms, permissions, and privacy requirements.
Why Choose Real Data API?
Scrape home prices using HouseSigma property data with a structured data strategy designed around scalability, consistency, and analysis. Real Data API can help businesses streamline the movement from raw web information to organized datasets that are easier to analyze and integrate into existing workflows.
A real estate data workflow should support consistent field structures, historical tracking, scalable collection, data validation, and delivery in formats suitable for analytics. This is especially valuable for businesses monitoring large numbers of properties or multiple geographic markets.
The Canadian market continues to demonstrate why timely intelligence is valuable. In June 2026, national home sales increased another 0.5% month over month after a 5.5% increase in May, while national inventory remained at 4.8 months.
Real Data API can support workflows involving:
- Automated property-data collection
- Structured listing and pricing datasets
- Historical market analysis
- Comparable-property research
- Price-change monitoring
- Property investment research
- Real estate market dashboards
- Data integration with analytics systems
Instead of depending entirely on manual research, businesses can build repeatable data pipelines that support ongoing property intelligence.
Conclusion
Property valuation becomes more challenging when markets move quickly and neighborhood-level conditions differ from national averages. A reliable property-data workflow can help businesses overcome these challenges by combining historical transactions, active listings, property characteristics, location information, and pricing signals.
Organizations can Scrape home prices using HouseSigma property data to create structured datasets for comparable-property analysis, pricing intelligence, investment research, market monitoring, and automated valuation workflows. The value comes not simply from collecting listings but from transforming property information into consistent, historical, and analysis-ready records.
The latest Canadian data reinforces the importance of granular market intelligence. CREA reported that national sales continued to improve through June 2026, while prices were showing signs of stabilization after earlier weakness. At the same time, regional markets continued to behave differently, demonstrating why broad averages should be supplemented with local property-level analysis.
Build smarter real estate intelligence with Real Data API and turn property data into actionable pricing, valuation, and market insights!
Latest posts

How to Track Global Anime Viewing Trends via Crunchyroll Data Scraping for Smarter Audience Insights?

How to Scrape streaming content trends using HBO Max data for Smarter Content Strategy?

Traveloka Data Scraping For Travel Price Intelligence - How To Monitor Price Changes, Discounts, And Travel Demand
How Bolt Food Data Scraping for Food Delivery Market Trends Helps Businesses Overcome Delivery Market Intelligence Challenges?






.png)



