Introduction
OTT businesses can improve content decisions by collecting structured catalog, ranking, rating, genre, language, and availability data from ZEE5 and analyzing it at scale. Scrape ZEE5 API data for OTT content performance can help teams identify popular titles, compare content trends, monitor catalog changes, and build stronger programming and competitive strategies.
For OTT platforms, media companies, advertisers, researchers, and content strategists, manual tracking creates a major data gap. Titles change. Rankings move. New releases appear. Content availability can vary by language, genre, and region. A structured data pipeline turns these changes into usable business intelligence.
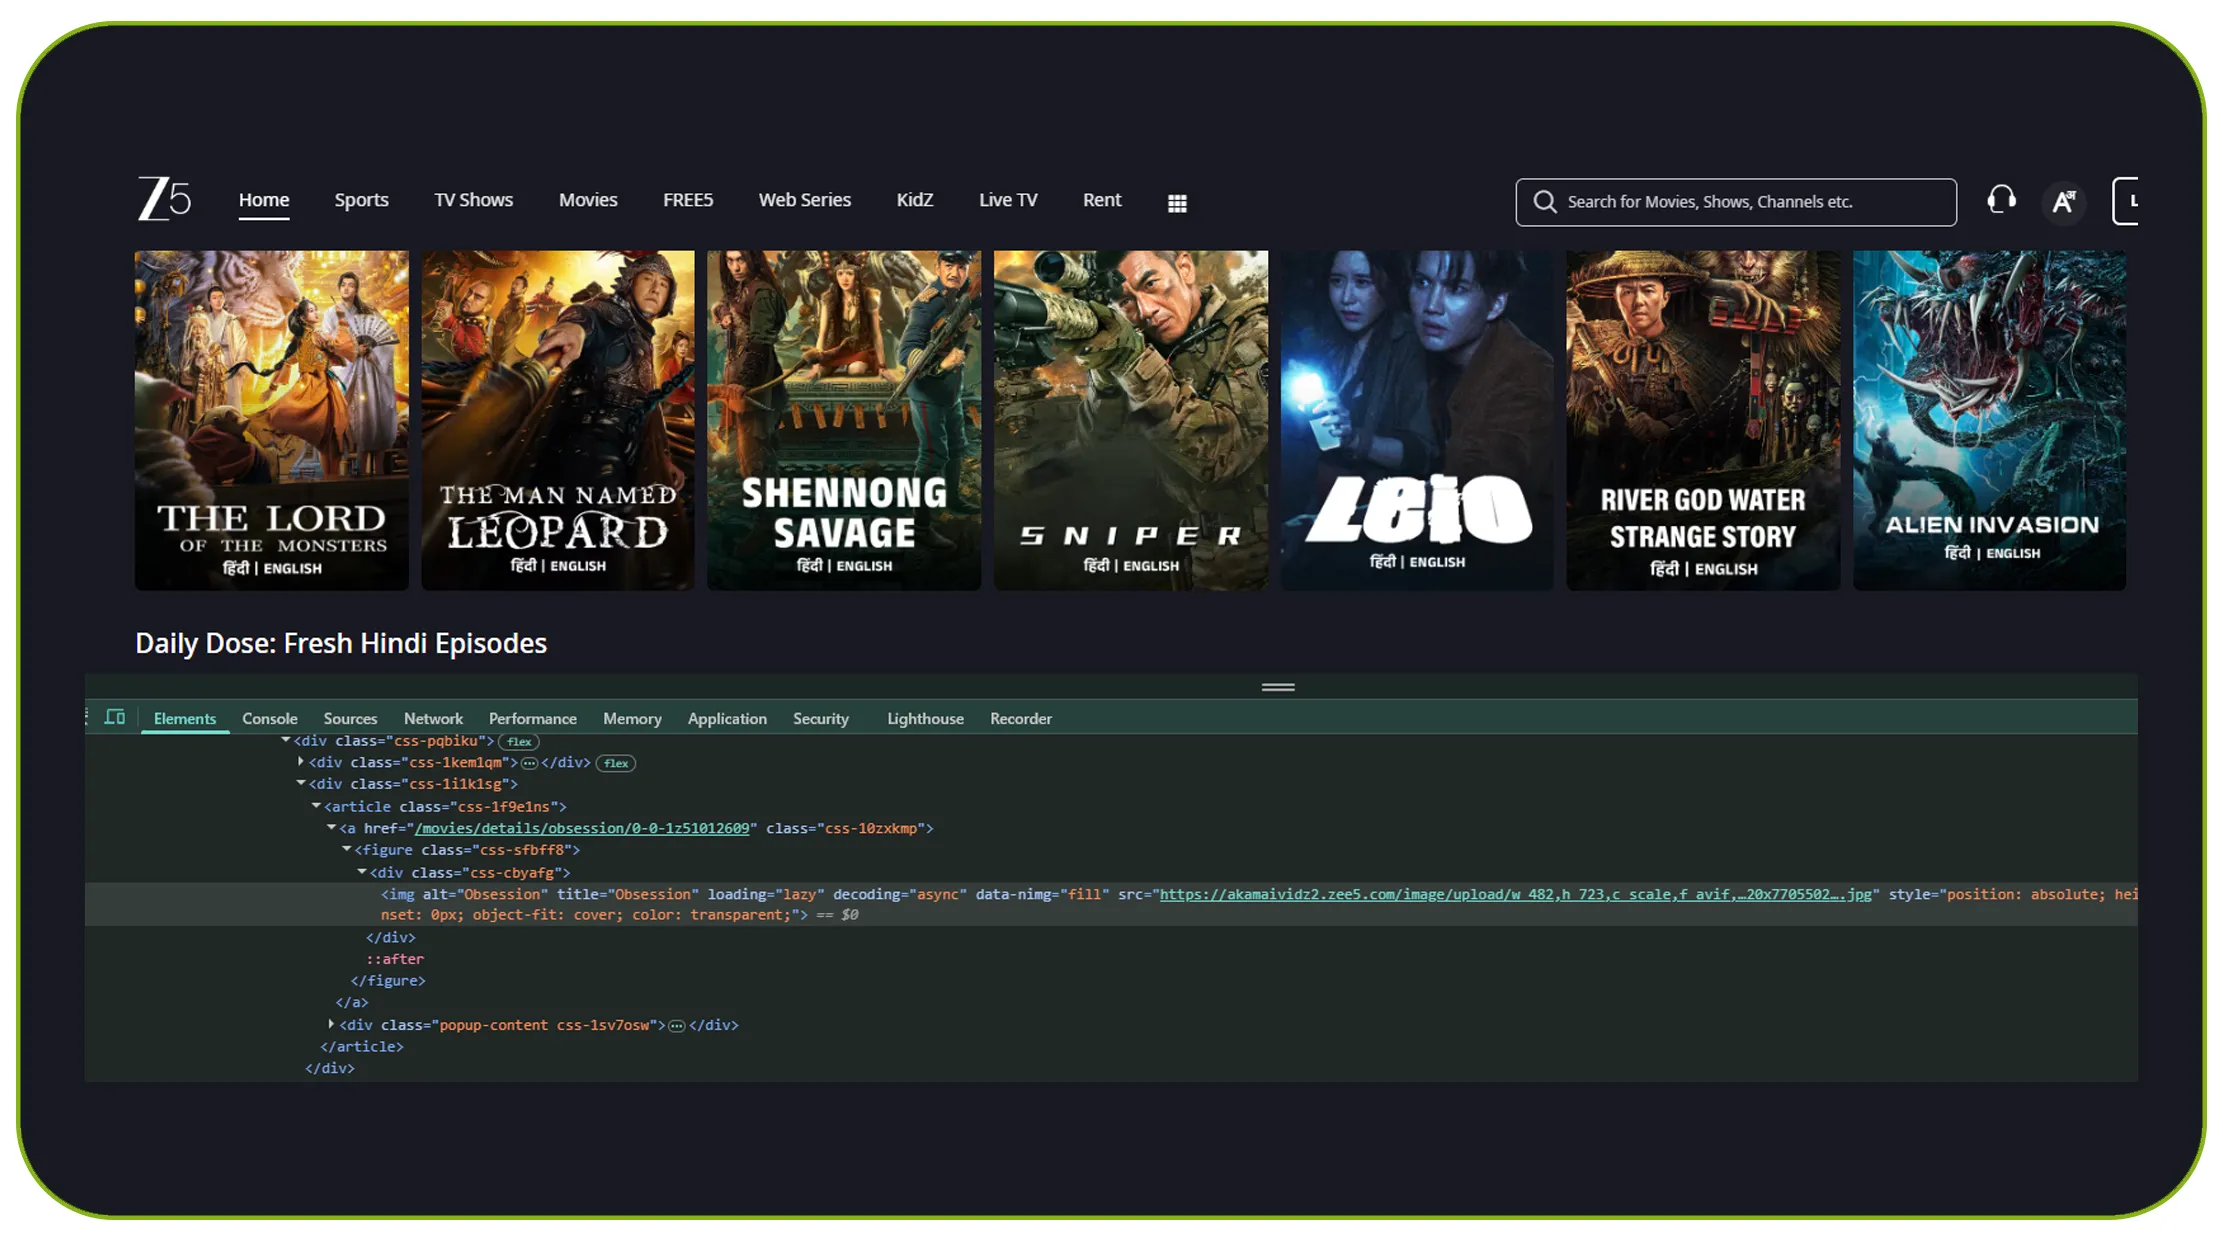
A Web Scraping ZEE5 Dataset can bring multiple content attributes into one structured format. Typical fields can include title, genre, language, release information, ratings, ranking position, content type, description, availability, and other publicly visible metadata.
The figures below use hypothetical industry benchmarks to demonstrate how an OTT analytics program can evolve from 2020 through 2026. Actual results depend on source availability, collection frequency, geography, and the fields captured.
| Year | Illustrative OTT catalog records monitored | Illustrative data refresh frequency | Main analytical focus |
|---|---|---|---|
| 2020 | 50K | Monthly | Catalog discovery |
| 2021 | 75K | Monthly | Genre and language trends |
| 2022 | 110K | Weekly | Ratings and rankings |
| 2023 | 160K | Weekly | Competitive benchmarking |
| 2024 | 220K | Daily | Content performance |
| 2025 | 300K | Daily | Trend detection |
| 2026 | 400K+ | Near real time | Automated OTT intelligence |
These numbers are illustrative benchmarks, not claims about ZEE5's actual catalog size. The core objective is simple: convert changing OTT catalog information into structured data that analysts can compare over time.
How can OTT catalog data reveal new market opportunities?
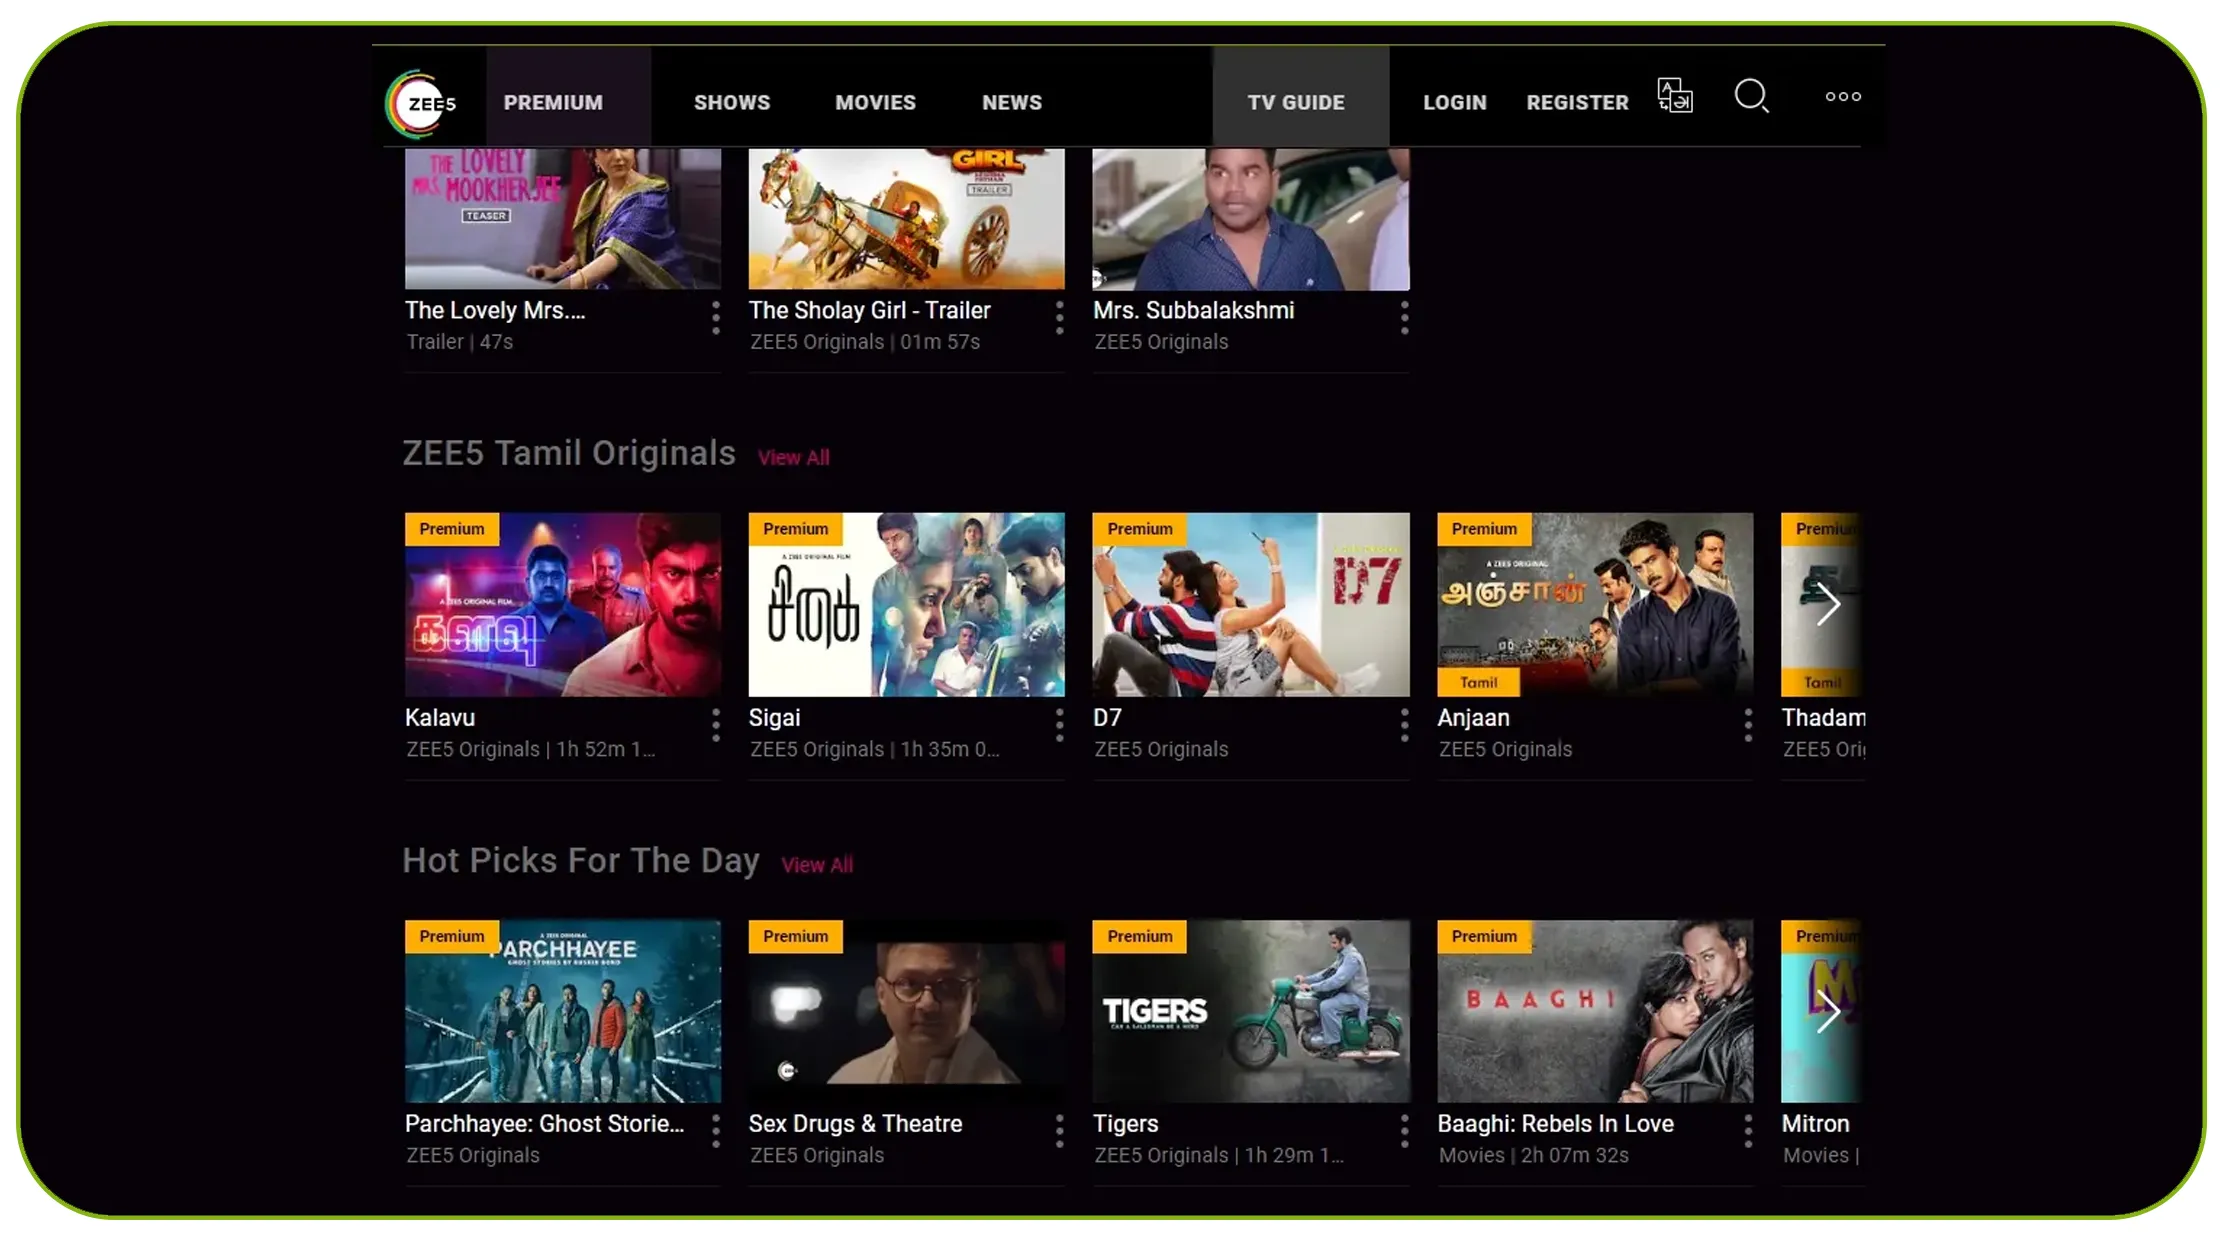
OTT catalog data intelligence using ZEE5 data can help businesses understand what content exists, how it is categorized, and how the catalog changes over time.
A large OTT catalog contains more information than title names. It can reveal patterns across genres, languages, release years, content formats, ratings, and audience-facing metadata. Analysts can use these attributes to create content inventories and identify gaps in a target market.
For example, a streaming analyst may compare the number of titles across drama, comedy, thriller, romance, action, documentary, and regional categories. The analyst can then compare those categories with ranking or rating signals.
A structured workflow can follow these steps:
- Collect publicly available catalog information.
- Normalize title and category fields.
- Remove duplicate records.
- Standardize genres and languages.
- Track new and removed titles.
- Store historical snapshots.
- Compare performance indicators over time.
- Build dashboards for decision-makers.
Historical snapshots are especially valuable. A single catalog snapshot shows what exists today. A time-series dataset shows how the catalog changes.
| Period | Example records tracked | Example business question |
|---|---|---|
| 2020 | 50,000 | Which categories dominated the catalog? |
| 2021 | 75,000 | Which languages expanded? |
| 2022 | 110,000 | Which genres gained visibility? |
| 2023 | 160,000 | Which titles remained competitive? |
| 2024 | 220,000 | Which content categories grew fastest? |
| 2025 | 300,000 | Which trends became persistent? |
| 2026 | 400,000+ | Which signals require immediate action? |
The values are illustrative. The analytical framework remains useful because it gives teams a consistent method for measuring catalog evolution.
This approach can support content acquisition research, programming decisions, competitor benchmarking, market research, and advertising planning. It also reduces dependence on manual spreadsheets.
Why does a structured catalog make OTT research more reliable?
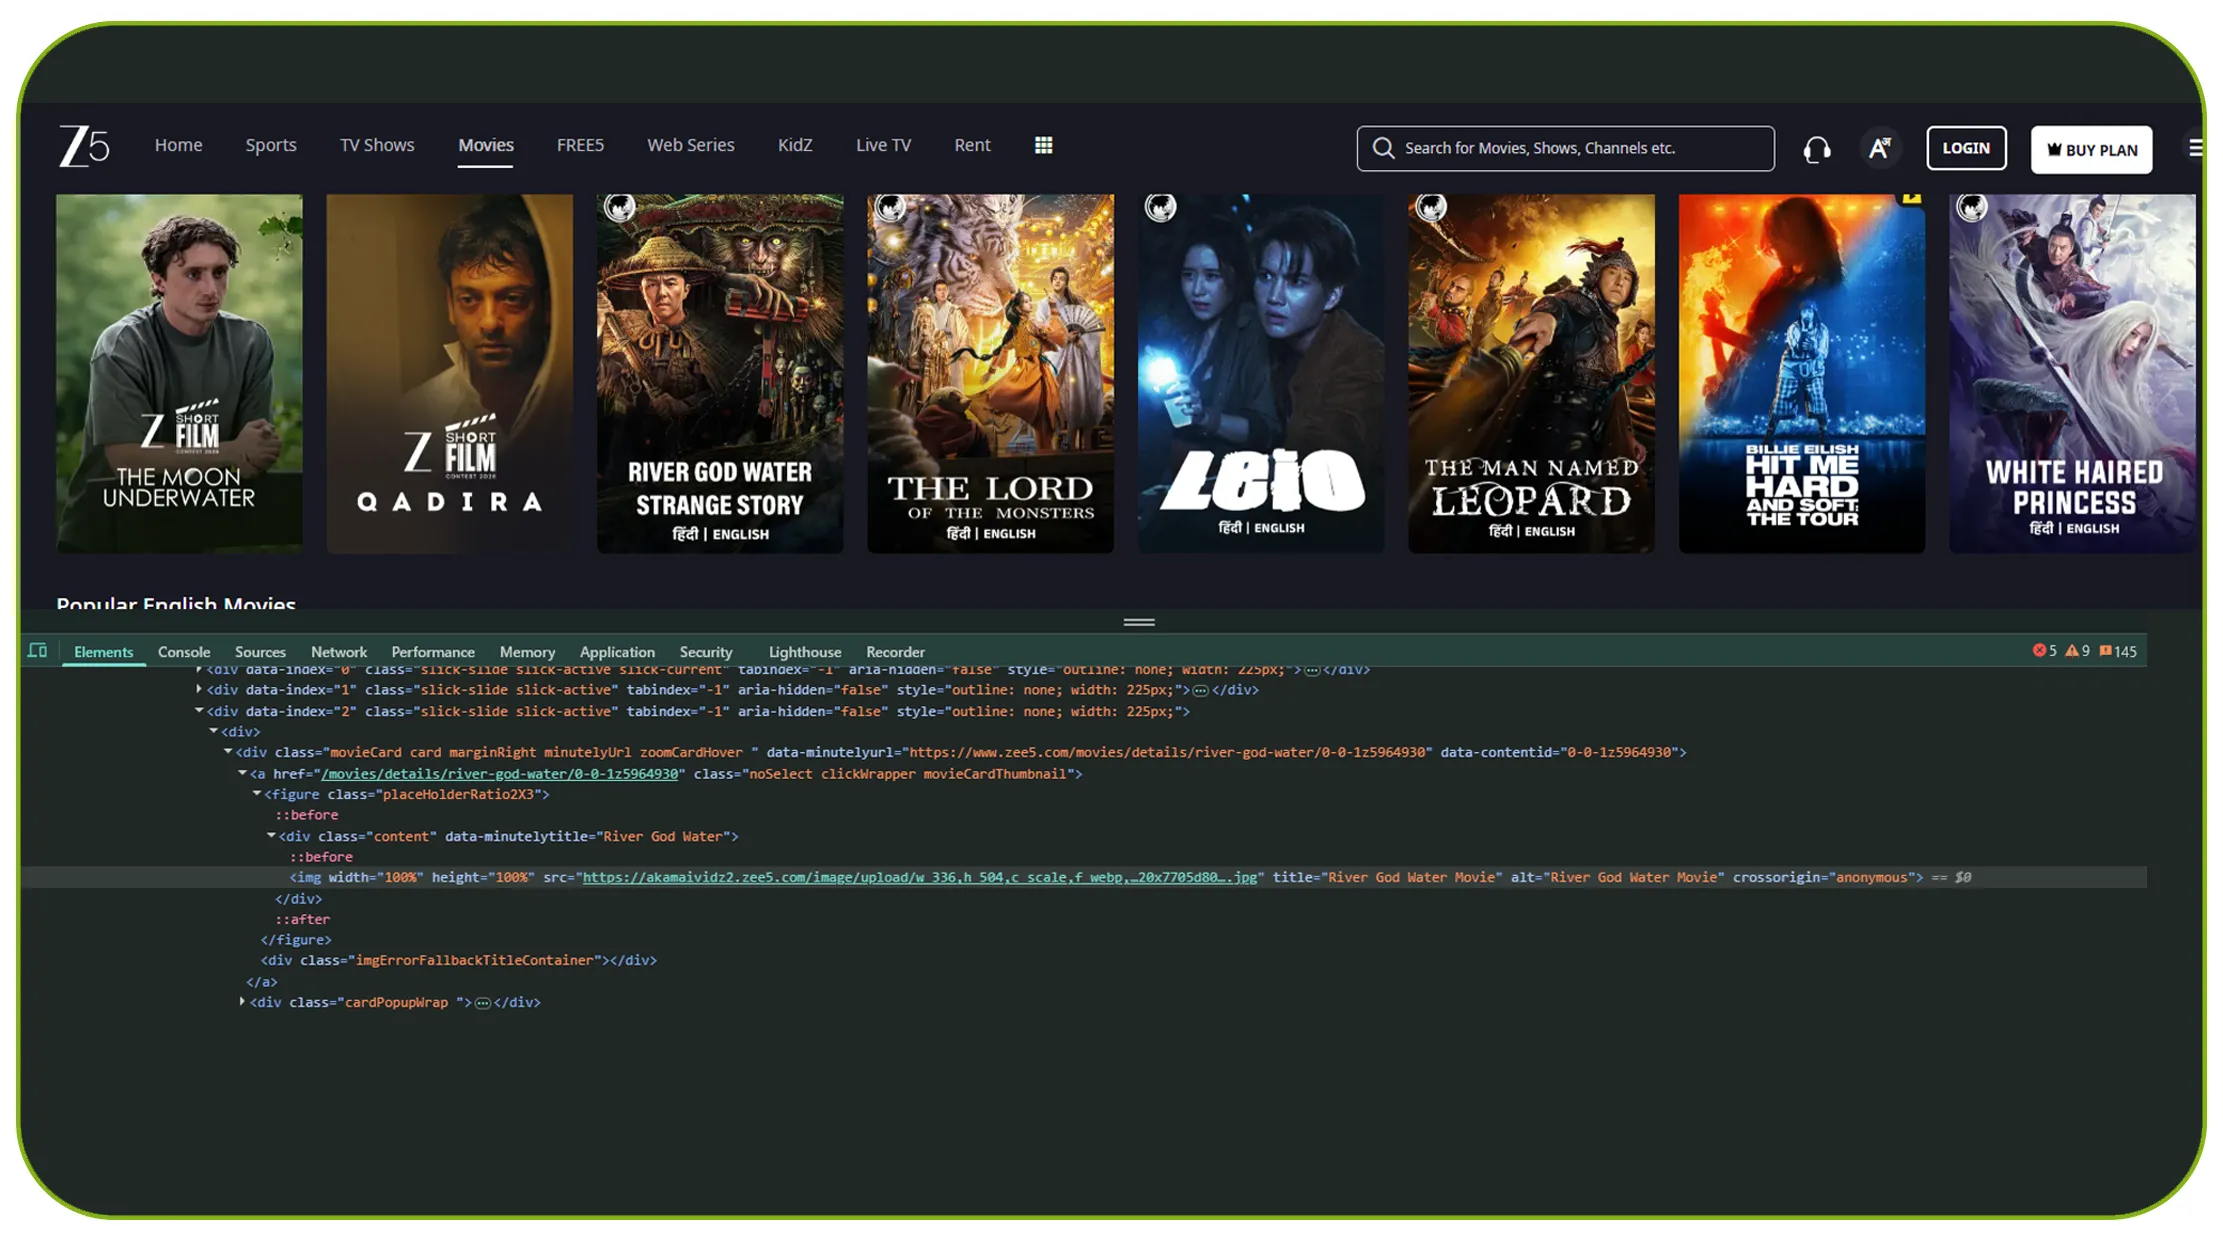
OTT catalog intelligence using ZEE5 data scraper can turn scattered content observations into a repeatable research process.
Manual OTT research often creates inconsistent results. One analyst may record a title as a thriller while another uses drama-thriller. One spreadsheet may store a rating as text. Another may store it as a number. These small differences make large-scale comparisons difficult.
A scraper-based workflow can standardize fields before they enter an analytics system. Businesses can define consistent schemas for titles, genres, languages, ratings, rankings, release dates, content types, and availability.
The process can also create historical records. Suppose a title ranks at position 20 on Monday and position 8 on Friday. A single snapshot cannot explain that movement. Historical collection can reveal the change.
| Year | Illustrative refresh cycle | Primary benefit |
|---|---|---|
| 2020 | Monthly | Basic catalog research |
| 2021 | Monthly | Historical comparison |
| 2022 | Weekly | Ranking movement |
| 2023 | Weekly | Competitive monitoring |
| 2024 | Daily | Faster trend detection |
| 2025 | Daily | Automated dashboards |
| 2026 | Near real time | Rapid content intelligence |
Again, these are illustrative benchmarks.
A structured dataset also supports automated quality checks. Teams can flag missing titles, duplicate records, unexpected field changes, or abnormal ranking movements.
This matters for businesses that need repeatable intelligence instead of one-time research. The goal is not simply to collect more records. The goal is to create reliable data that analysts can use repeatedly.
For example, a media company can combine catalog information with its own internal viewing data. An agency can compare content categories with advertising performance. A researcher can study long-term OTT trends. A content team can identify categories with growing visibility.
The result is a stronger decision-making foundation.
How can popularity analysis identify high-performing content?
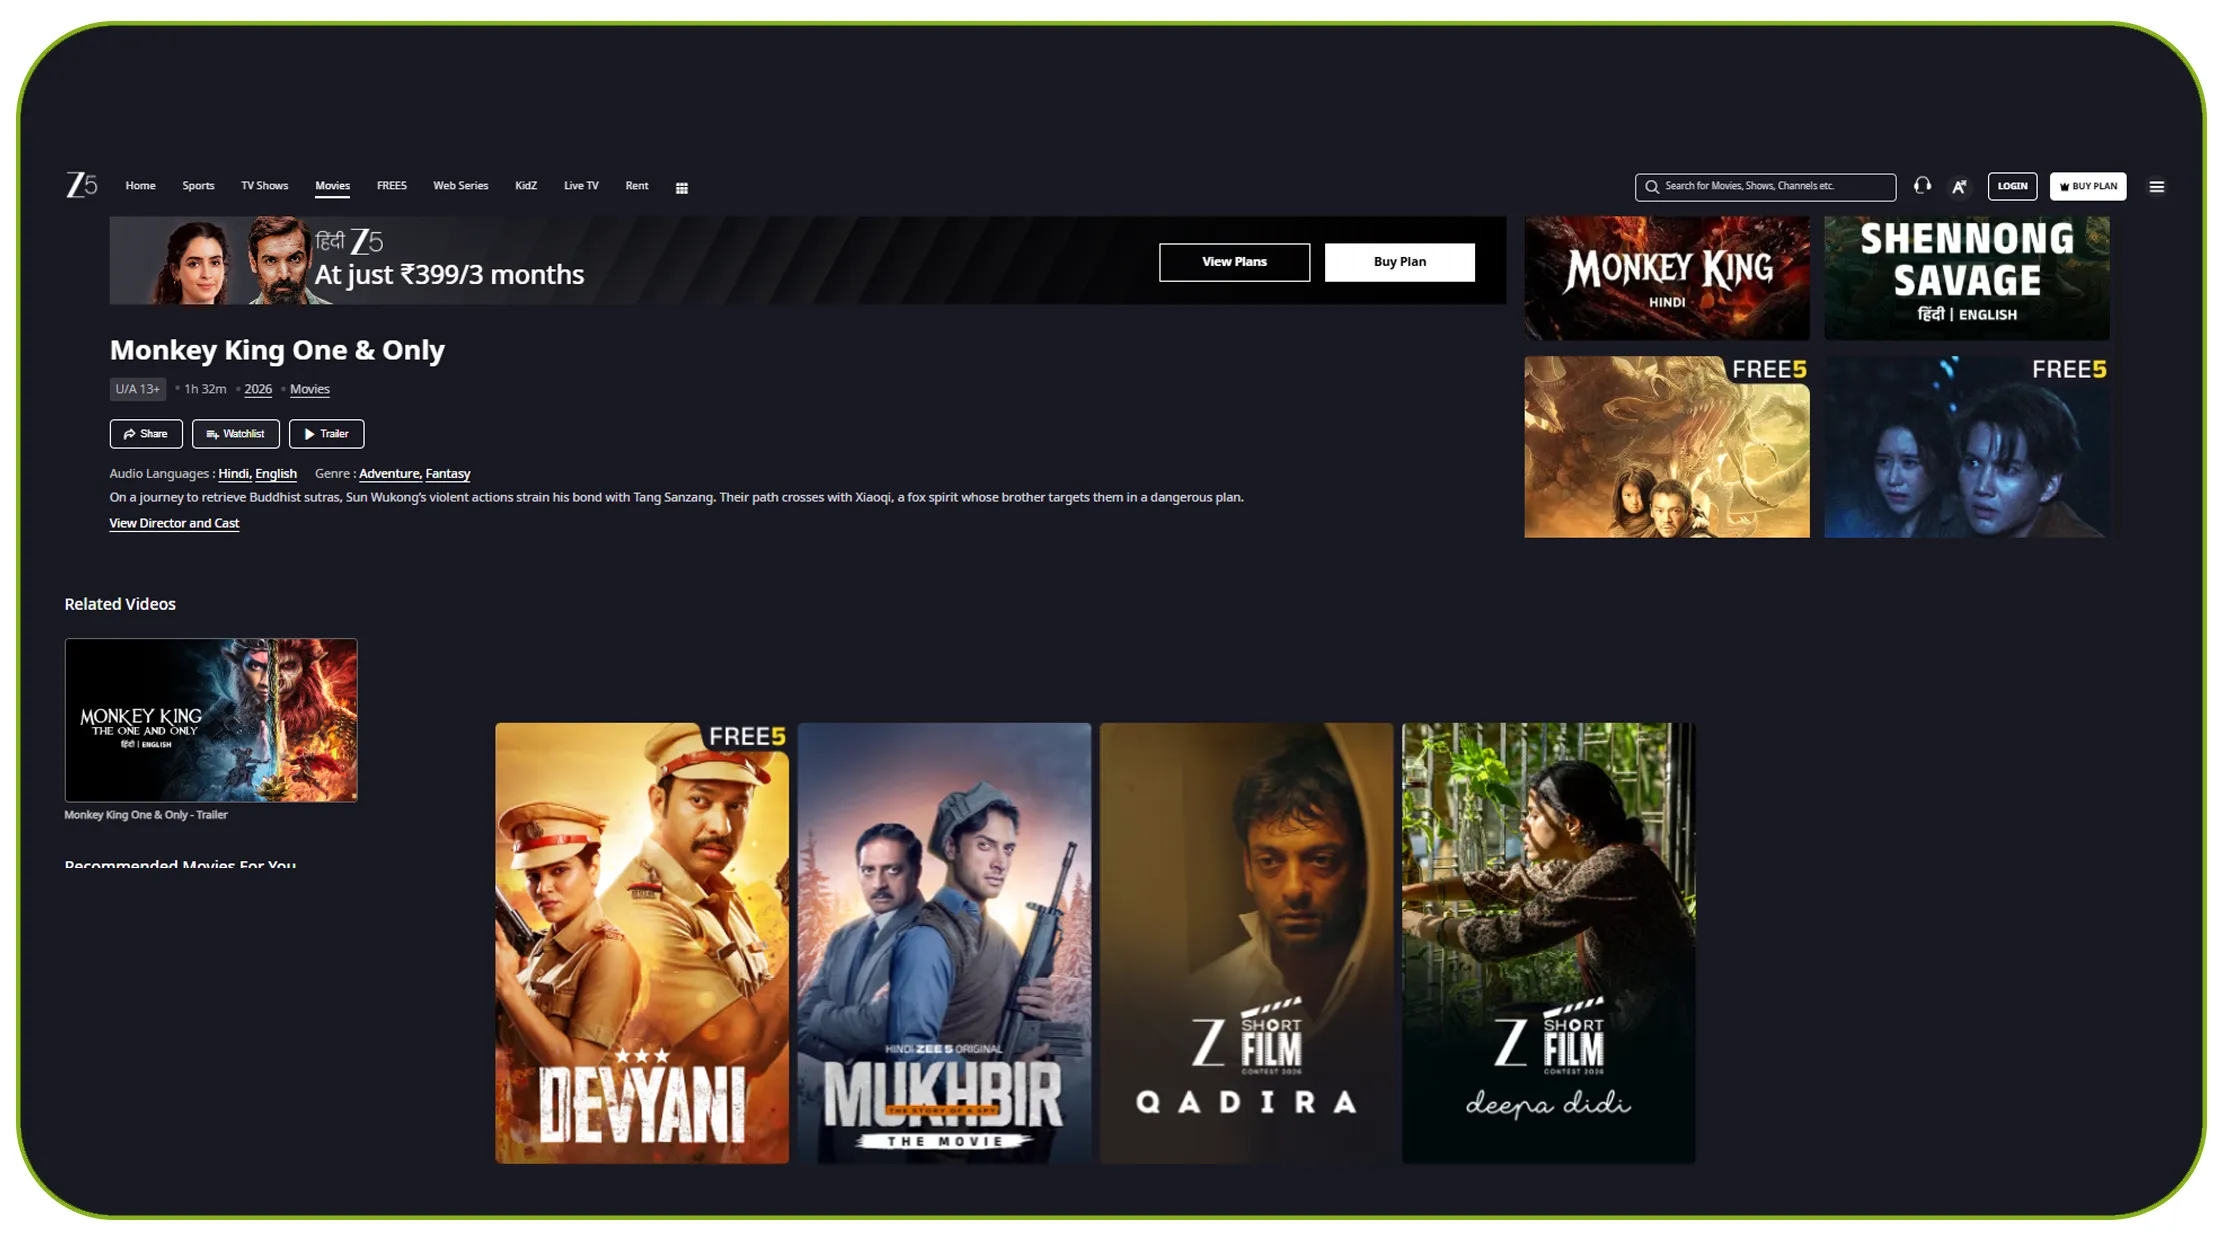
Content popularity analysis using OTT data scraping helps analysts study which titles and content categories attract stronger visibility signals.
Popularity should not rely on one metric. A useful model can combine ranking position, ratings, review volume where available, content category, language, release timing, and changes over time.
For example, a title that moves from ranking 50 to ranking 10 within several days may deserve attention. Another title that stays near the top for several weeks shows a different performance pattern.
A simple monitoring model can classify titles into categories such as:
- Fast-rising content
- Consistently high-ranking content
- Newly launched content
- Long-tail content
- Declining content
- Genre-specific performers
- Regional-language performers
| Year | Illustrative titles analyzed | Example popularity indicators |
|---|---|---|
| 2020 | 10K | Ratings and catalog position |
| 2021 | 18K | Ratings and genre |
| 2022 | 30K | Ranking movement |
| 2023 | 50K | Ranking and release timing |
| 2024 | 80K | Multi-factor scoring |
| 2025 | 120K | Automated trend detection |
| 2026 | 175K | Continuous performance monitoring |
These figures illustrate a scalable analytics model rather than actual ZEE5 measurements.
A popularity score can assign different weights to each available signal. For example, ranking movement could receive greater weight than a static rating because movement shows a change in audience-facing visibility.
Businesses can then build dashboards showing:
- Top-ranked titles.
- Fastest-rising titles.
- Popular genres.
- Popular languages.
- New releases gaining visibility.
- Titles with declining rankings.
- Long-term catalog performers.
This intelligence can support content acquisition, marketing campaigns, recommendation research, competitor analysis, and programming decisions.
The most important advantage is speed. When data refreshes automatically, analysts do not need to rebuild spreadsheets every time the catalog changes.
How can an API workflow improve OTT performance monitoring?
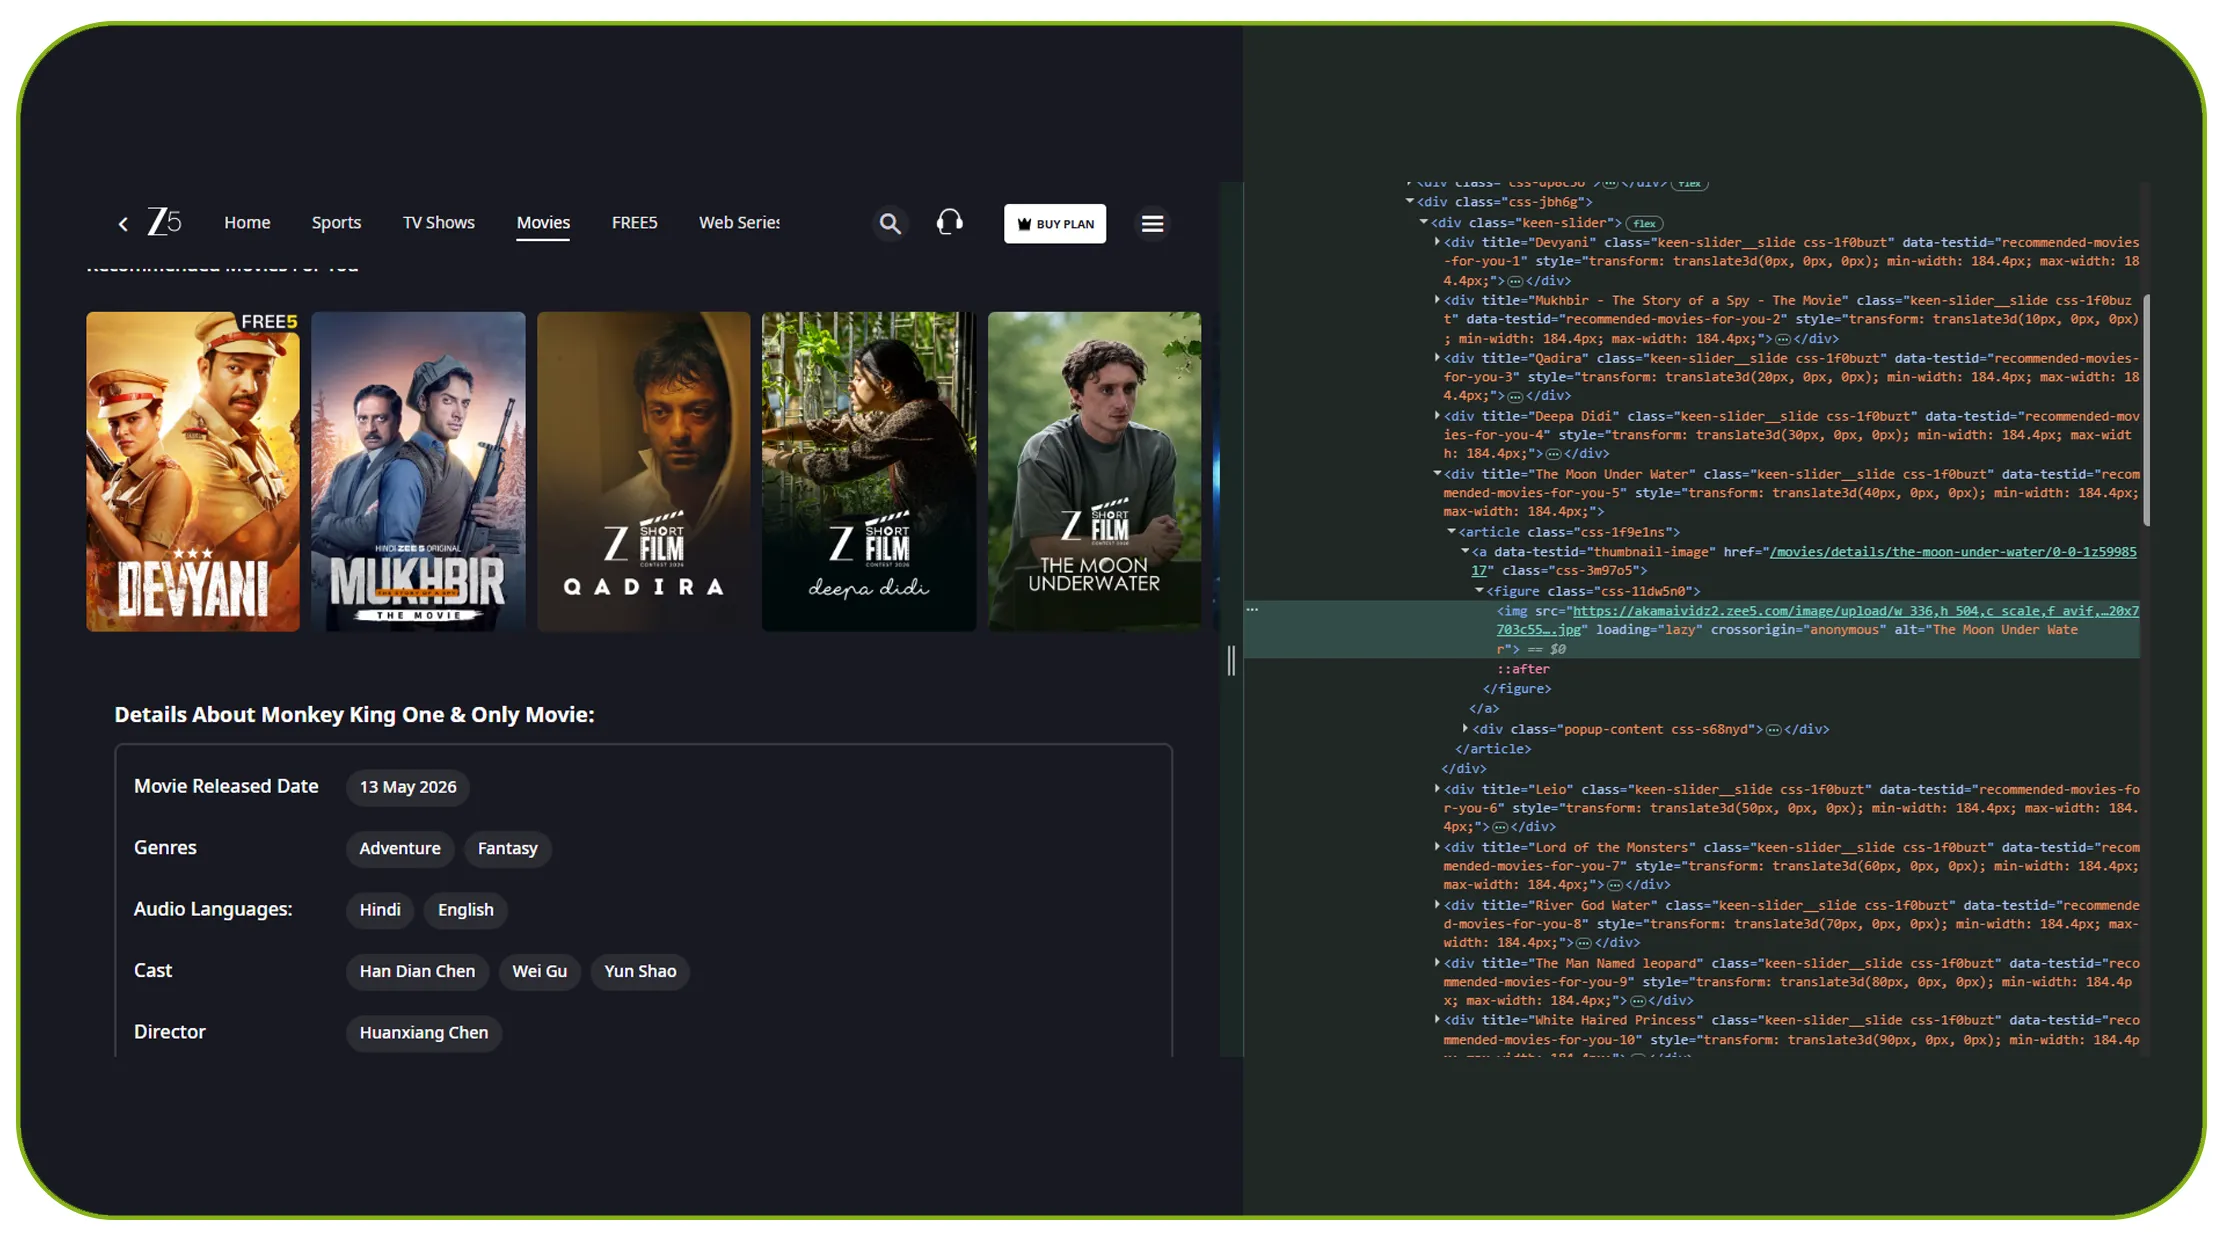
ZEE5 API workflows can provide a structured approach for collecting and processing relevant OTT information. Businesses that need repeatable monitoring can use Scrape ZEE5 API data for OTT content performance to build datasets for rankings, catalog analysis, metadata research, and content benchmarking.
An API-centered workflow can separate data collection from analysis. This makes the system easier to scale.
A typical architecture can include:
- Source layer: Collect available OTT information.
- Extraction layer: Capture relevant content fields.
- Normalization layer: Standardize formats and values.
- Storage layer: Save current and historical records.
- Analytics layer: Calculate rankings and trends.
- Dashboard layer: Present insights to business users.
The dataset can be refreshed according to business needs. A research company may need weekly updates. A competitive intelligence team may need daily updates. A trend-monitoring system may require much more frequent collection.
| Data layer | Example field | Business use |
|---|---|---|
| Content | Title | Catalog tracking |
| Classification | Genre | Category analysis |
| Localization | Language | Regional analysis |
| Performance | Rating | Audience signal |
| Visibility | Ranking | Popularity monitoring |
| Timing | Release date | Launch analysis |
| Availability | Status | Catalog change detection |
The important point is that an API-based data workflow should match the business objective. Collecting every available field may increase storage and processing costs without improving decision-making.
Teams should first define the questions they want to answer. They can then select the fields needed to answer those questions.
This approach makes OTT analytics more efficient. It also creates a foundation for integrating OTT data with internal viewing data, advertising data, social signals, or other market datasets.
What can a dedicated scraper do for OTT competitive research?
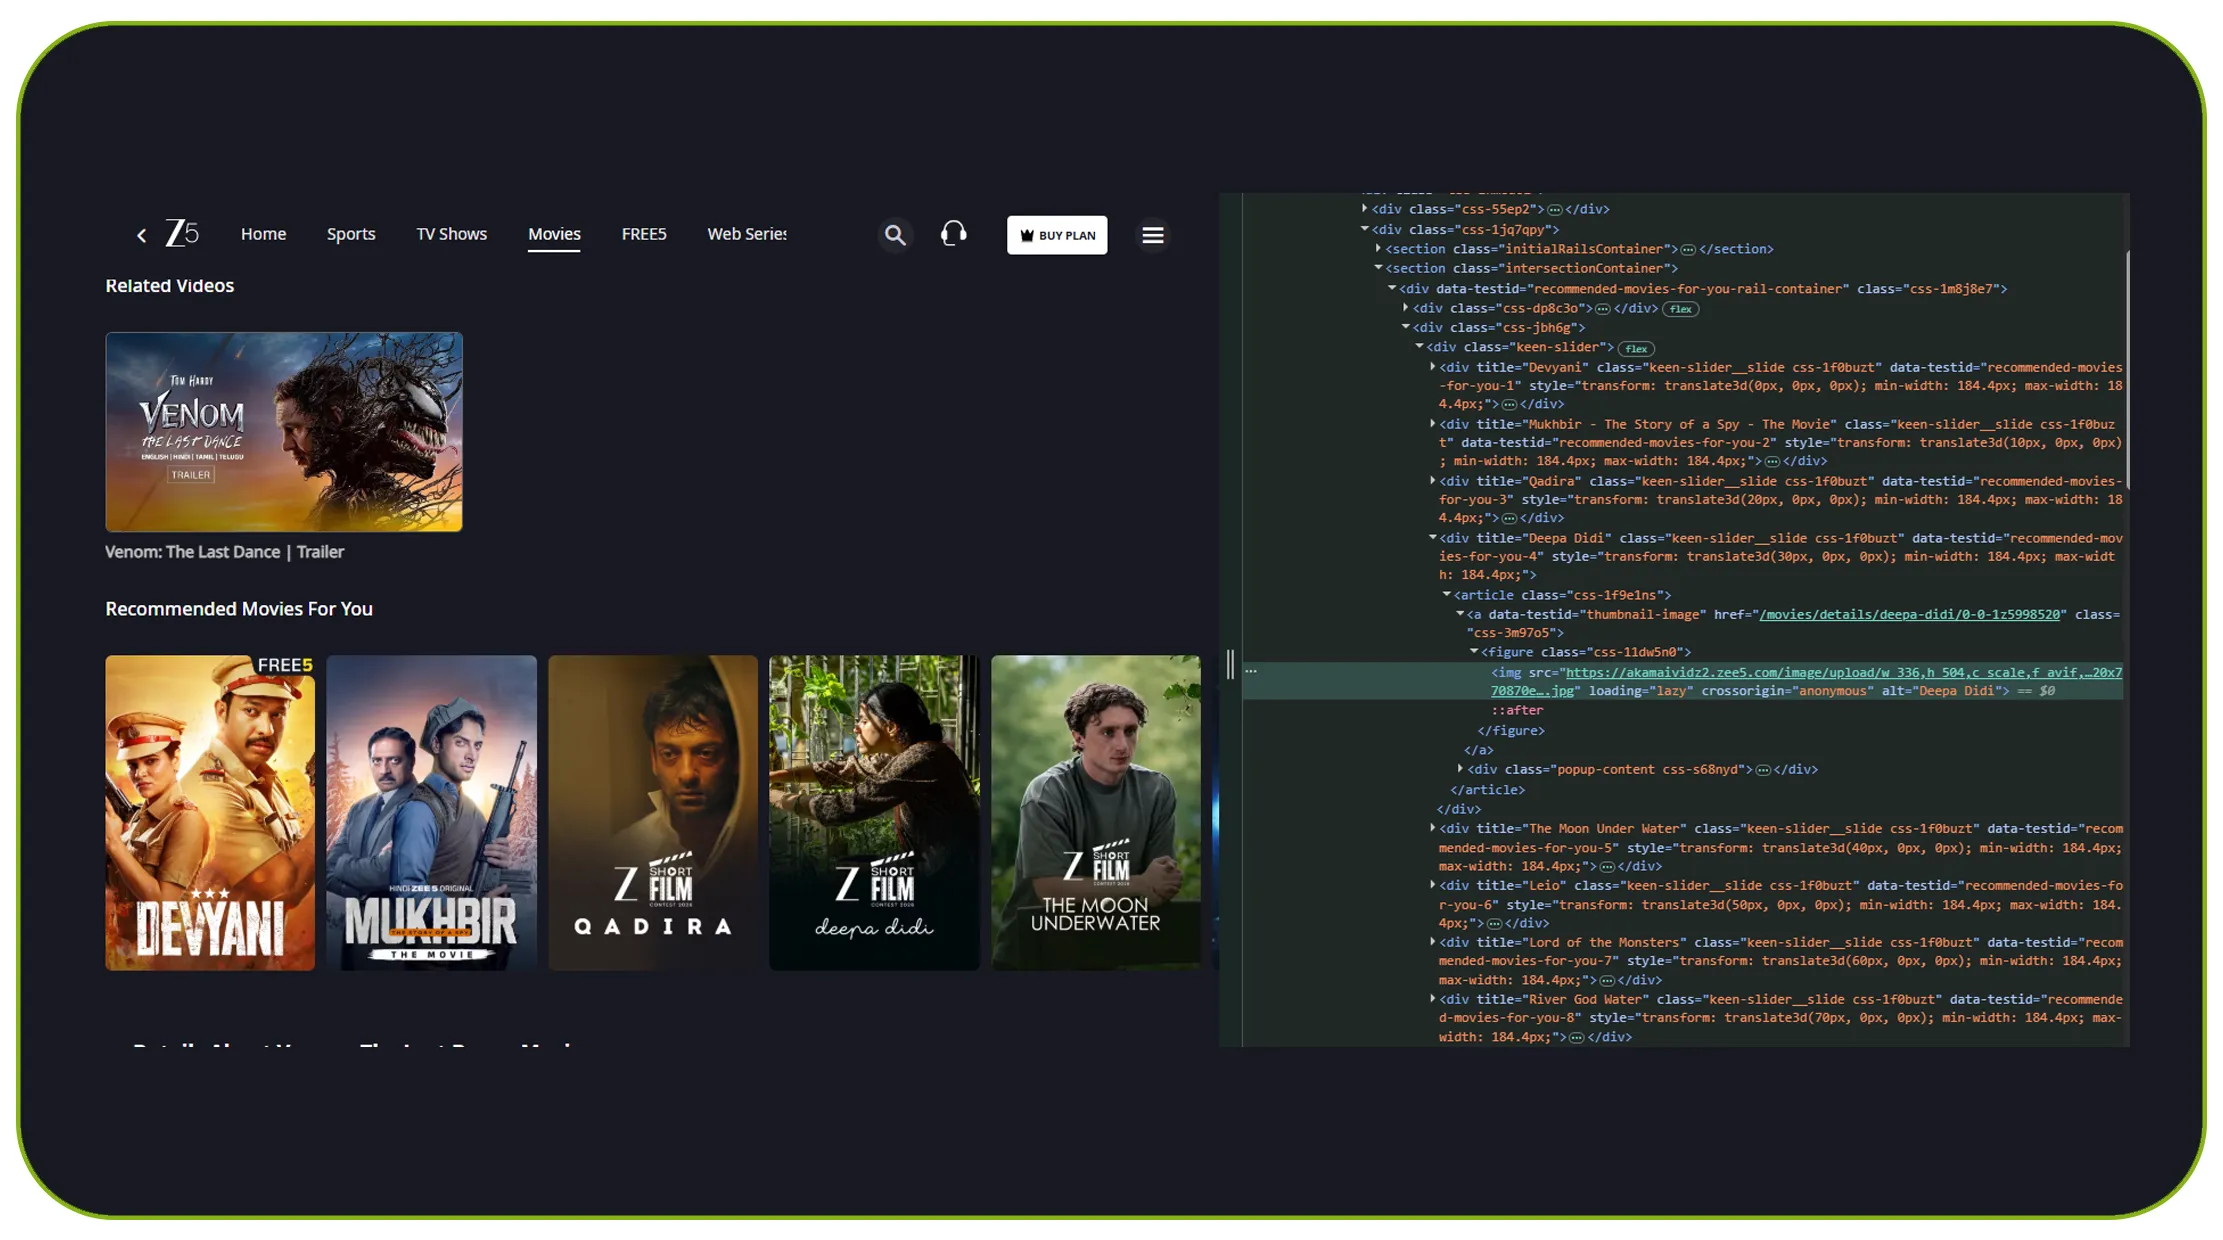
A ZEE5 Scraper can help automate repetitive catalog monitoring tasks and convert publicly available information into structured records for analysis.
The main benefit is consistency. Manual research depends on people checking pages, copying information, and updating spreadsheets. Automated collection can follow a defined schedule and schema.
A scraper can be designed to monitor changes such as:
- New titles.
- Removed titles.
- Ranking movements.
- Genre changes.
- Language distribution.
- Rating changes.
- Release information.
- Content availability.
- Metadata updates.
Consider a media intelligence company monitoring 10,000 titles. If an analyst spends only one minute reviewing each record, a complete manual review would require more than 166 hours. Automation can significantly reduce repetitive work, although validation and quality controls remain important.
| Year | Illustrative monitored titles | Potential operational model |
|---|---|---|
| 2020 | 10,000 | Manual + scheduled collection |
| 2021 | 20,000 | Automated catalog extraction |
| 2022 | 35,000 | Weekly monitoring |
| 2023 | 60,000 | Daily monitoring |
| 2024 | 90,000 | Automated alerts |
| 2025 | 130,000 | Dashboard integration |
| 2026 | 180,000+ | Continuous intelligence |
These are hypothetical scaling examples.
For better reliability, the workflow should include duplicate detection, schema validation, timestamping, historical storage, error handling, and monitoring.
Scraping should also respect applicable terms, access controls, copyright requirements, and legal obligations. Businesses should collect only information they are permitted to access and use.
When implemented responsibly, automated collection can give analysts more time to focus on interpretation instead of repetitive data gathering.
How can an OTT data API support large-scale analytics?
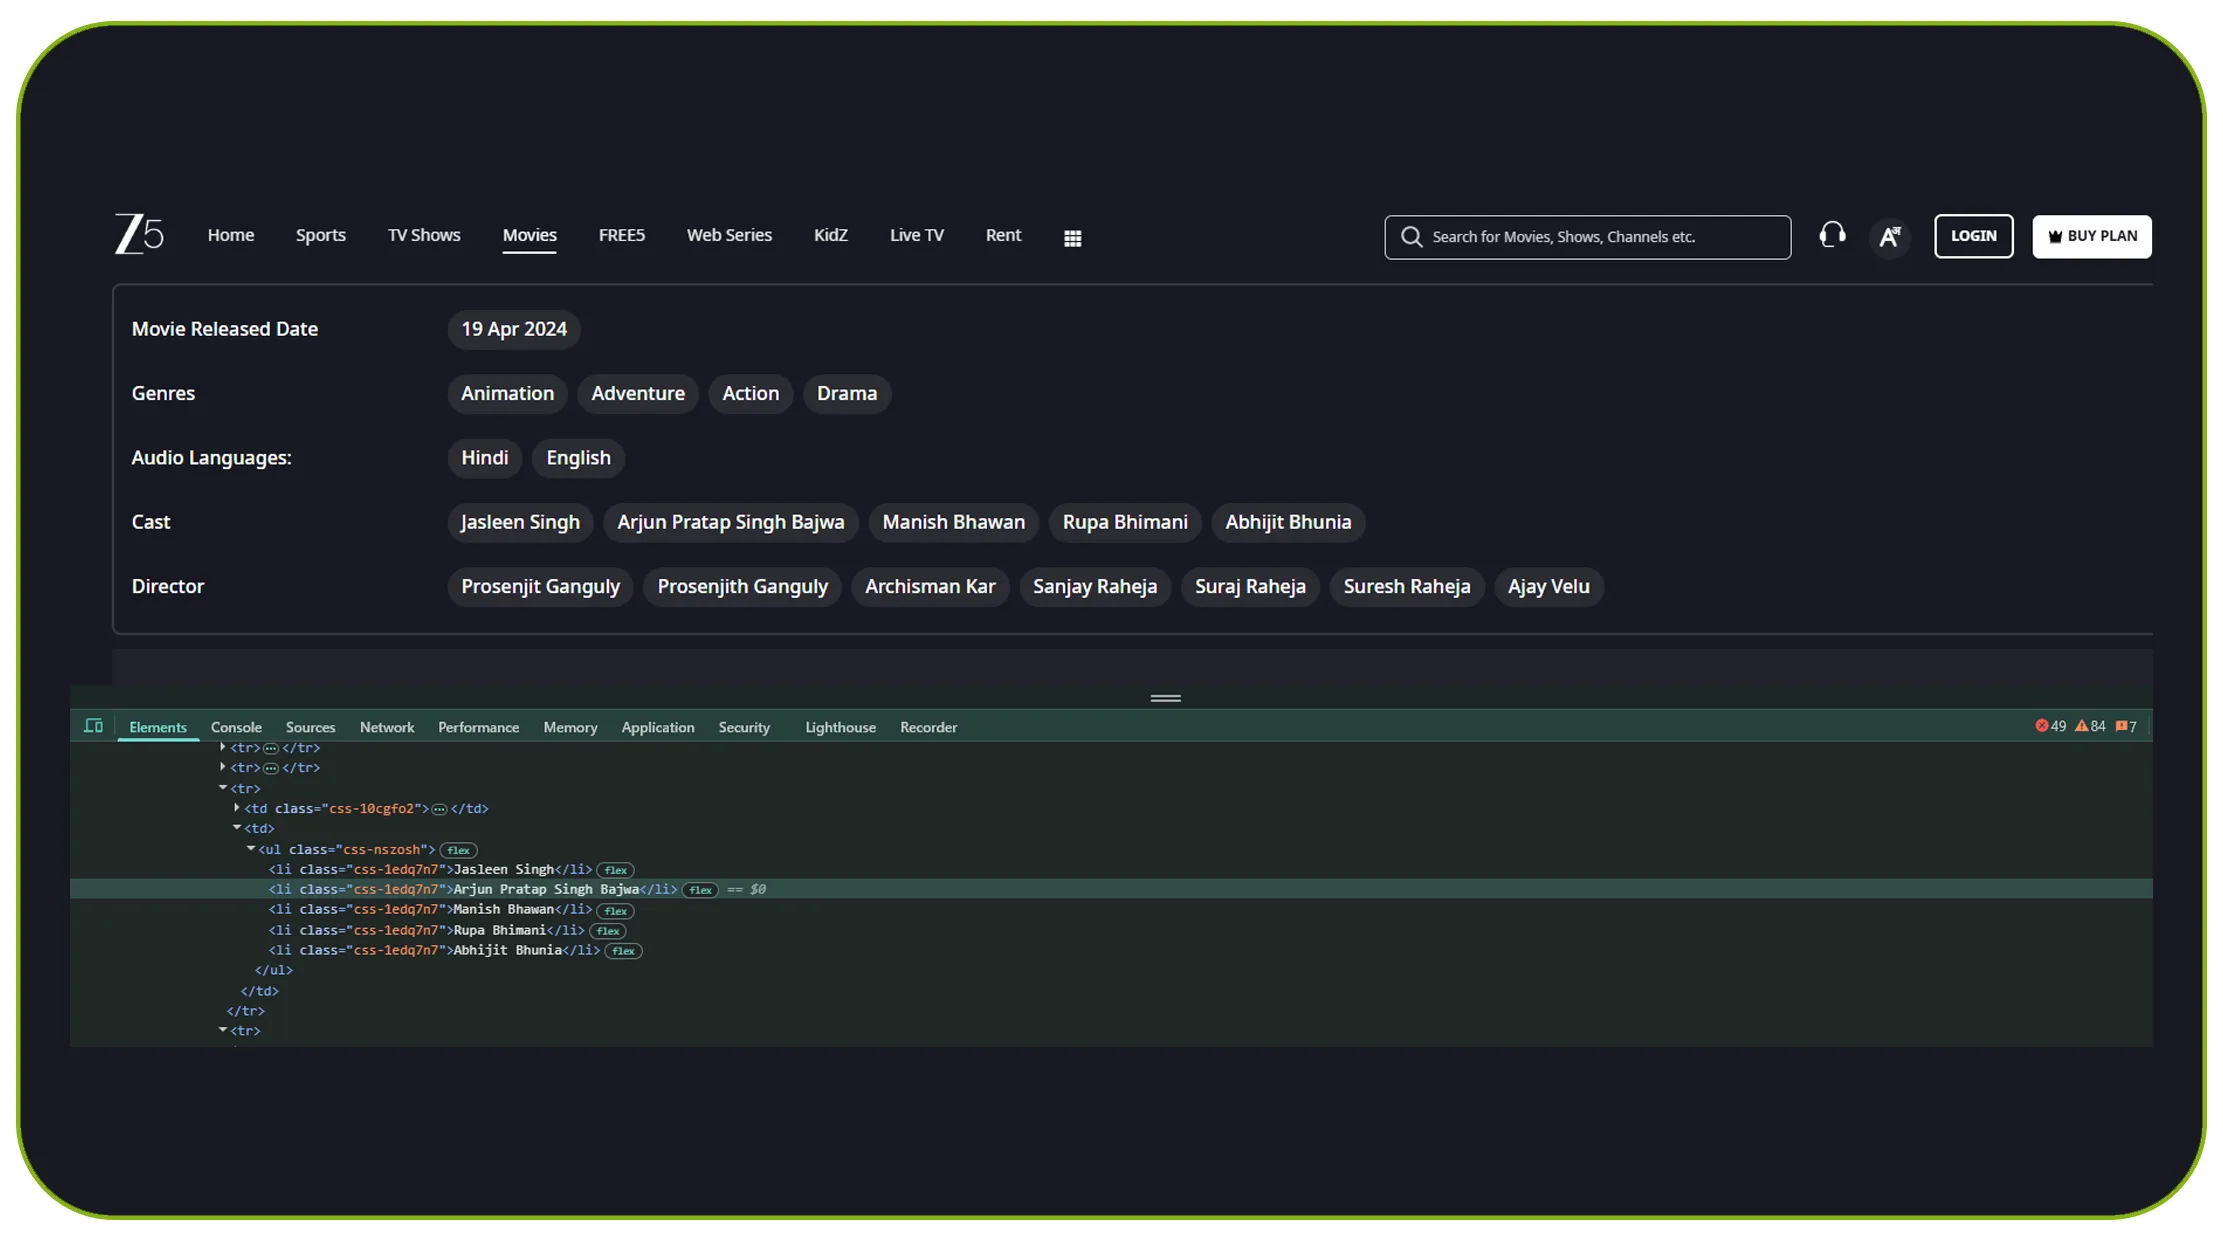
An OTT Data Scraping API can provide a reusable data layer for companies that need structured streaming intelligence across large volumes of records.
The API model can simplify integration with existing business systems. Data can flow into databases, dashboards, business intelligence platforms, machine-learning workflows, or internal research applications.
For example, a content analytics company could create an automated pipeline:
OTT source → Data collection → Cleaning → API → Database → Analytics → Dashboard → Business decision
This architecture supports multiple use cases.
A marketing team can identify popular titles and plan campaigns around relevant content. A media research company can monitor genre and language trends. A content acquisition team can compare catalog patterns. An advertising business can study content categories that attract stronger visibility.
| Use case | Example output | Decision supported |
|---|---|---|
| Catalog monitoring | New and removed titles | Content tracking |
| Ranking analysis | Position changes | Popularity research |
| Genre analysis | Category trends | Programming |
| Language analysis | Regional content mix | Localization |
| Rating analysis | Rating movements | Content benchmarking |
| Competitive research | Cross-period comparisons | Market strategy |
From 2020 to 2026, the biggest shift in OTT analytics has been the move from static research toward continuously refreshed intelligence. The exact scale varies by business, but the principle is consistent: fresher data creates more opportunities to detect changes before they become obvious.
An API also makes the data easier to consume. Analysts do not have to repeatedly collect and clean raw records. They can work with structured outputs that fit their existing workflows.
For organizations building recurring OTT research programs, this can improve operational efficiency and make data-driven decisions more repeatable.
Why should businesses choose Real Data API?
Real Data API can help businesses build scalable data collection workflows for OTT research and competitive intelligence.
The key advantage is an end-to-end approach. Data collection, structuring, normalization, delivery, and integration can be planned around the buyer's specific use case.
Businesses can use the resulting datasets for catalog monitoring, ranking analysis, content research, market intelligence, and trend detection. Automated workflows can also reduce repetitive manual collection.
For organizations that need Scrape ZEE5 API data for OTT content performance, a structured API-based approach can make recurring analysis easier to manage.
Real Data API can also help teams design datasets around specific business questions rather than collecting unnecessary fields. This can improve data relevance and simplify downstream analysis.
The workflow can support:
- Structured OTT datasets.
- Scheduled data collection.
- Historical data storage.
- Data normalization.
- Custom field selection.
- API-based delivery.
- Analytics-ready outputs.
- Scalable integration.
The exact implementation should depend on the required fields, refresh frequency, geography, volume, and intended use.
Conclusion
OTT competition changes quickly. New titles enter catalogs. Rankings shift. Audience interests move between genres and languages. Manual research makes it difficult to capture these changes consistently.
A structured data pipeline can solve that problem by turning OTT catalog information into historical, comparable, and analytics-ready records.
The biggest opportunity comes from combining catalog metadata with ranking, rating, genre, language, release, and availability signals. This creates a broader view of content performance and helps teams move from simple catalog tracking to actionable intelligence.
Businesses can use these insights for content acquisition, competitive research, programming, marketing, trend detection, and market analysis.
For teams that want to Scrape ZEE5 API data for OTT content performance, the next step is to define the required fields, refresh frequency, target use cases, and delivery format.
Ready to build a smarter OTT intelligence workflow? Connect with Real Data API to create a scalable, structured data solution for your content analytics and competitive research needs!
Latest posts
How Safeway Grocery Data Scraping for Consumer Buying Trends Helps Track Shopper Behavior?
How to Analyze consumer electronics trends Micro Center API to Identify Product Demand and Market Opportunities?
How A guide to Momondo flight data scraping Helps Businesses Overcome Flight Price Tracking and Market Analysis Challenges?
How Scrape Xiaohongshu Product Trends in Real Time Solves Product Discovery and Competitor Monitoring Challenges?






.png)



