Introduction
Safeway grocery data scraping for consumer buying trends gives retailers, CPG brands, pricing teams, and market researchers a structured view of products, prices, promotions, availability, and assortment changes. This data helps answer a simple business question: What are shoppers likely to buy, and what is changing that behavior?
The need is clear. U.S. food-at-home prices rose 24% between January 2020 and January 2023, according to the USDA Economic Research Service. Food-at-home prices then increased 1.2% in 2024 and 2.3% in 2025.
| Year | U.S. grocery price trend / context |
|---|---|
| 2020 | Pandemic changed household food consumption |
| 2021 | Supply-chain pressure increased |
| 2022 | Food prices rose 9.9% |
| 2023 | Food prices rose 5.8% |
| 2024 | Food-at-home prices rose 1.2% |
| 2025 | Food-at-home prices rose 2.3% |
| 2026 | Food-at-home CPI was 2.7% higher YoY in June |
Source: USDA ERS. The 2026 figure reflects June 2026 year-over-year data, not a full-year result.
For businesses, the pain point is fragmented retail information. Manual checks cannot reliably capture thousands of products and frequent price or availability changes. A Safeway Grocery Scraping API can turn this changing information into structured datasets for analysis, dashboards, forecasting, and competitive intelligence.
Target audience: grocery retailers, CPG brands, consumer research teams, pricing analysts, e-commerce companies, and market intelligence teams.
How can businesses build a complete product view?
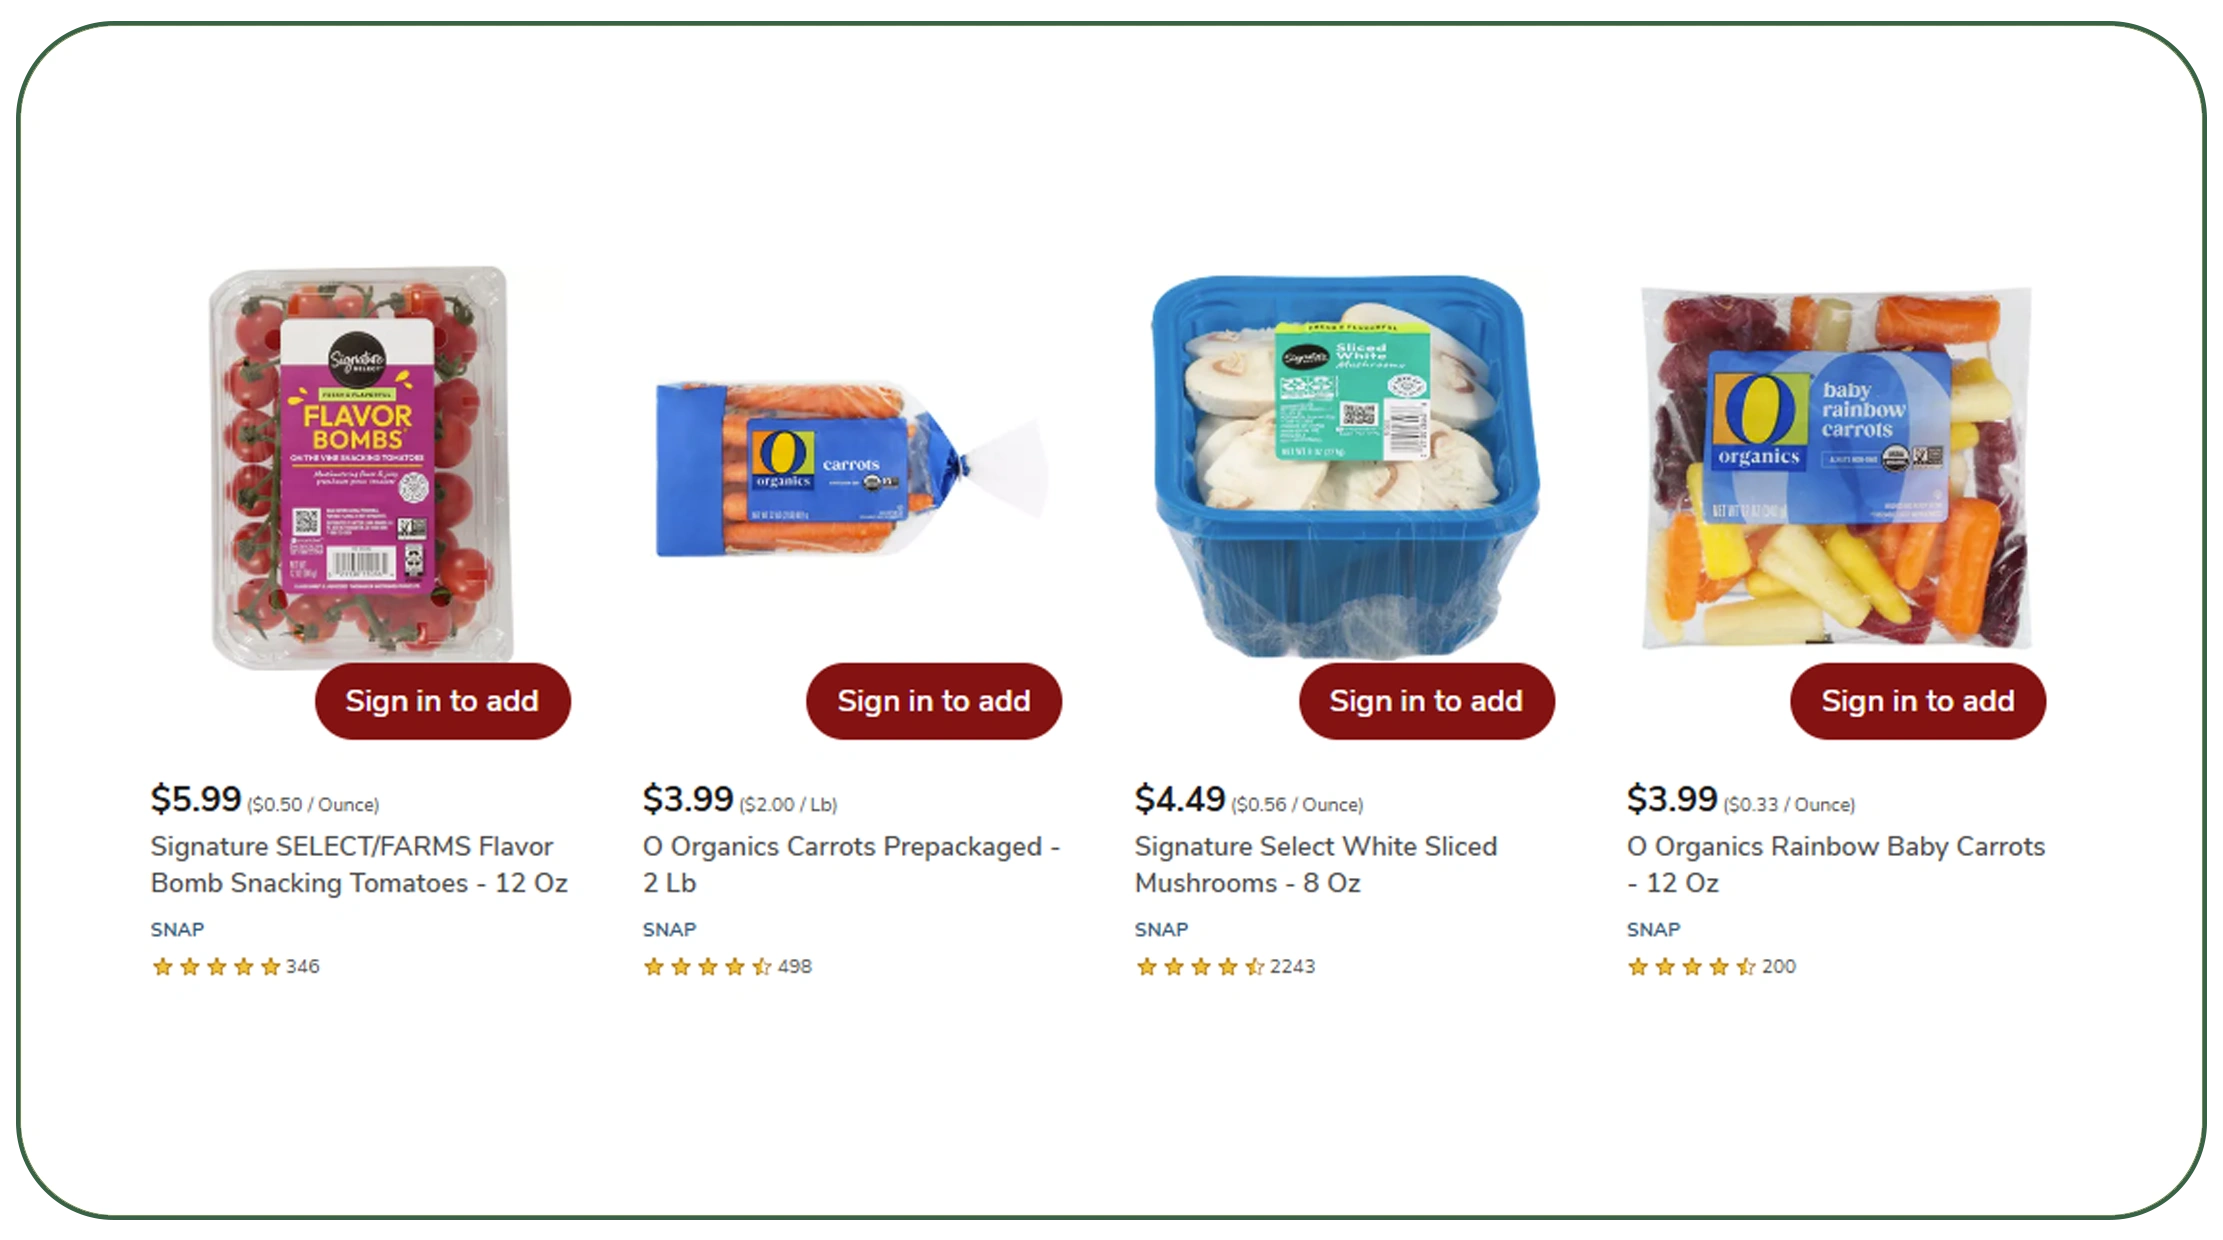
Extract Safeway product catalog data to create a structured product intelligence layer. A catalog dataset can include product names, brands, categories, sizes, package information, listed prices, promotions, availability, ratings, and other visible attributes.
This helps analysts study assortment depth and product movement. They can compare private-label and national brands. They can identify products that appear frequently across categories. They can also detect assortment changes over time.
A useful workflow starts with category discovery. The scraper collects product pages and category information. It then standardizes names, brands, sizes, and categories. The system can remove duplicate records and preserve historical snapshots.
This matters because shopper behavior does not depend only on price. Consumers also respond to package size, brand choice, promotions, product availability, and assortment.
| Year | Industry signal | Data opportunity |
|---|---|---|
| 2020 | Household food consumption shifted | Establish product baselines |
| 2021 | Supply pressure continued | Track assortment changes |
| 2022 | Food inflation reached 9.9% | Monitor price-sensitive categories |
| 2023 | Inflation remained elevated | Compare brands and pack sizes |
| 2024 | Food-at-home inflation slowed to 1.2% | Study stabilization |
| 2025 | Food-at-home prices rose 2.3% | Track renewed category pressure |
| 2026 | Food-at-home CPI was +2.7% YoY in June | Monitor current movement |
USDA data shows how quickly grocery conditions can change.
For example, a brand can compare the number of products in a category each month. It can then identify new launches, discontinued products, assortment expansion, and gaps. This creates a stronger foundation for consumer buying trend analysis.
How can teams identify price changes as they happen?
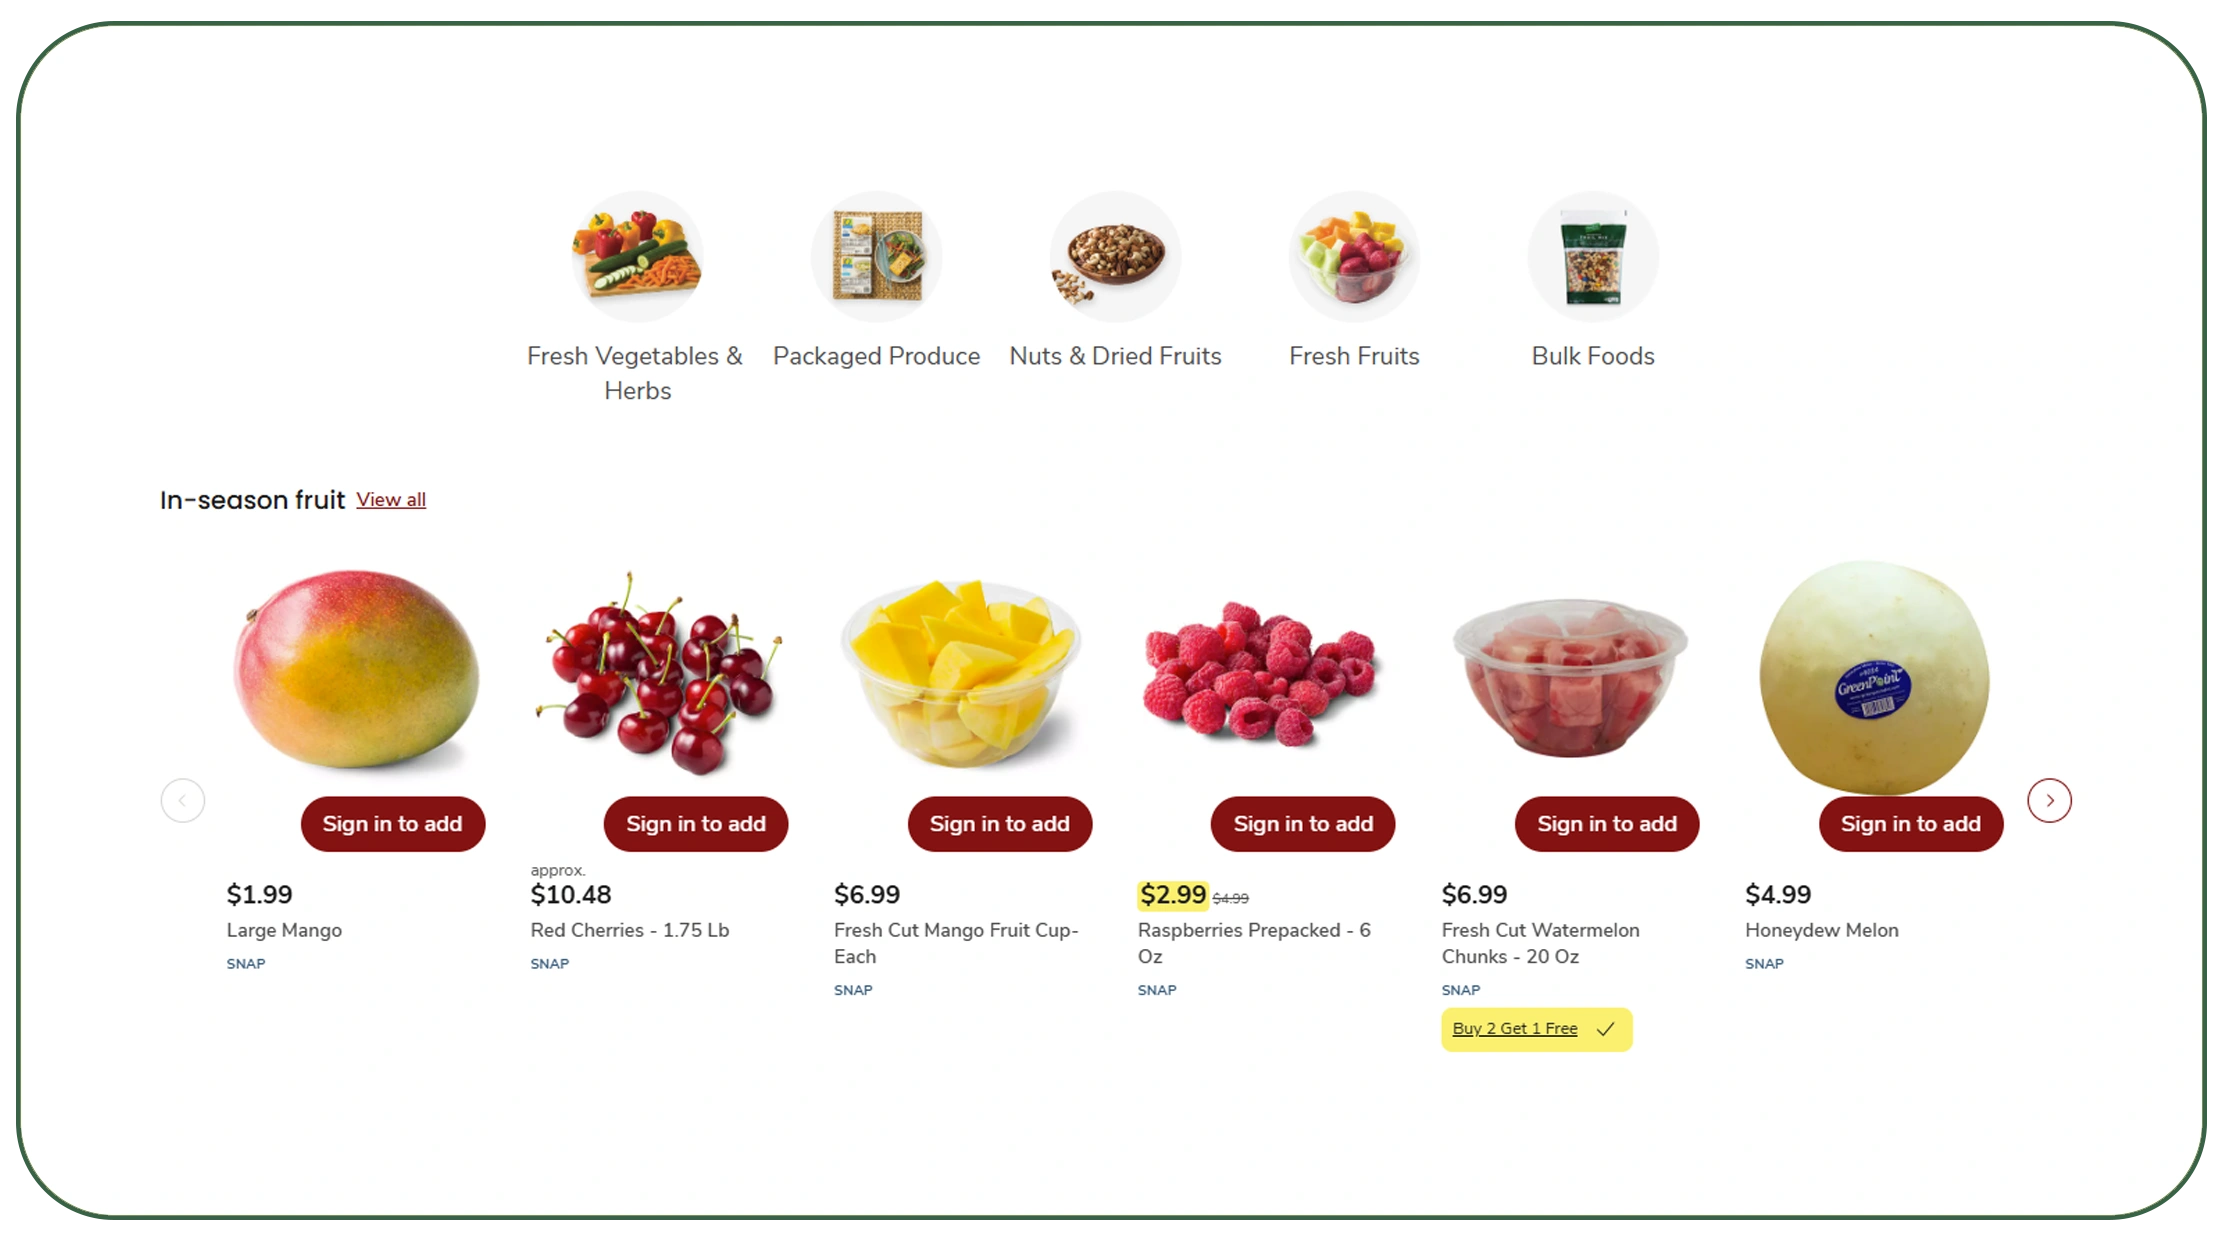
Monitor Safeway grocery prices in real time to understand how pricing affects consumer decisions. Grocery prices can change because of promotions, supply conditions, seasonality, competition, and category-level demand.
A price dataset allows analysts to compare the same product across different collection dates. They can calculate price changes and identify unusually large movements.
The value becomes greater when price information connects with product and availability data. A price increase combined with declining availability may tell a different story than a price increase during a promotional cycle.
USDA data highlights this volatility. In 2025, average U.S. food-at-home prices increased 2.3%. But individual categories moved very differently. Egg prices were 21.9% higher than in 2024, while beef and veal prices increased 11.6%.
| Year | Food-price signal | Business question |
|---|---|---|
| 2020 | Consumption patterns shifted | Which categories changed fastest? |
| 2021 | Supply constraints intensified | Which products became harder to find? |
| 2022 | +9.9% food CPI | Which categories became price-sensitive? |
| 2023 | +5.8% food prices | Where did inflation continue? |
| 2024 | +1.2% food-at-home | Which categories stabilized? |
| 2025 | +2.3% food-at-home | Which categories accelerated? |
| 2026 | +2.7% food-at-home YoY in June | Which prices are moving now? |
Businesses can use this information for price benchmarking, promotion tracking, assortment decisions, and category analysis. A time-series dataset can also show whether a price movement is temporary or persistent.
This is especially useful for CPG companies. They can track how their products compare with similar products. Pricing teams can identify potential gaps. Market researchers can connect price changes with changes in product availability and assortment.
How can grocery baskets reveal changing shopper preferences?
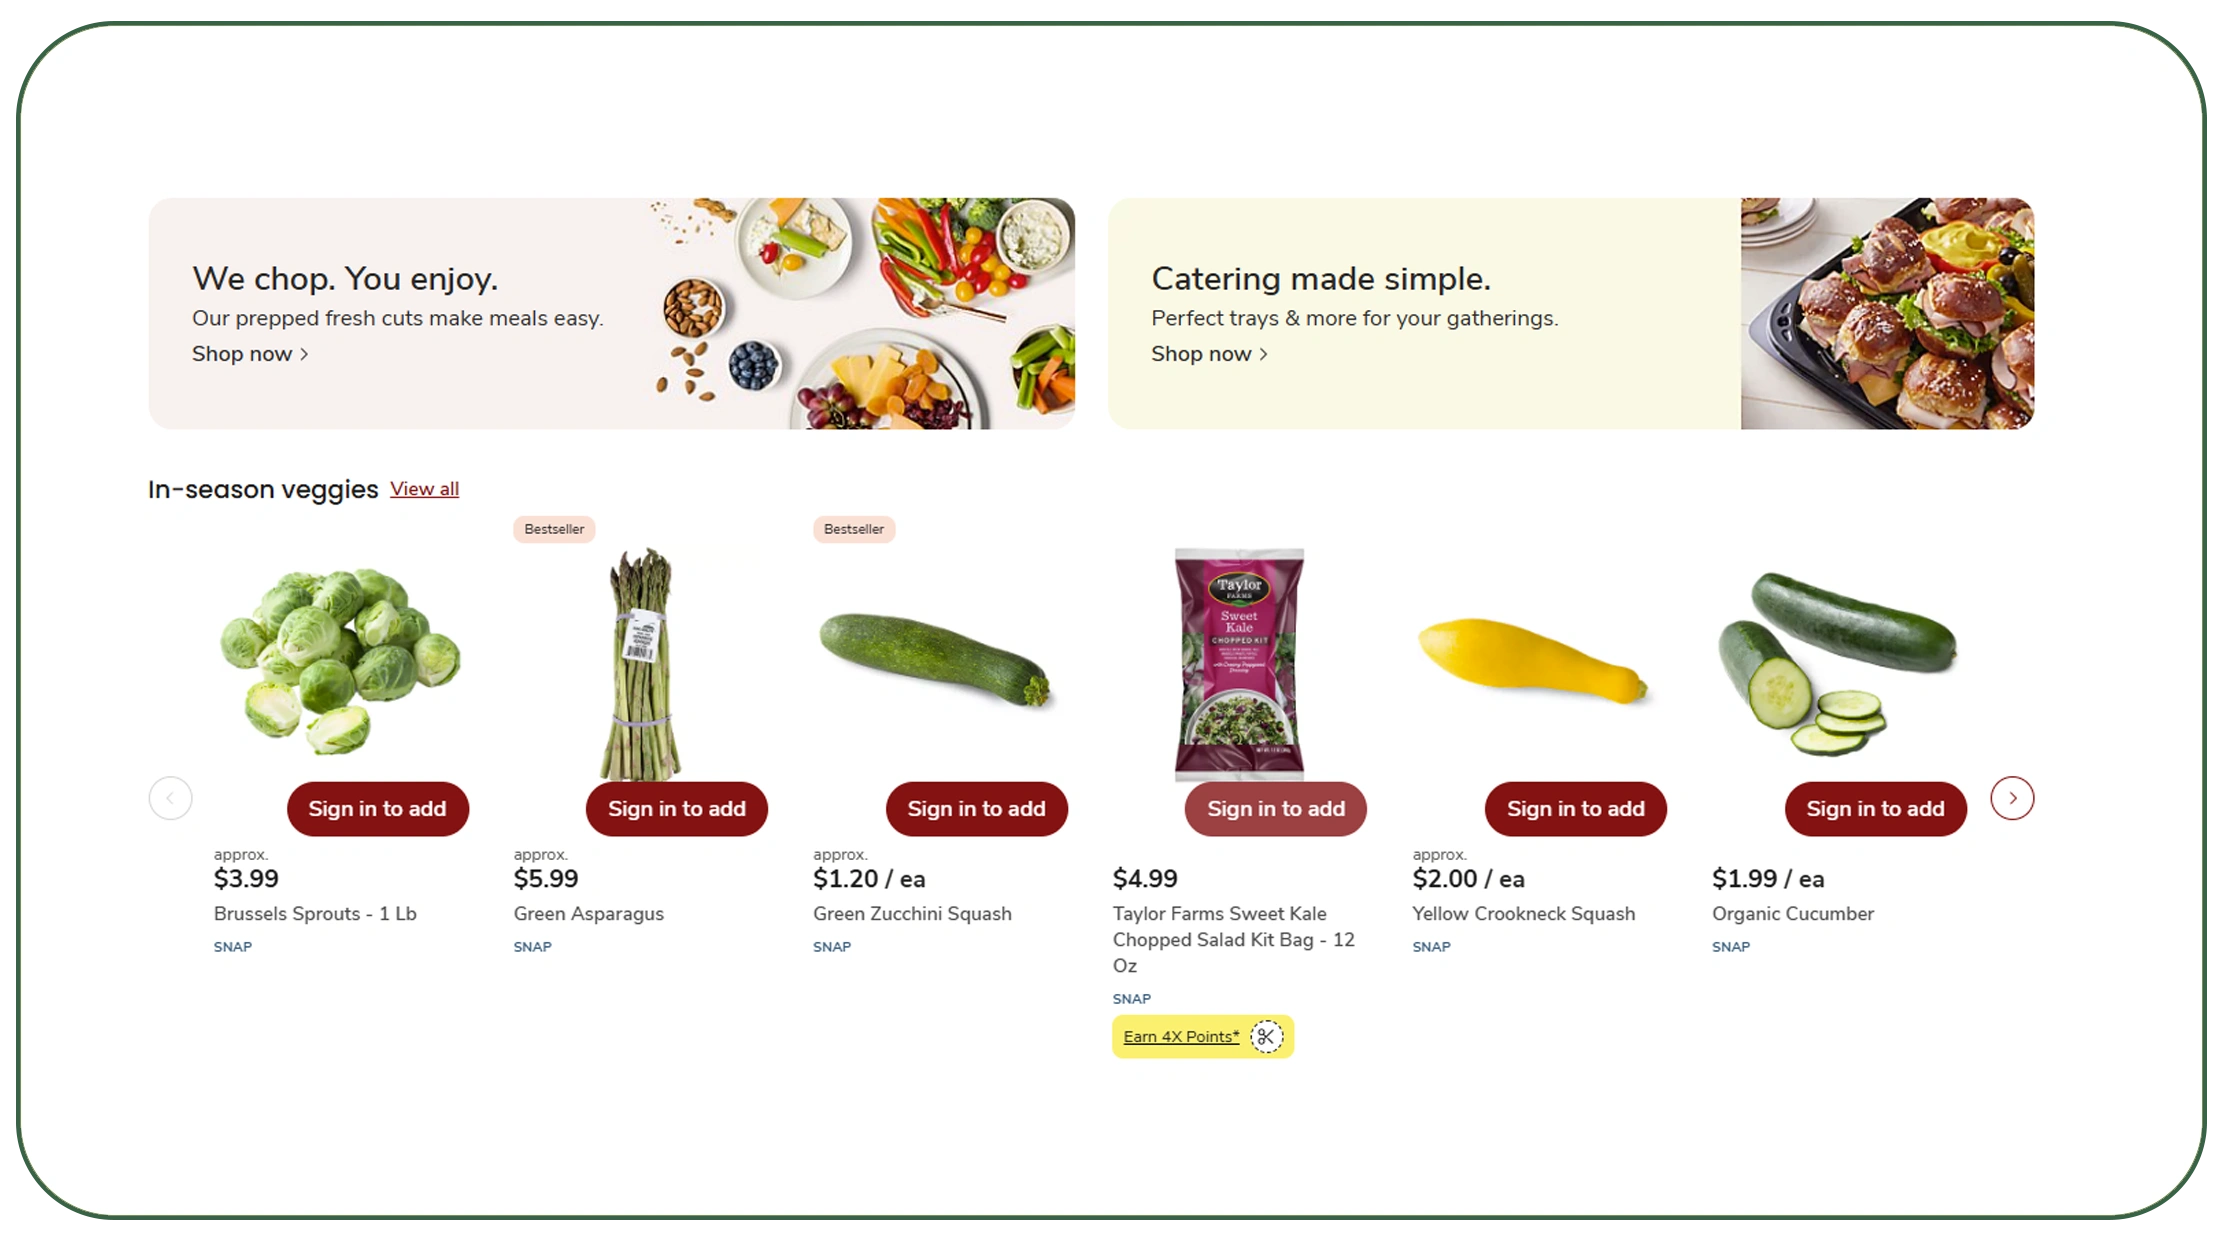
Grocery basket data intelligence using Safeway scraper helps move analysis beyond individual products. It focuses on relationships between products, categories, prices, and shopping patterns.
A basket-oriented dataset can help identify product combinations and category relationships. For example, analysts may examine whether promotions around one product category coincide with stronger visibility across related categories. They can also study changes in average prices, pack sizes, brands, and category mixes.
Basket intelligence is particularly useful for consumer trend research. A product may remain popular while shoppers move toward smaller packages. Another category may see stronger demand for private-label products during periods of inflation.
The broader market context supports this approach. USDA reported that U.S. food-at-home prices increased 24% from January 2020 to January 2023. That major price shift created an important period for studying how shoppers adjusted their grocery choices.
| Period | Market condition | Basket analysis opportunity |
|---|---|---|
| 2020 | Pandemic disruption | Identify changed category mixes |
| 2021 | Supply challenges | Track substitution behavior |
| 2022 | High inflation | Study price-sensitive baskets |
| 2023 | Continued price pressure | Compare brand and pack choices |
| 2024 | Lower inflation | Detect normalization |
| 2025 | 2.3% food-at-home increase | Track category-specific pressure |
| 2026 | 2.7% YoY food-at-home CPI in June | Monitor current consumer pressure |
The resulting intelligence can support demand planning and promotional strategy. Brands can also compare product positioning across categories. Retail analysts can identify which product attributes appear alongside changing prices or promotions.
The key advantage is context. Instead of asking only, "What is the price?", teams can ask, "How does this price fit into the wider grocery assortment?"
What can a historical grocery dataset reveal?
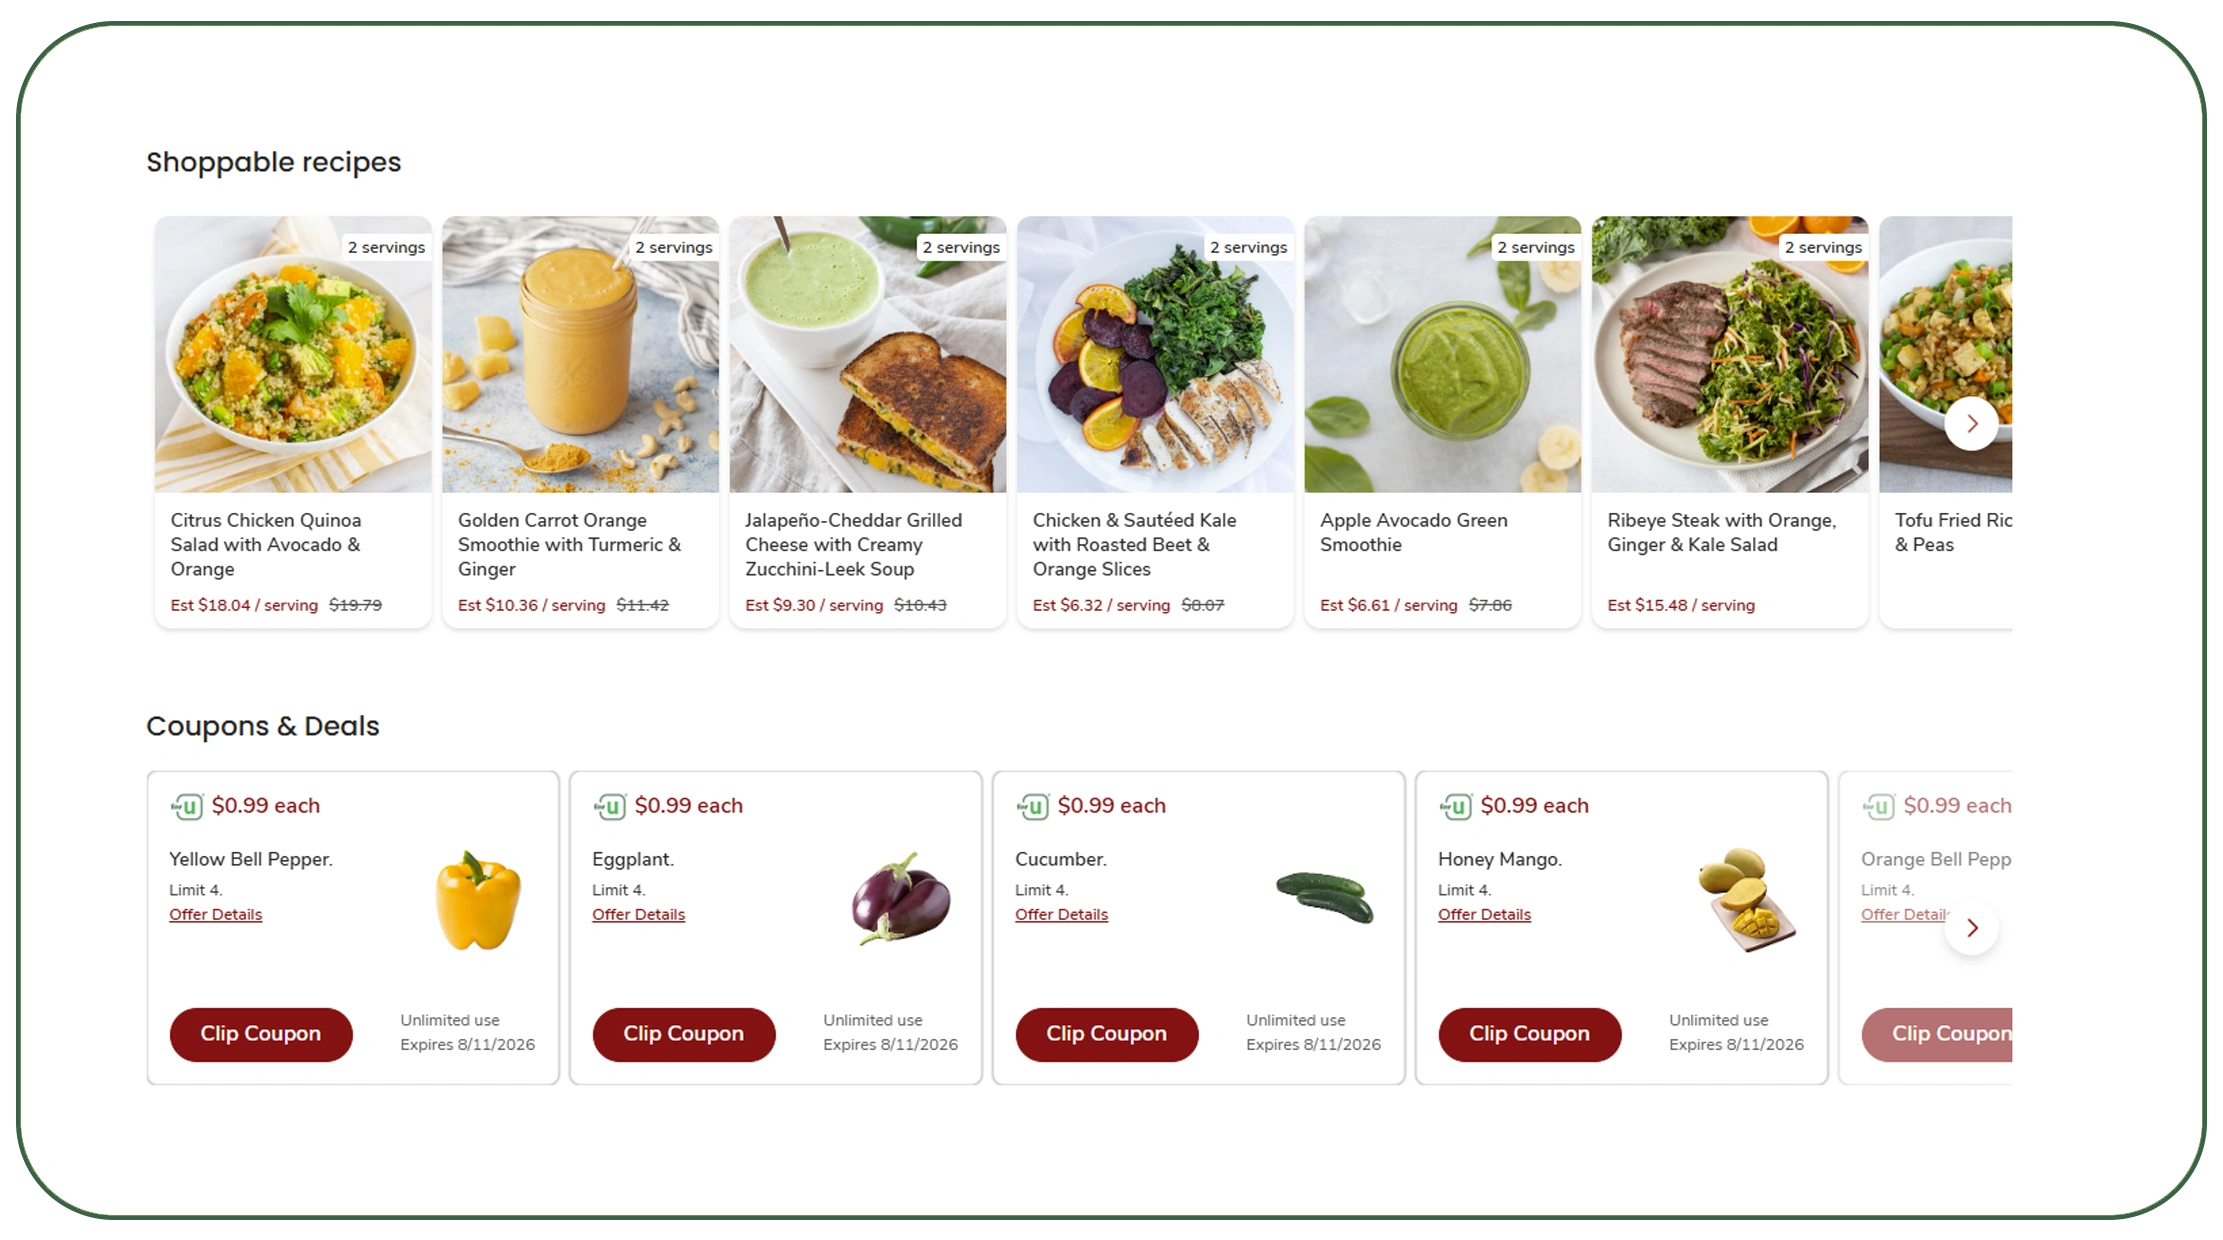
Web Scraping Safeway Dataset creates a historical record that analysts can use to study market movement. Current data shows what is happening today. Historical data shows how the market reached that point.
A useful dataset stores regular snapshots. Each record can include the collection date, product, brand, category, price, promotion, availability, and other relevant fields. Analysts can then compare the same product across weeks, months, or years.
Historical analysis becomes especially valuable during periods of inflation. USDA reported that food-at-home prices increased 5.0% in 2023 but only 1.2% in 2024.
| Year | Food-market indicator | Historical research use |
|---|---|---|
| 2020 | Major consumption disruption | Build starting baseline |
| 2021 | Supply-chain pressure | Compare product availability |
| 2022 | 9.9% food inflation | Measure major price shifts |
| 2023 | 5.8% food-price growth | Track continued inflation |
| 2024 | 1.2% food-at-home growth | Measure stabilization |
| 2025 | 2.3% food-at-home growth | Identify category divergence |
| 2026 | 3.0% food CPI YoY in June | Extend the trend into current conditions |
This historical structure can support several analyses. Teams can calculate average price changes. They can identify products with repeated promotions. They can track new product introductions. They can measure assortment expansion or contraction.
Historical data also improves forecasting. Analysts can compare current conditions with previous periods. They can identify seasonal patterns and unusual movements.
For consumer research teams, the dataset provides a consistent evidence base. Instead of relying only on surveys or isolated observations, they can combine consumer research with observable retail data.
How can automated scraping improve competitive research?
A Safeway Scraper can automate repetitive data collection and reduce the need for manual product checks. Automation is important because grocery catalogs contain many products and change frequently.
A scraping workflow can schedule collection at defined intervals. It can capture product-level information and store historical records. Data can then move into databases, dashboards, analytics platforms, or internal research systems.
Automation also improves consistency. Manual research may collect different fields on different days. A standardized scraper can follow the same extraction logic each time.
The market environment makes consistency important. In 2024, food-at-home prices increased only 1.2%, while some categories still experienced much stronger changes. In 2025, eggs rose 21.9% on average and beef and veal rose 11.6%.
| Year | Observed market pressure | Automation priority |
|---|---|---|
| 2020 | Demand disruption | Frequent catalog monitoring |
| 2021 | Supply uncertainty | Availability tracking |
| 2022 | 9.9% food inflation | Price monitoring |
| 2023 | 5.8% food-price growth | Historical comparisons |
| 2024 | 1.2% food-at-home growth | Promotion monitoring |
| 2025 | Category-level divergence | Category alerts |
| 2026 | 2.7% food-at-home CPI YoY in June | Near-real-time monitoring |
Businesses can set rules around price changes, missing products, new listings, or assortment changes. For example, a pricing team could flag products that change by more than a selected percentage. A category manager could receive an alert when a competitor product disappears.
This turns scraping into an operational intelligence system rather than a one-time research project.
How can an API make grocery intelligence scalable?
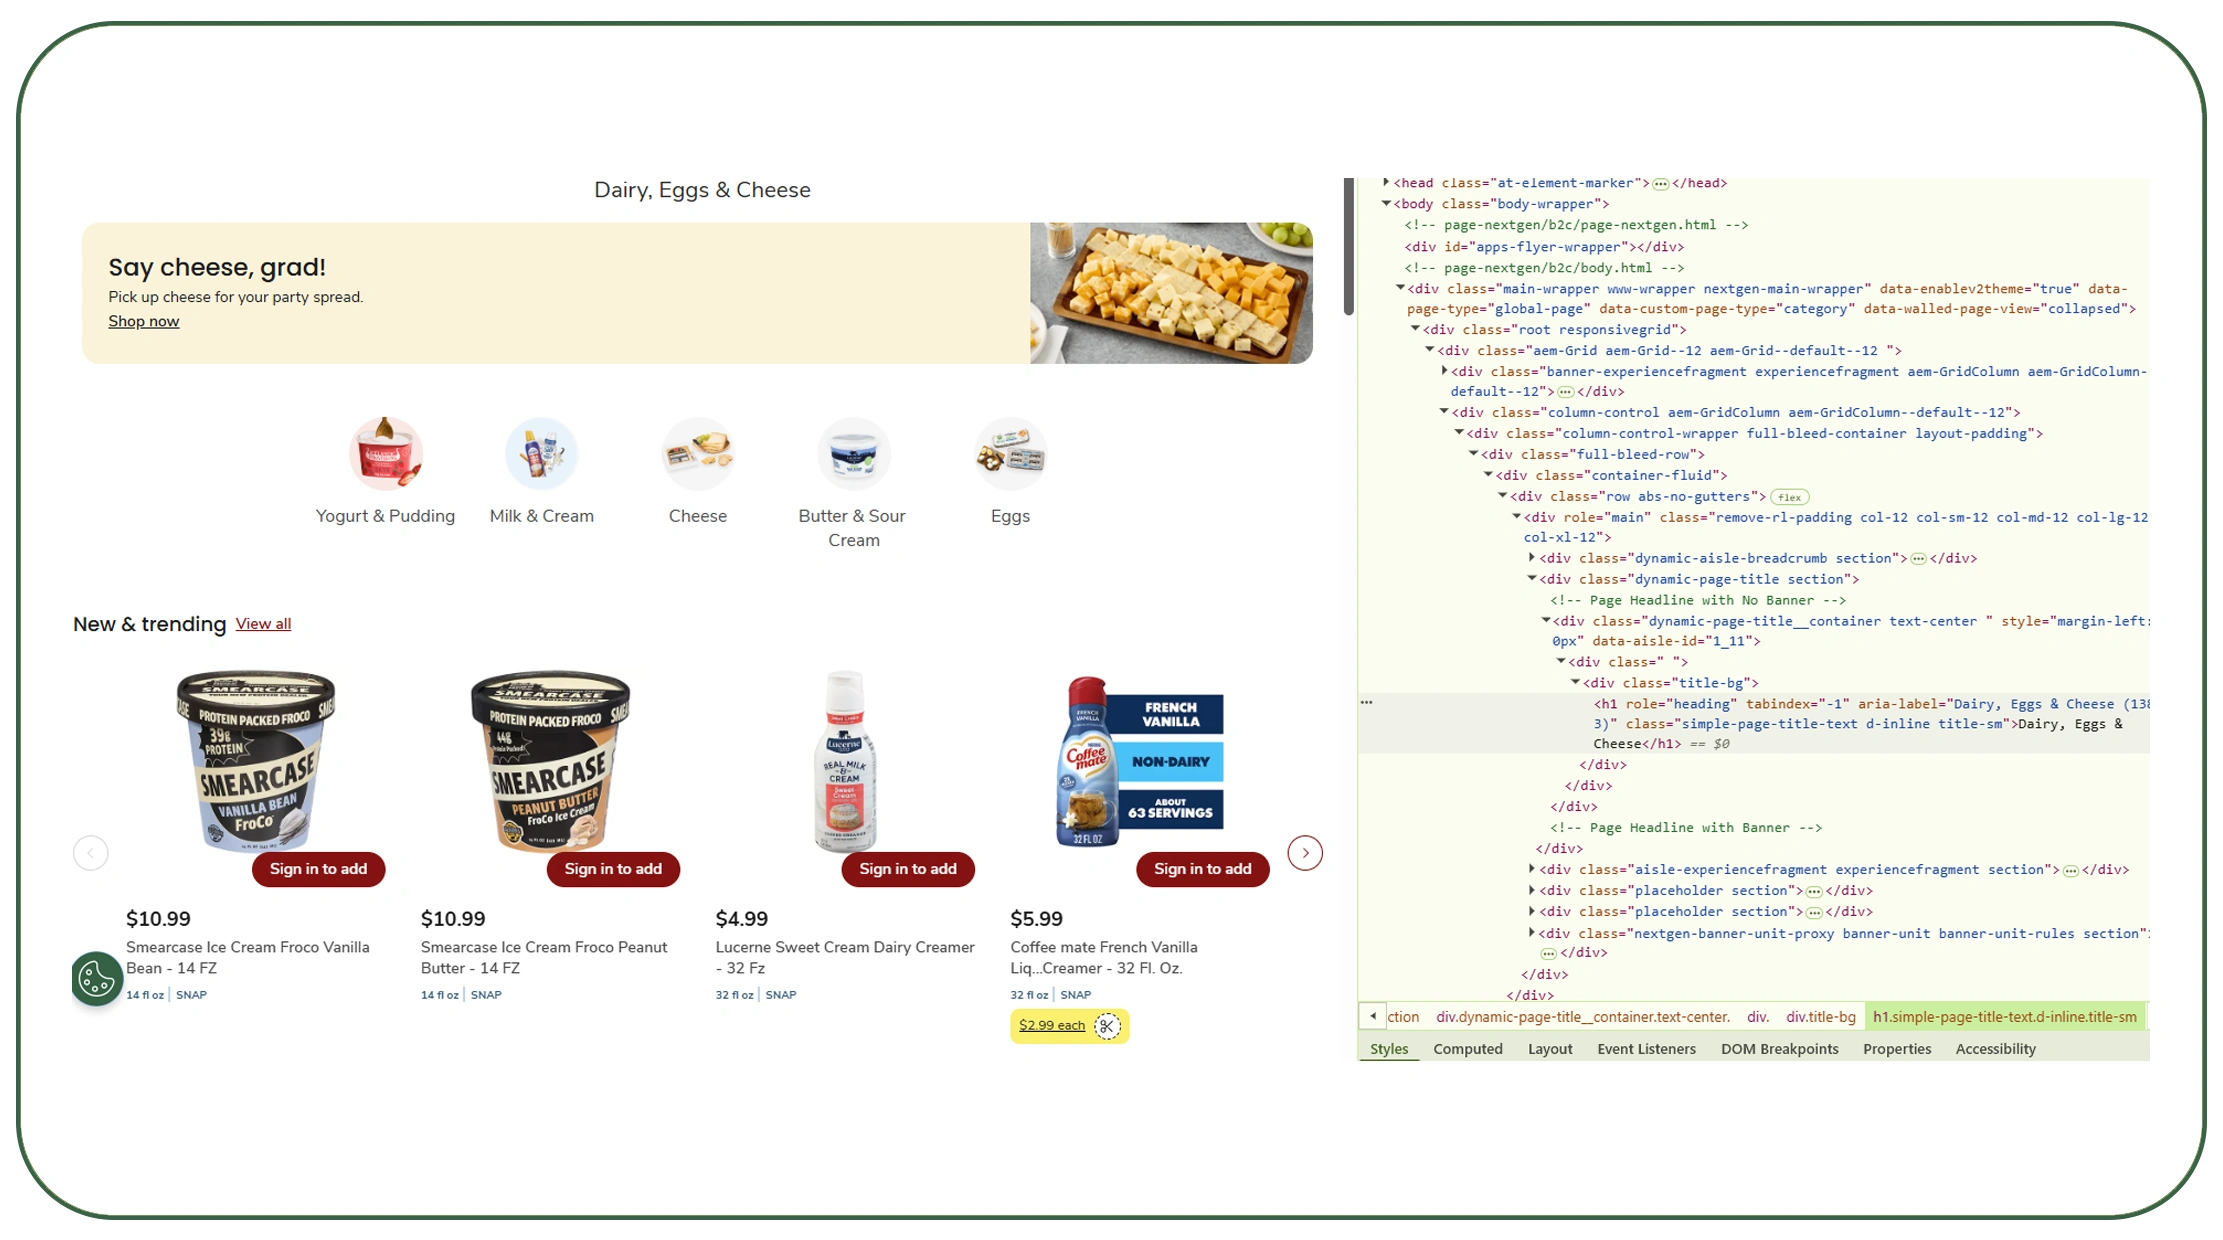
A Grocery Data Scraping API can provide a scalable connection between grocery websites and business analytics systems. Instead of manually collecting and exporting information, teams can build automated pipelines.
An API-based approach works well for companies that need recurring data. Developers can integrate collected information into databases, business intelligence tools, pricing systems, or research platforms.
The data can support several workflows:
- Product catalog monitoring.
- Price and promotion tracking.
- Availability analysis.
- Assortment comparison.
- Brand intelligence.
- Category research.
- Consumer trend analysis.
- Historical price analysis.
- Competitive intelligence.
- Demand forecasting.
The need for scalable grocery intelligence is supported by continued price movement. USDA reported that food prices were 3.0% higher in June 2026 than in June 2025, while food-at-home prices were 2.7% higher.
| Year | Market signal | API value |
|---|---|---|
| 2020 | Rapid behavior change | Establish automated collection |
| 2021 | Supply uncertainty | Monitor availability |
| 2022 | High inflation | Scale price tracking |
| 2023 | Persistent price growth | Build historical datasets |
| 2024 | Inflation slowdown | Monitor stabilization |
| 2025 | 2.3% food-at-home growth | Track category differences |
| 2026 | 2.7% food-at-home YoY in June | Support current intelligence |
For larger organizations, scalability matters because data requirements grow quickly. One product category can become hundreds or thousands of records when tracked across locations and collection dates.
An API makes this information easier to integrate. It can support scheduled extraction, structured outputs, historical storage, and downstream analytics.
Why Choose Real Data API for Grocery Intelligence?
Safeway grocery data scraping for consumer buying trends becomes more useful when the collection process is consistent, structured, and designed for recurring analysis.
Real Data API can support businesses that need grocery datasets for market research, pricing intelligence, product monitoring, and consumer trend analysis. The focus should remain on usable data rather than raw page collection.
A strong data workflow should provide:
- Structured product information.
- Recurring data collection.
- Historical datasets.
- Price and promotion monitoring.
- Category-level organization.
- Scalable API access.
- Data suitable for analytics and dashboards.
- Support for business intelligence workflows.
The USDA Food Price Outlook continues to track both current food prices and forecasts. Its July 2026 update reported a 3.1% projected increase for all food prices in 2026.
For retailers and brands, combining external market indicators with detailed grocery-level data can create a stronger decision framework. Teams can see broad market movement and then investigate specific products, categories, and price changes.
Conclusion
Safeway grocery data scraping for consumer buying trends helps businesses turn changing grocery information into measurable shopper intelligence. Product catalogs show what is available. Price histories show how costs change. Promotions reveal retail tactics. Availability data highlights assortment changes. Historical datasets show how consumer-facing markets evolve.
The period from 2020 through 2026 demonstrates why this information matters. U.S. food prices experienced significant disruption during the pandemic and inflation period. Food prices rose sharply in 2022 and then slowed in 2023 and 2024. Yet category-level differences remained significant in 2025 and 2026.
Businesses can use structured grocery data to:
- Track product and category changes.
- Monitor pricing and promotions.
- Compare assortment over time.
- Identify changing shopper preferences.
- Build historical market datasets.
- Improve competitive intelligence.
- Support pricing and merchandising decisions.
- Strengthen demand and trend analysis.
The key is consistency. One snapshot provides limited insight. Regular collection creates a timeline. That timeline can reveal patterns that manual research often misses.
Ready to turn grocery data into actionable consumer insights? Connect with Real Data API to automate your grocery data collection and build scalable retail intelligence for smarter decisions!
Latest posts
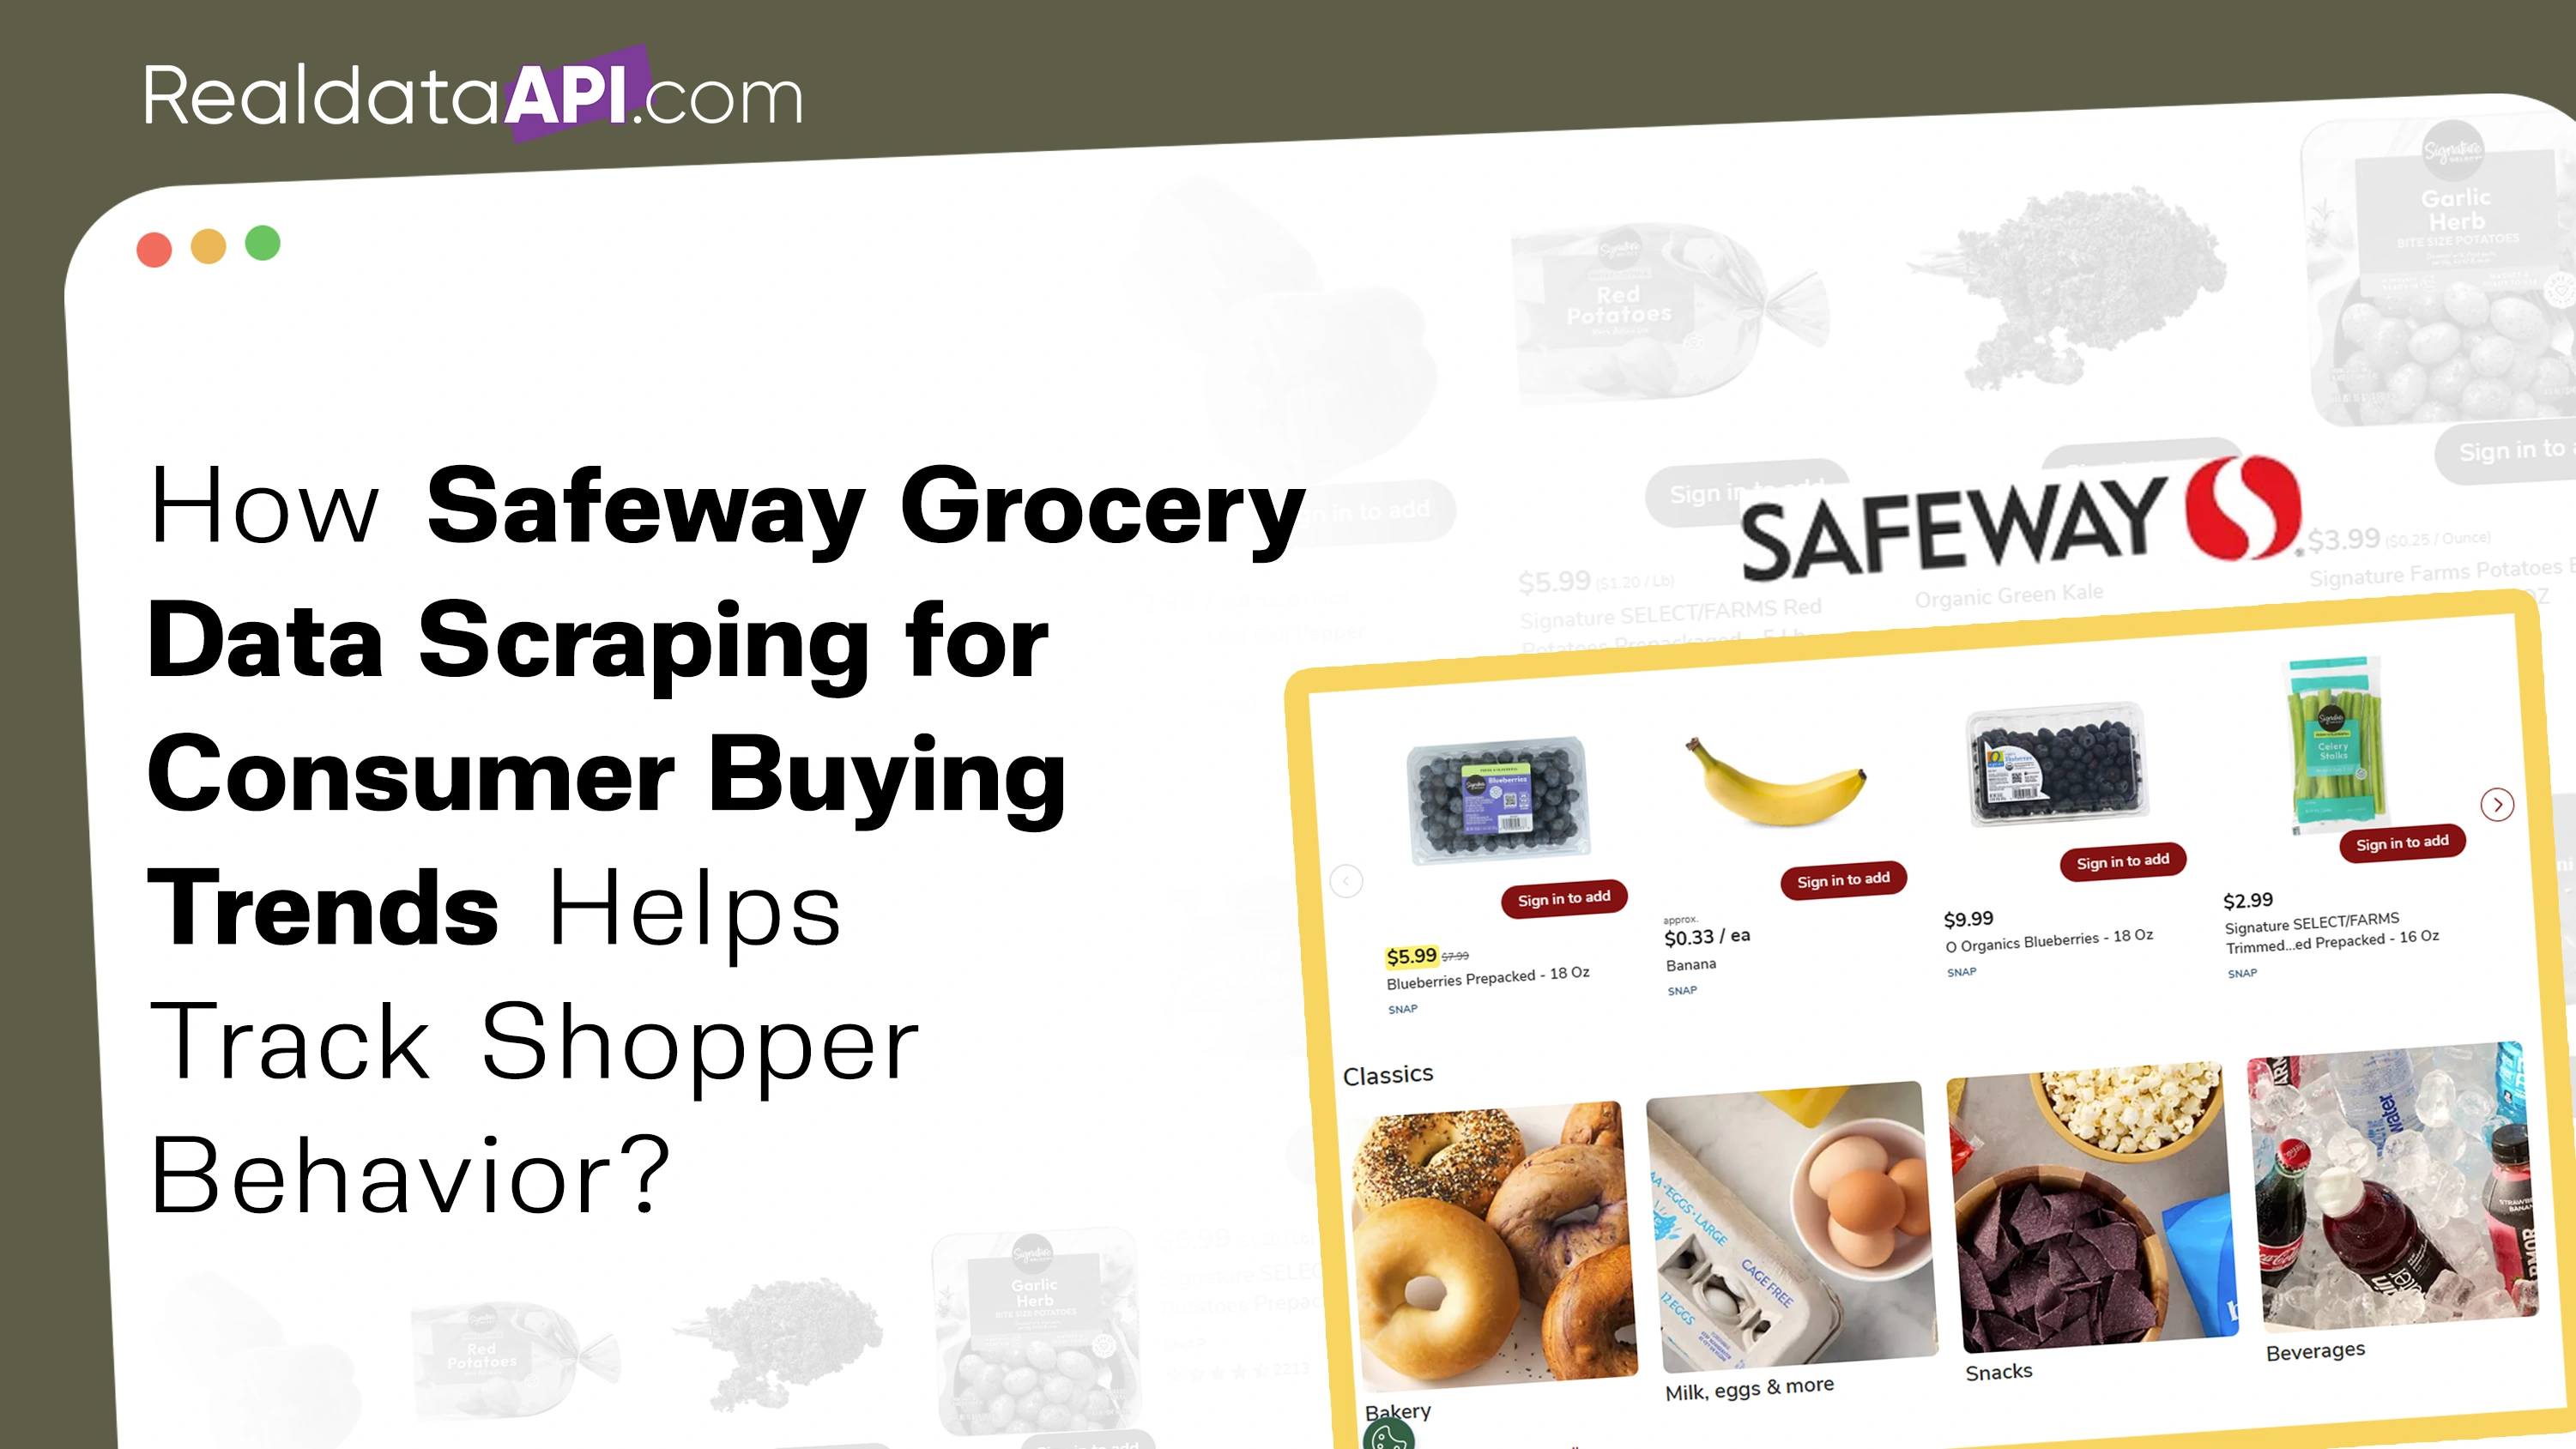
How Safeway Grocery Data Scraping for Consumer Buying Trends Helps Track Shopper Behavior?
How to Analyze consumer electronics trends Micro Center API to Identify Product Demand and Market Opportunities?
How A guide to Momondo flight data scraping Helps Businesses Overcome Flight Price Tracking and Market Analysis Challenges?
How Scrape Xiaohongshu Product Trends in Real Time Solves Product Discovery and Competitor Monitoring Challenges?






.png)



