
Introduction
Businesses can solve pricing, inventory, and competitor monitoring challenges by collecting structured marketplace information and updating it regularly. scrape Taobao product data helps retailers, brands, sellers, and research teams track products, prices, sellers, availability, ratings, reviews, and promotions in one organized dataset.
Alibaba reported that its China retail marketplaces served hundreds of millions of consumers, showing the scale of the ecosystem that businesses compete within. Because marketplace assortment and pricing can change frequently, manual monitoring can quickly become difficult at scale.
The Taobao API can support structured data workflows where suitable access is available. Businesses can combine permitted API access with automated data pipelines, scheduled collection, data validation, and analytics tools.
The main problems this approach solves include:
- Slow competitor price monitoring.
- Incomplete product catalogs.
- Manual inventory checks.
- Difficulty comparing sellers.
- Outdated product information.
- Limited historical pricing data.
- Slow market research.
- Inconsistent marketplace datasets.
For e-commerce managers, pricing analysts, marketplace sellers, brands, and market research teams, structured Taobao information creates a clearer view of marketplace activity. It can support pricing decisions, assortment planning, competitor analysis, inventory monitoring, and product research.
Illustrative industry data point: A marketplace monitoring program tracking 100,000 listings and refreshing them daily would create up to 36.5 million listing observations in one year. This demonstrates why automated collection becomes important when businesses need historical visibility at scale.
How Can Businesses Build a Complete Taobao Product Catalog?
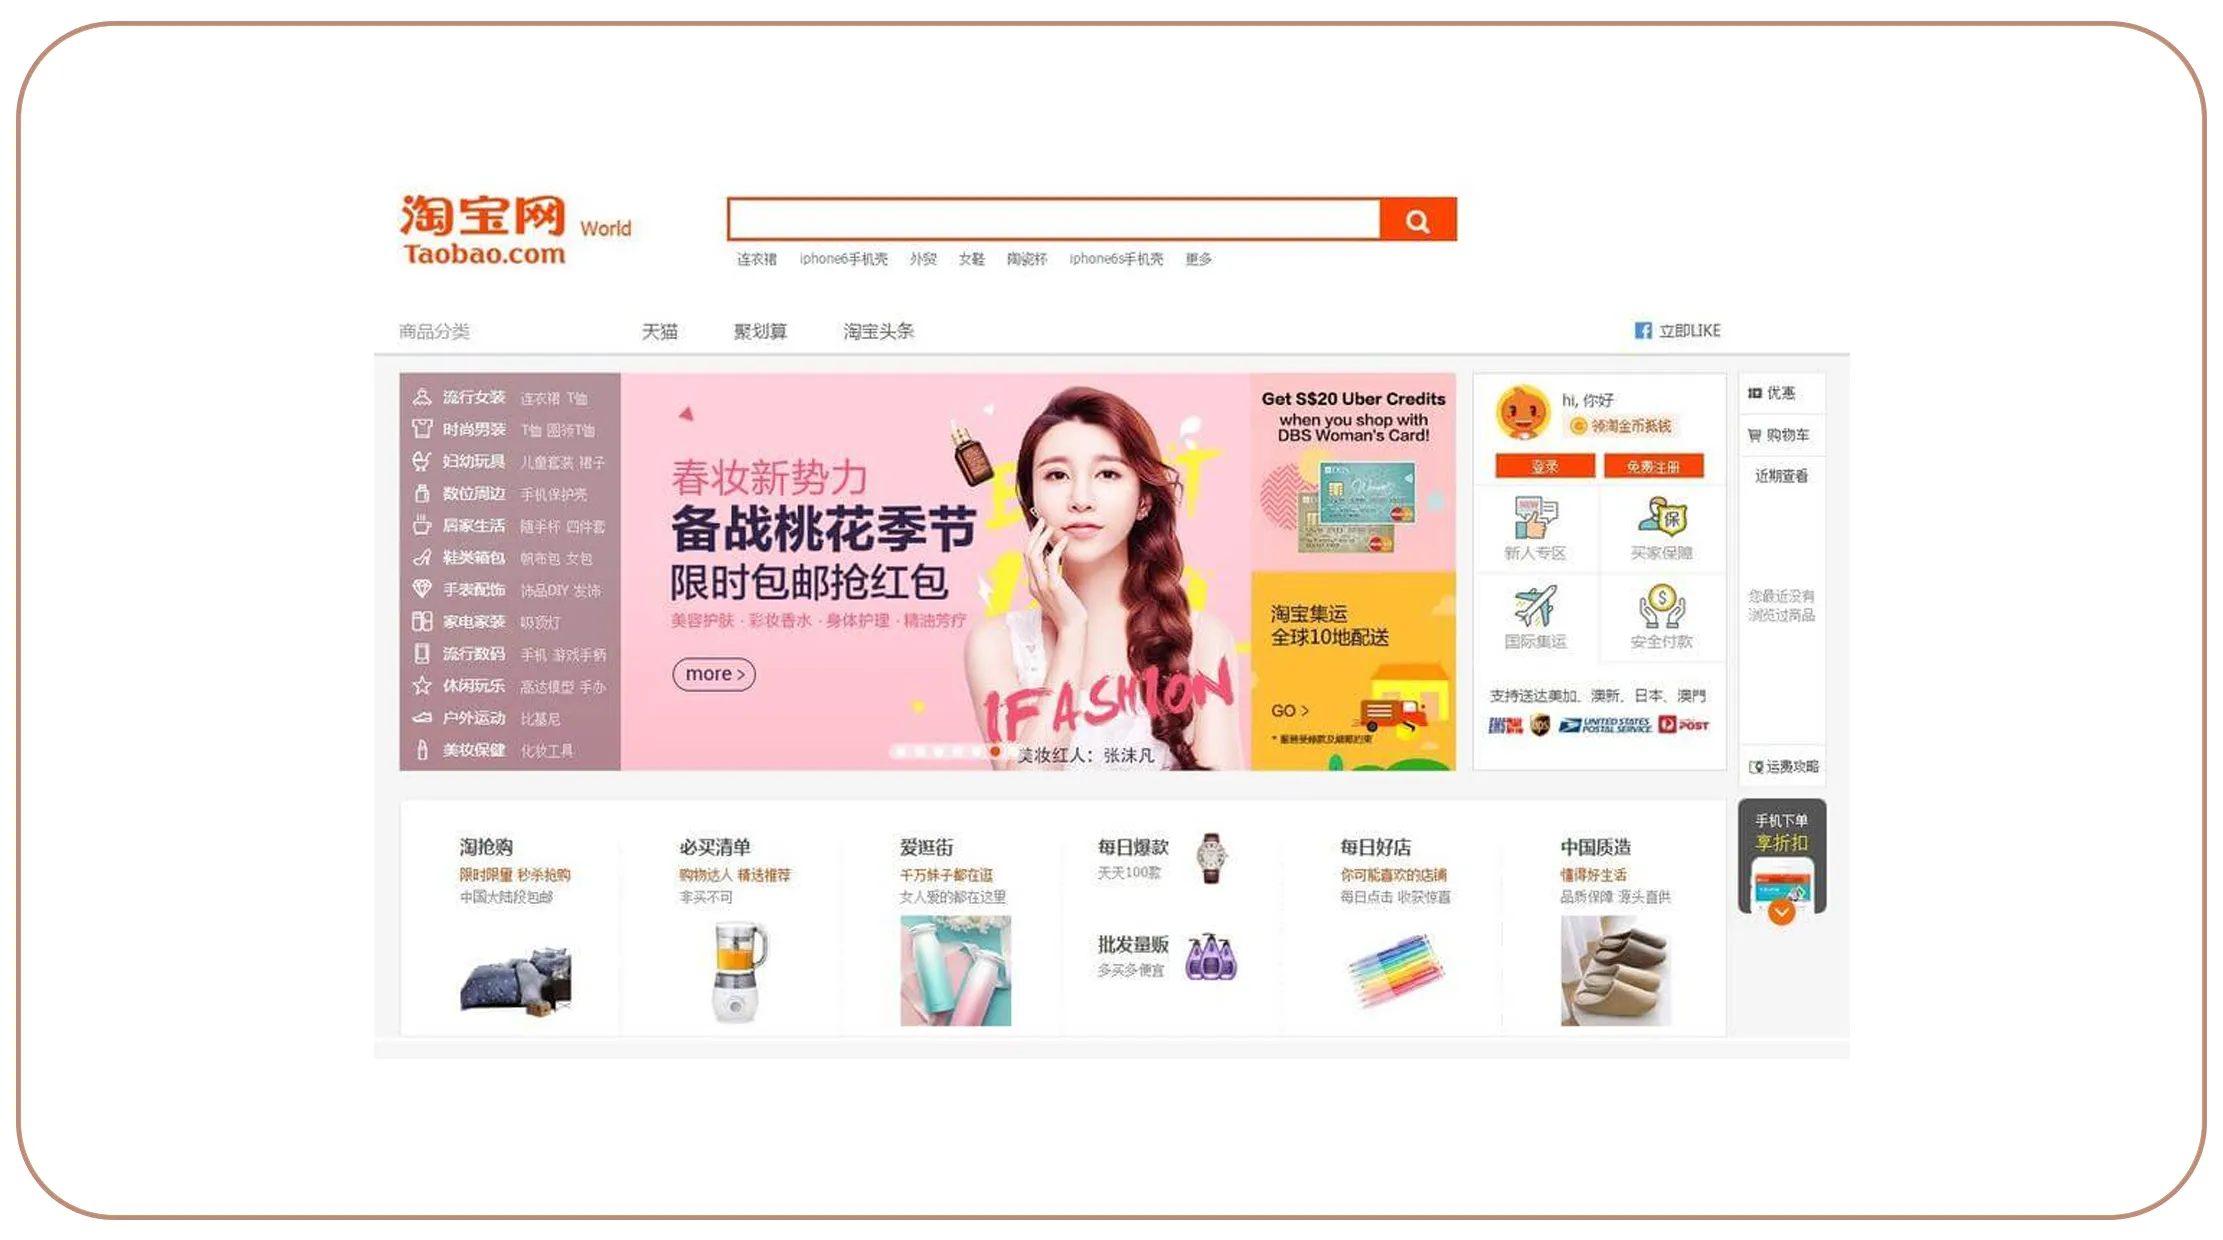
Businesses can build a structured catalog by collecting product-level information from relevant marketplace pages and organizing it into standardized fields. Extract product listings from Taobao workflows can capture information such as product titles, categories, prices, discounts, product IDs, seller names, ratings, reviews, images, availability signals, and other publicly available attributes.
The first step is defining the required fields. A retailer interested in pricing may prioritize product ID, current price, original price, discount, seller, and collection timestamp. A market researcher may need categories, product descriptions, ratings, reviews, and seller information.
The second step is normalization. Different listings may use different naming conventions. Standardizing product names and categories makes comparison easier. Duplicate listings should also be identified before analysis.
The third step is timestamping. Every collection should have a date and time. This creates a historical record that can show how products change.
What Product Fields Can Be Collected?
- Product ID.
- Product title.
- Product category.
- Brand.
- Seller name.
- Current price.
- Original price.
- Discount.
- Ratings.
- Review counts.
- Availability indicators.
- Product URL.
- Collection timestamp.
Illustrative Collection Growth
| Year | Example Listings Monitored* | Main Objective |
|---|---|---|
| 2020 | 10,000 | Product discovery |
| 2021 | 20,000 | Catalog comparison |
| 2022 | 35,000 | Seller monitoring |
| 2023 | 50,000 | Price analysis |
| 2024 | 70,000 | Inventory tracking |
| 2025* | 90,000 | Competitive intelligence |
| 2026* | 100,000 | Continuous monitoring |
*Illustrative dataset volumes, not official Taobao statistics.
A structured catalog can also support product matching. Businesses can group similar products by title, brand, category, specifications, or other attributes. This makes competitor comparisons more accurate.
For example, comparing two smartphones only by title can produce misleading results if one listing represents a different storage configuration. Product attributes provide the context needed for meaningful comparisons.
Historical product records also help identify new listings and discontinued products. A retailer can compare today's catalog with previous snapshots and identify products that entered or left the marketplace.
This creates a stronger foundation for pricing, inventory, assortment, and competitive analysis.
How Can Companies Track Marketplace Price Changes Faster?
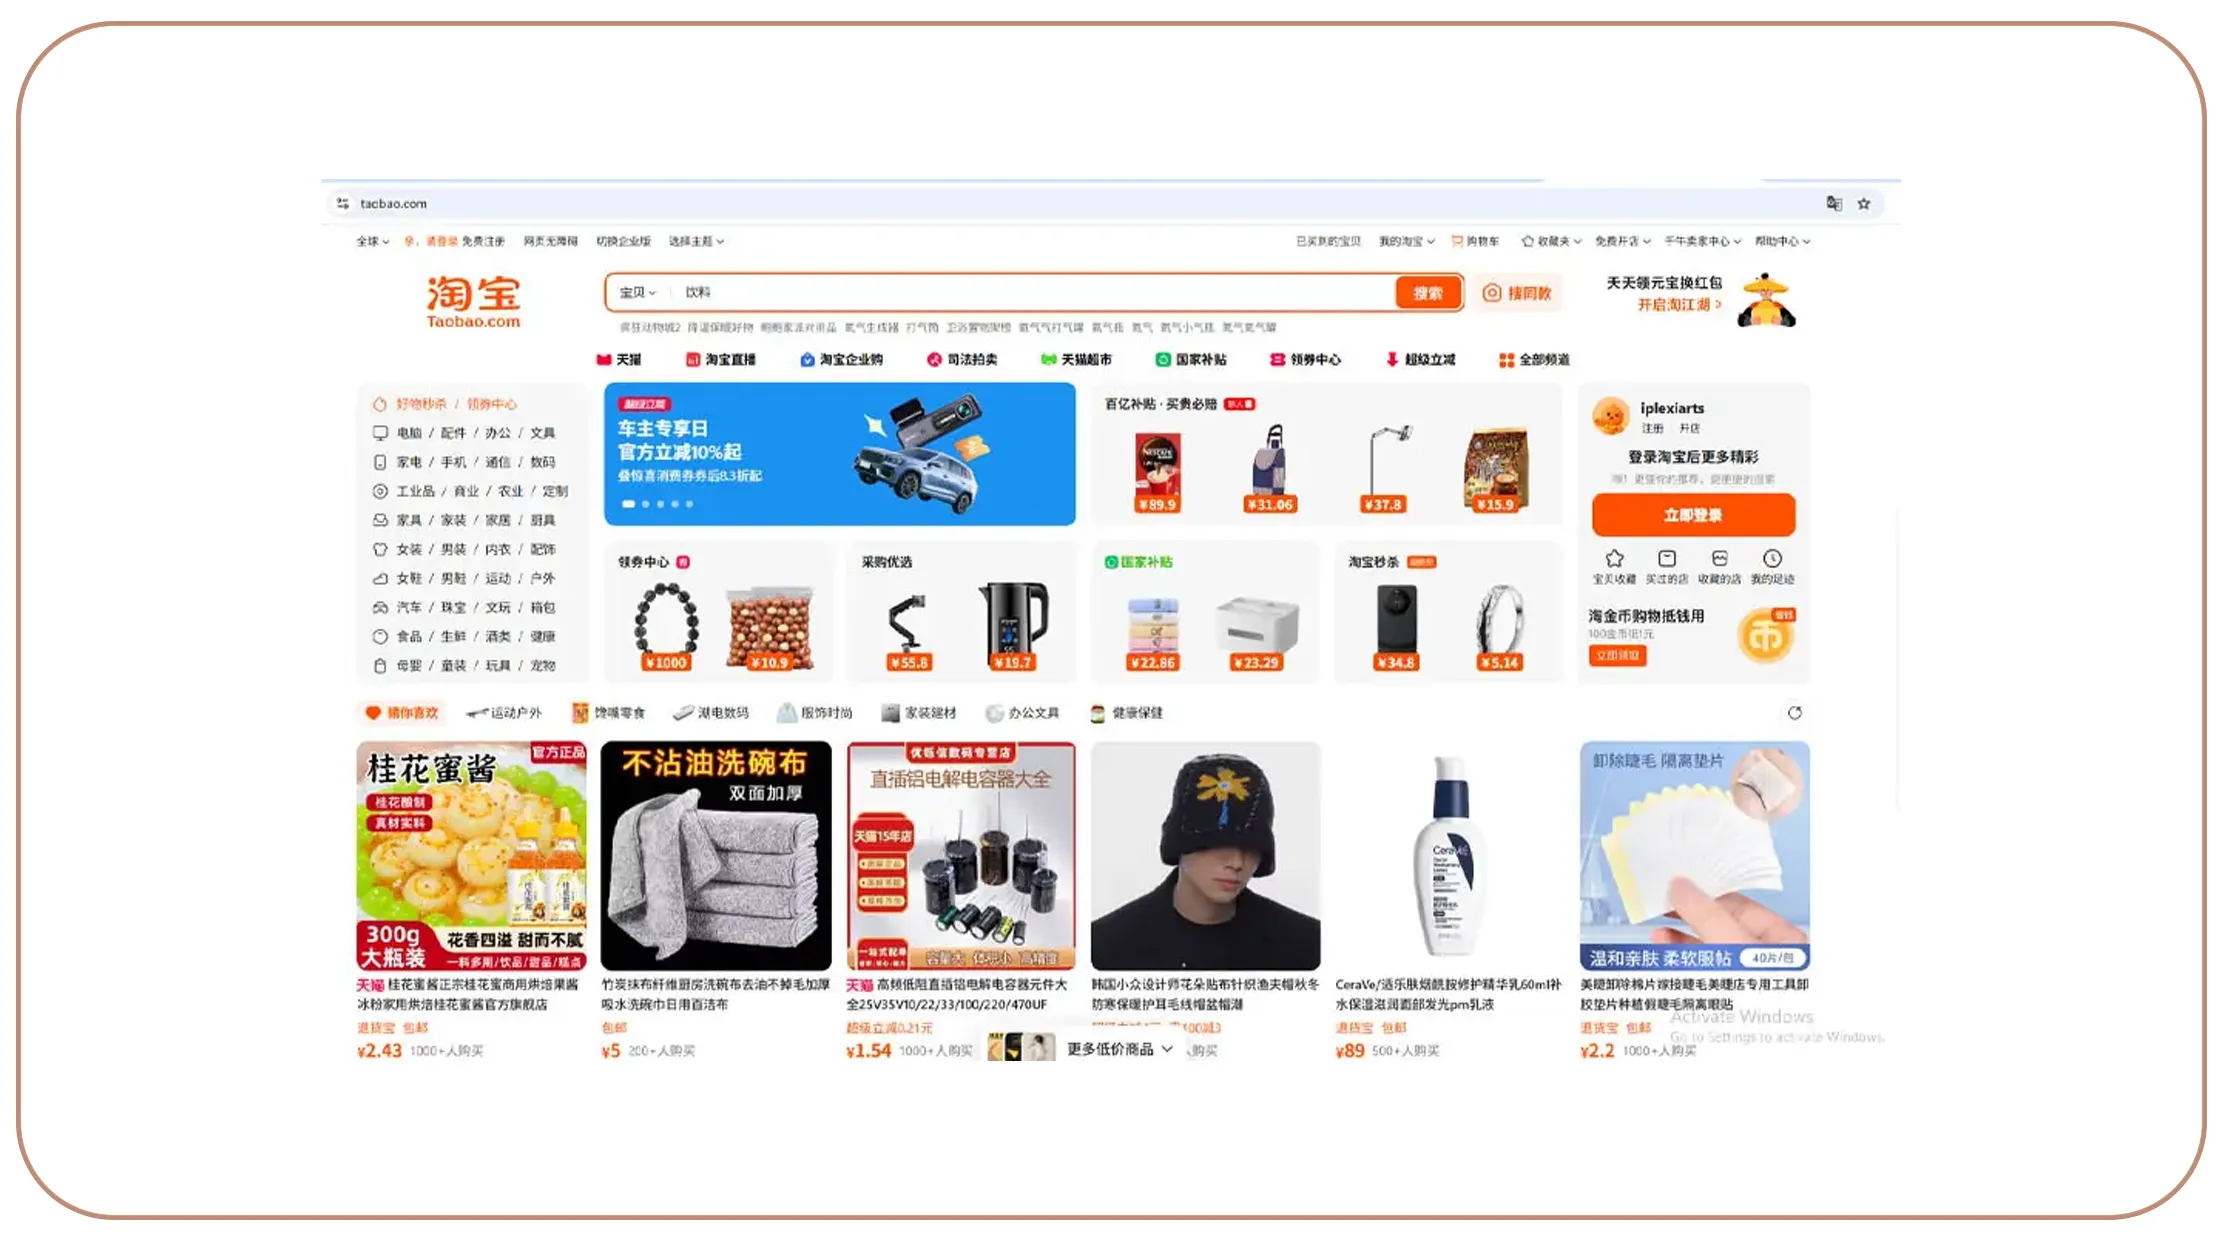
Price monitoring becomes difficult when thousands of products change frequently. Monitor Taobao product prices in real time workflows can help businesses identify price movements and compare competitor positions more efficiently.
Real-time monitoring should be understood according to the refresh frequency and technical architecture used. A system that collects data every hour is not the same as a system that receives an instant event notification. Businesses should define the required refresh interval based on their use case.
A pricing workflow can record the current price, previous price, discount, promotional price, seller, and timestamp. Comparing consecutive observations makes price changes easier to detect.
Which Pricing Signals Matter?
- Current selling price.
- Previous selling price.
- Original price.
- Discount percentage.
- Promotional price.
- Seller-specific price.
- Product availability.
- Collection timestamp.
- Price-change frequency.
Illustrative Price Monitoring Scale
| Year | Example Products* | Refresh Frequency | Primary Use |
|---|---|---|---|
| 2020 | 10,000 | Weekly | Basic benchmarking |
| 2021 | 20,000 | Daily | Competitor tracking |
| 2022 | 35,000 | Daily | Price comparison |
| 2023 | 50,000 | 12-hour | Dynamic monitoring |
| 2024 | 70,000 | 6-hour | Promotion tracking |
| 2025* | 90,000 | Hourly | Competitive pricing |
| 2026* | 100,000 | Configurable | Advanced monitoring |
*Illustrative figures.
A retailer can set thresholds for price changes. For example, a 10% decrease may trigger an alert for a specific product category. A sudden price increase may also require investigation.
Price history provides another advantage. A current price shows what a product costs today. Historical records show whether the price is stable, rising, falling, or changing around promotions.
Businesses can also calculate price indexes. A category-level index can compare current average prices against a selected historical baseline.
For example:
Price Index = Current Average Price ÷ Baseline Average Price × 100
An index above 100 indicates an increase compared with the baseline. An index below 100 indicates a decrease.
This information can support competitive pricing, promotion planning, assortment decisions, and margin analysis.
The objective is not to copy competitor prices blindly. The goal is to understand market movement and use that information alongside internal sales, inventory, and margin data.
How Can Businesses Compare Sellers and Product Performance?
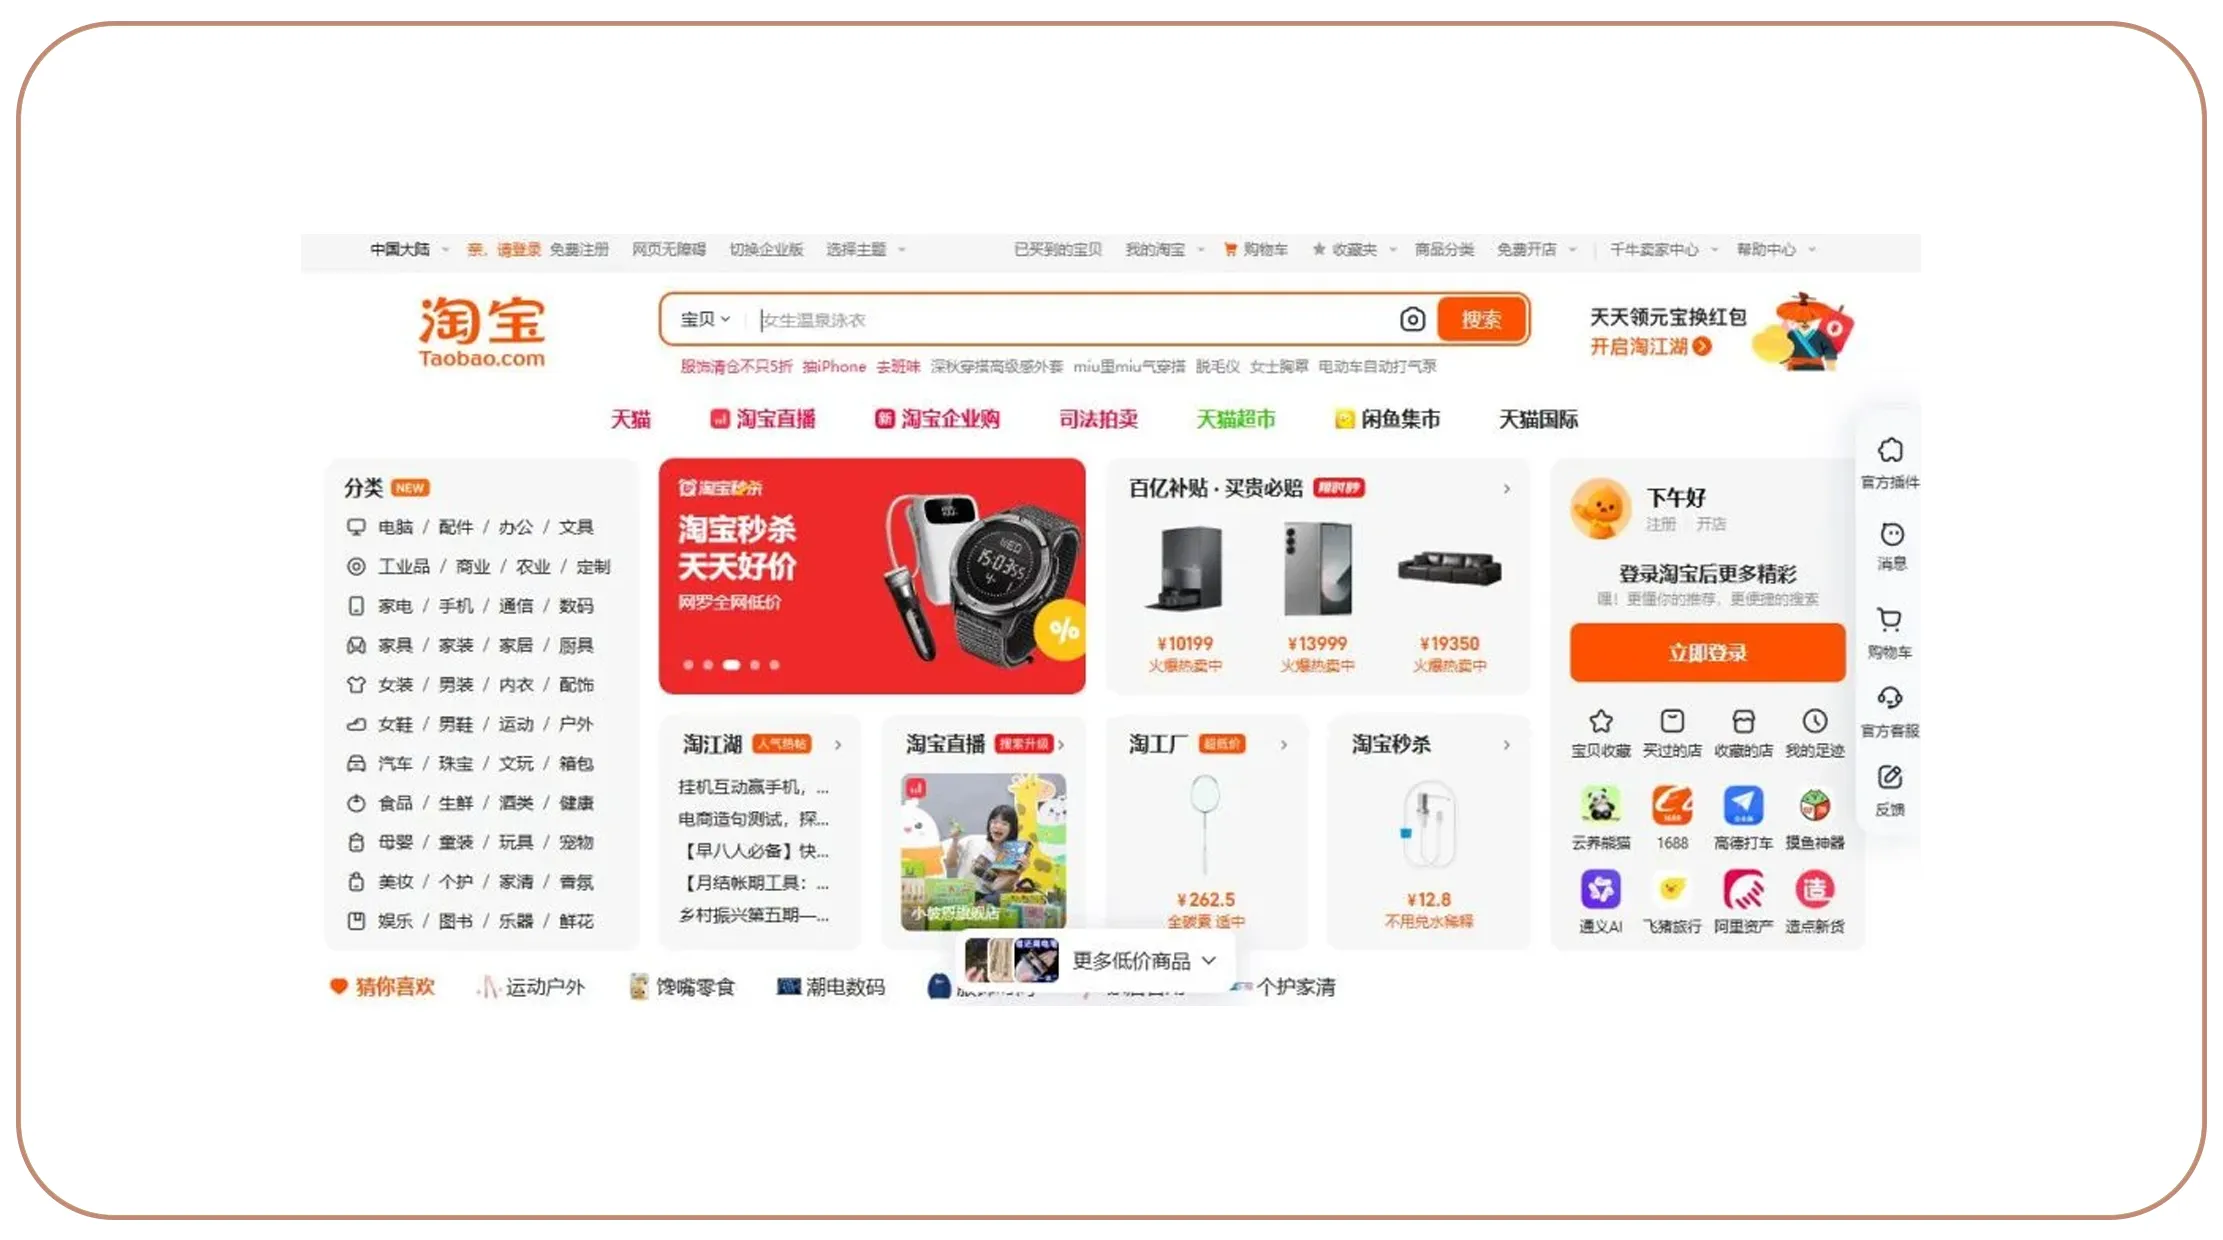
Seller analysis helps businesses understand who is competing for the same customers. Taobao seller and product data extraction can organize seller names, product listings, ratings, reviews, pricing, availability, and other publicly available marketplace signals into a structured dataset.
Seller-level analysis can reveal important differences between competing stores. One seller may offer lower prices. Another may have stronger ratings. A third may have a larger assortment.
These differences matter when evaluating competitive positioning.
What Seller Information Can Be Compared?
- Seller name.
- Number of relevant listings.
- Product categories.
- Product prices.
- Ratings.
- Review counts.
- Promotional activity.
- Product availability.
- Brand assortment.
- Listing frequency.
Illustrative Seller Monitoring
| Year | Sellers Tracked* | Product Comparison | Business Use |
|---|---|---|---|
| 2020 | 500 | Basic | Seller discovery |
| 2021 | 1,000 | Category-level | Benchmarking |
| 2022 | 2,000 | Product-level | Pricing research |
| 2023 | 3,500 | Multi-category | Competitor analysis |
| 2024 | 5,000 | Historical | Market intelligence |
| 2025* | 7,500 | Continuous | Seller monitoring |
| 2026* | 10,000 | Automated | Competitive research |
*Illustrative monitoring volumes.
Seller data becomes more useful when combined with product-level information. For example, analysts can identify sellers offering the same product and compare their prices.
A seller scorecard can also combine multiple indicators:
- Price competitiveness.
- Rating quality.
- Review volume.
- Assortment breadth.
- Product availability.
- Promotional activity.
Businesses should avoid treating any single metric as a complete measure of seller quality. A low price may attract customers, but poor ratings may indicate service or product concerns.
Historical seller data can also identify competitive changes. A seller may suddenly expand into a new category. Another may reduce its assortment. These movements can signal strategic changes worth investigating.
For brands, this information can support marketplace expansion decisions. For retailers, it can support competitor benchmarking. For research teams, it can reveal changes in marketplace structure.
A structured seller dataset turns individual marketplace listings into a broader competitive picture.
How Can an API-Based Workflow Scale E-Commerce Monitoring?
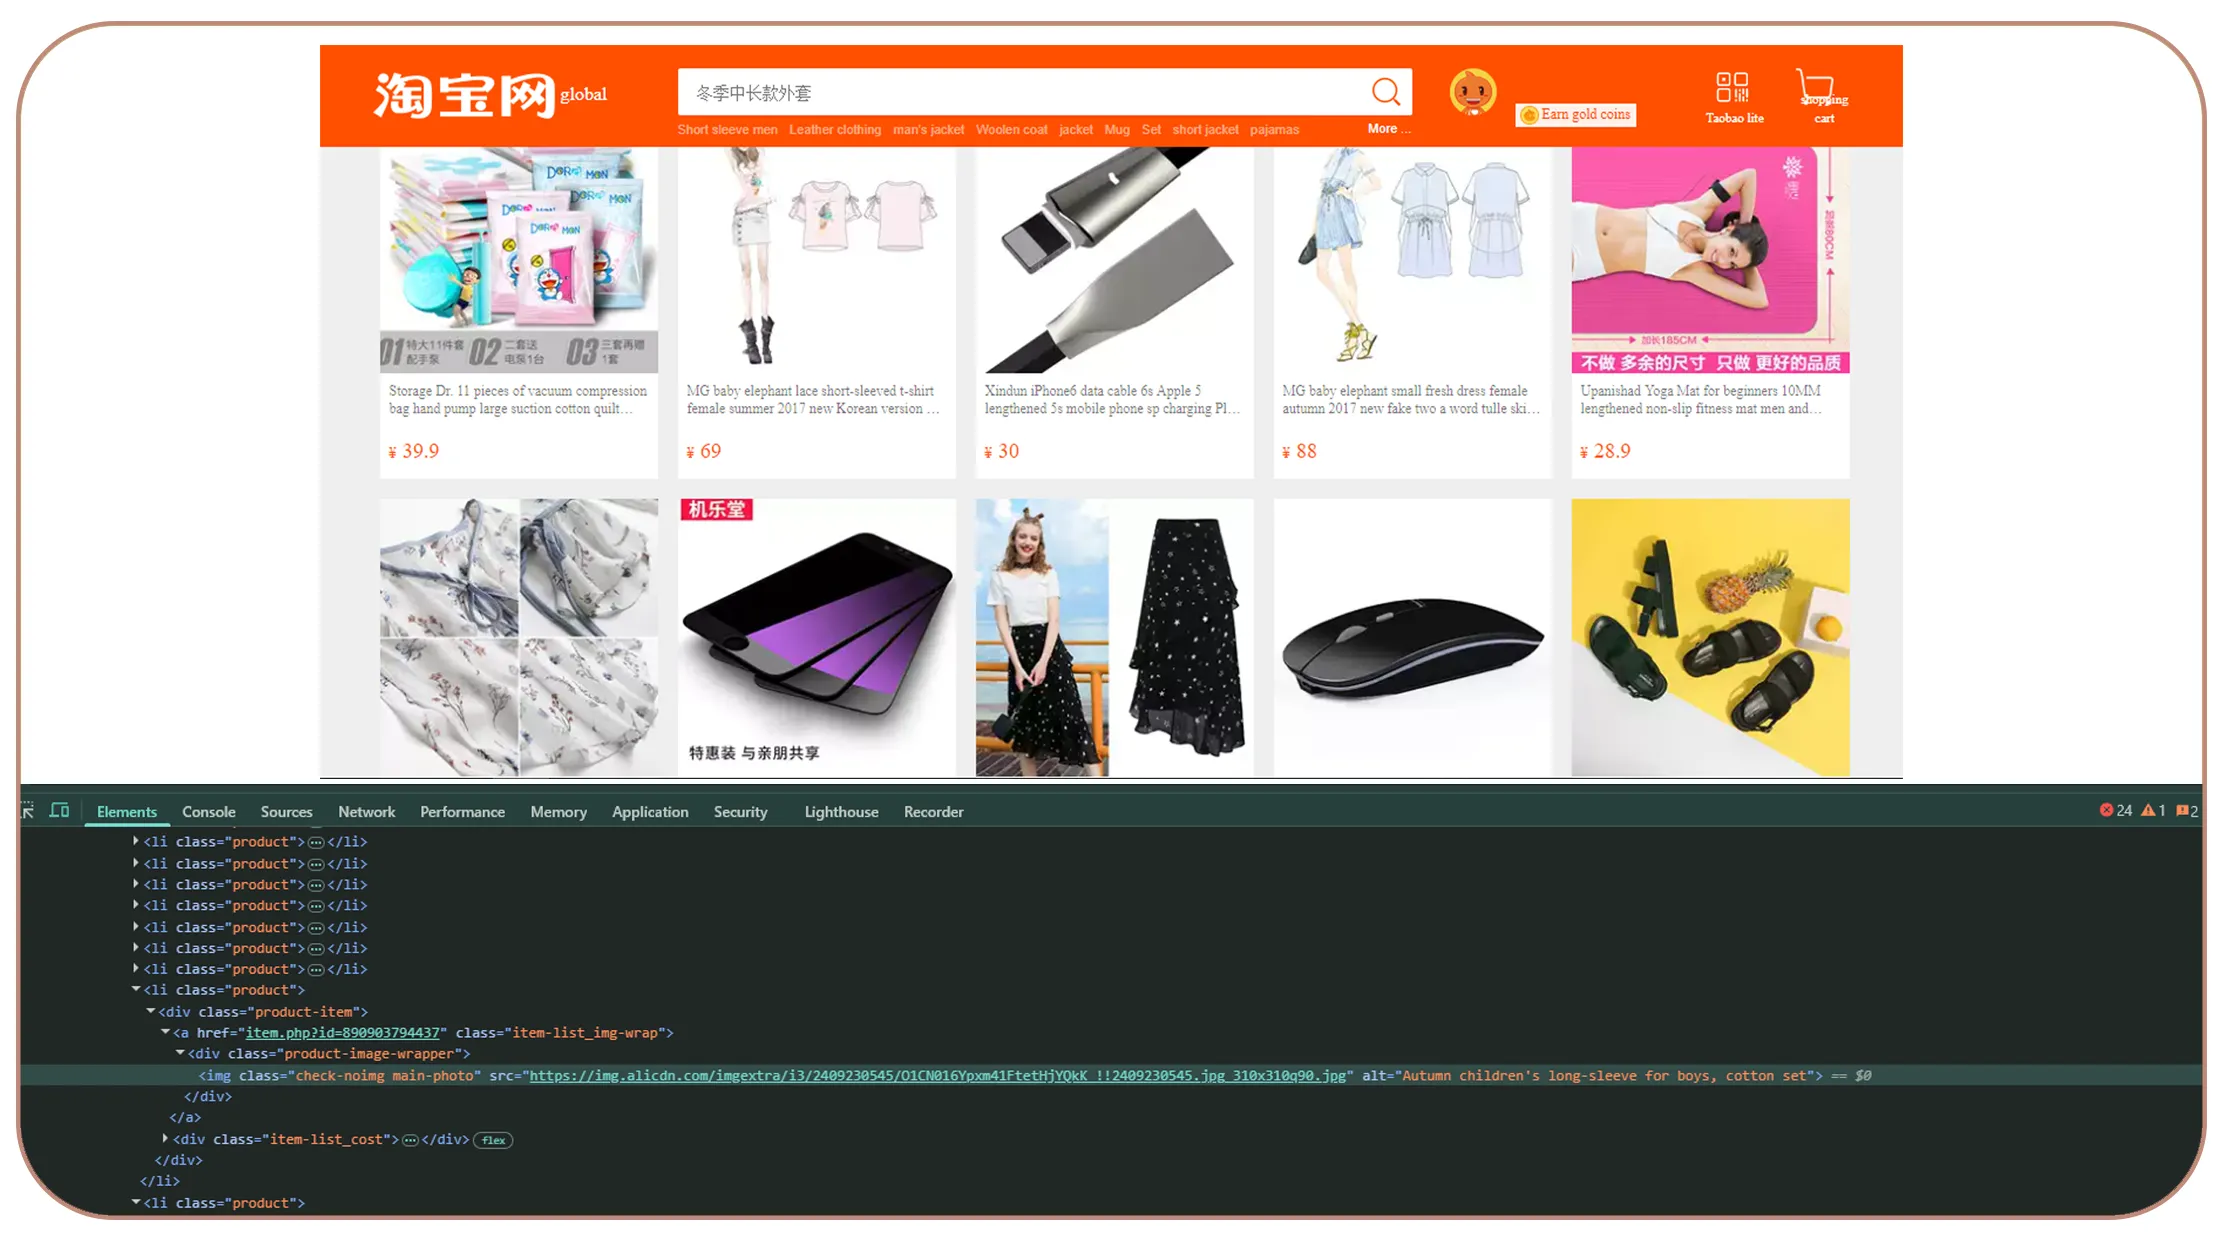
Large e-commerce datasets require more than one-time extraction. An E-Commerce Data Scraping API can provide a structured way to connect marketplace information with internal systems, databases, dashboards, analytics platforms, or research applications.
An API-based architecture can separate data collection from data consumption. Collection workflows gather permitted information. Processing workflows clean and normalize it. The API then delivers structured results to approved business applications.
What Does a Scalable Workflow Include?
- Source discovery.
- Data collection.
- Validation.
- Normalization.
- Duplicate detection.
- Timestamping.
- Storage.
- API delivery.
- Monitoring.
- Analytics integration.
This structure is useful when several teams need the same information. A pricing team may need current prices. A research team may need historical product records. A merchandising team may need assortment information.
Instead of building separate data collection systems for each department, a centralized pipeline can supply structured datasets to multiple applications.
Illustrative API Growth
| Year | Example API Records* | Primary Capability |
|---|---|---|
| 2020 | 1M | Basic extraction |
| 2021 | 3M | Structured delivery |
| 2022 | 8M | Scheduled collection |
| 2023 | 15M | Multi-source workflows |
| 2024 | 25M | Dashboard integration |
| 2025* | 40M | High-volume monitoring |
| 2026* | 60M | Scalable intelligence |
*Illustrative record volumes.
Validation is critical at this stage. Raw marketplace data may contain missing values, duplicate listings, inconsistent formats, or temporary errors. Automated quality checks can flag these records before they reach business dashboards.
An API also makes integration easier. Data can feed a business intelligence platform, warehouse, pricing engine, CRM, or internal application.
Security and access controls should also be considered. Businesses should protect stored data and limit access according to internal policies.
The strongest architecture is therefore not simply an extraction tool. It is a complete data pipeline that can collect, validate, organize, deliver, and refresh marketplace information at the required scale.
How Can a Historical Dataset Improve Marketplace Decisions?
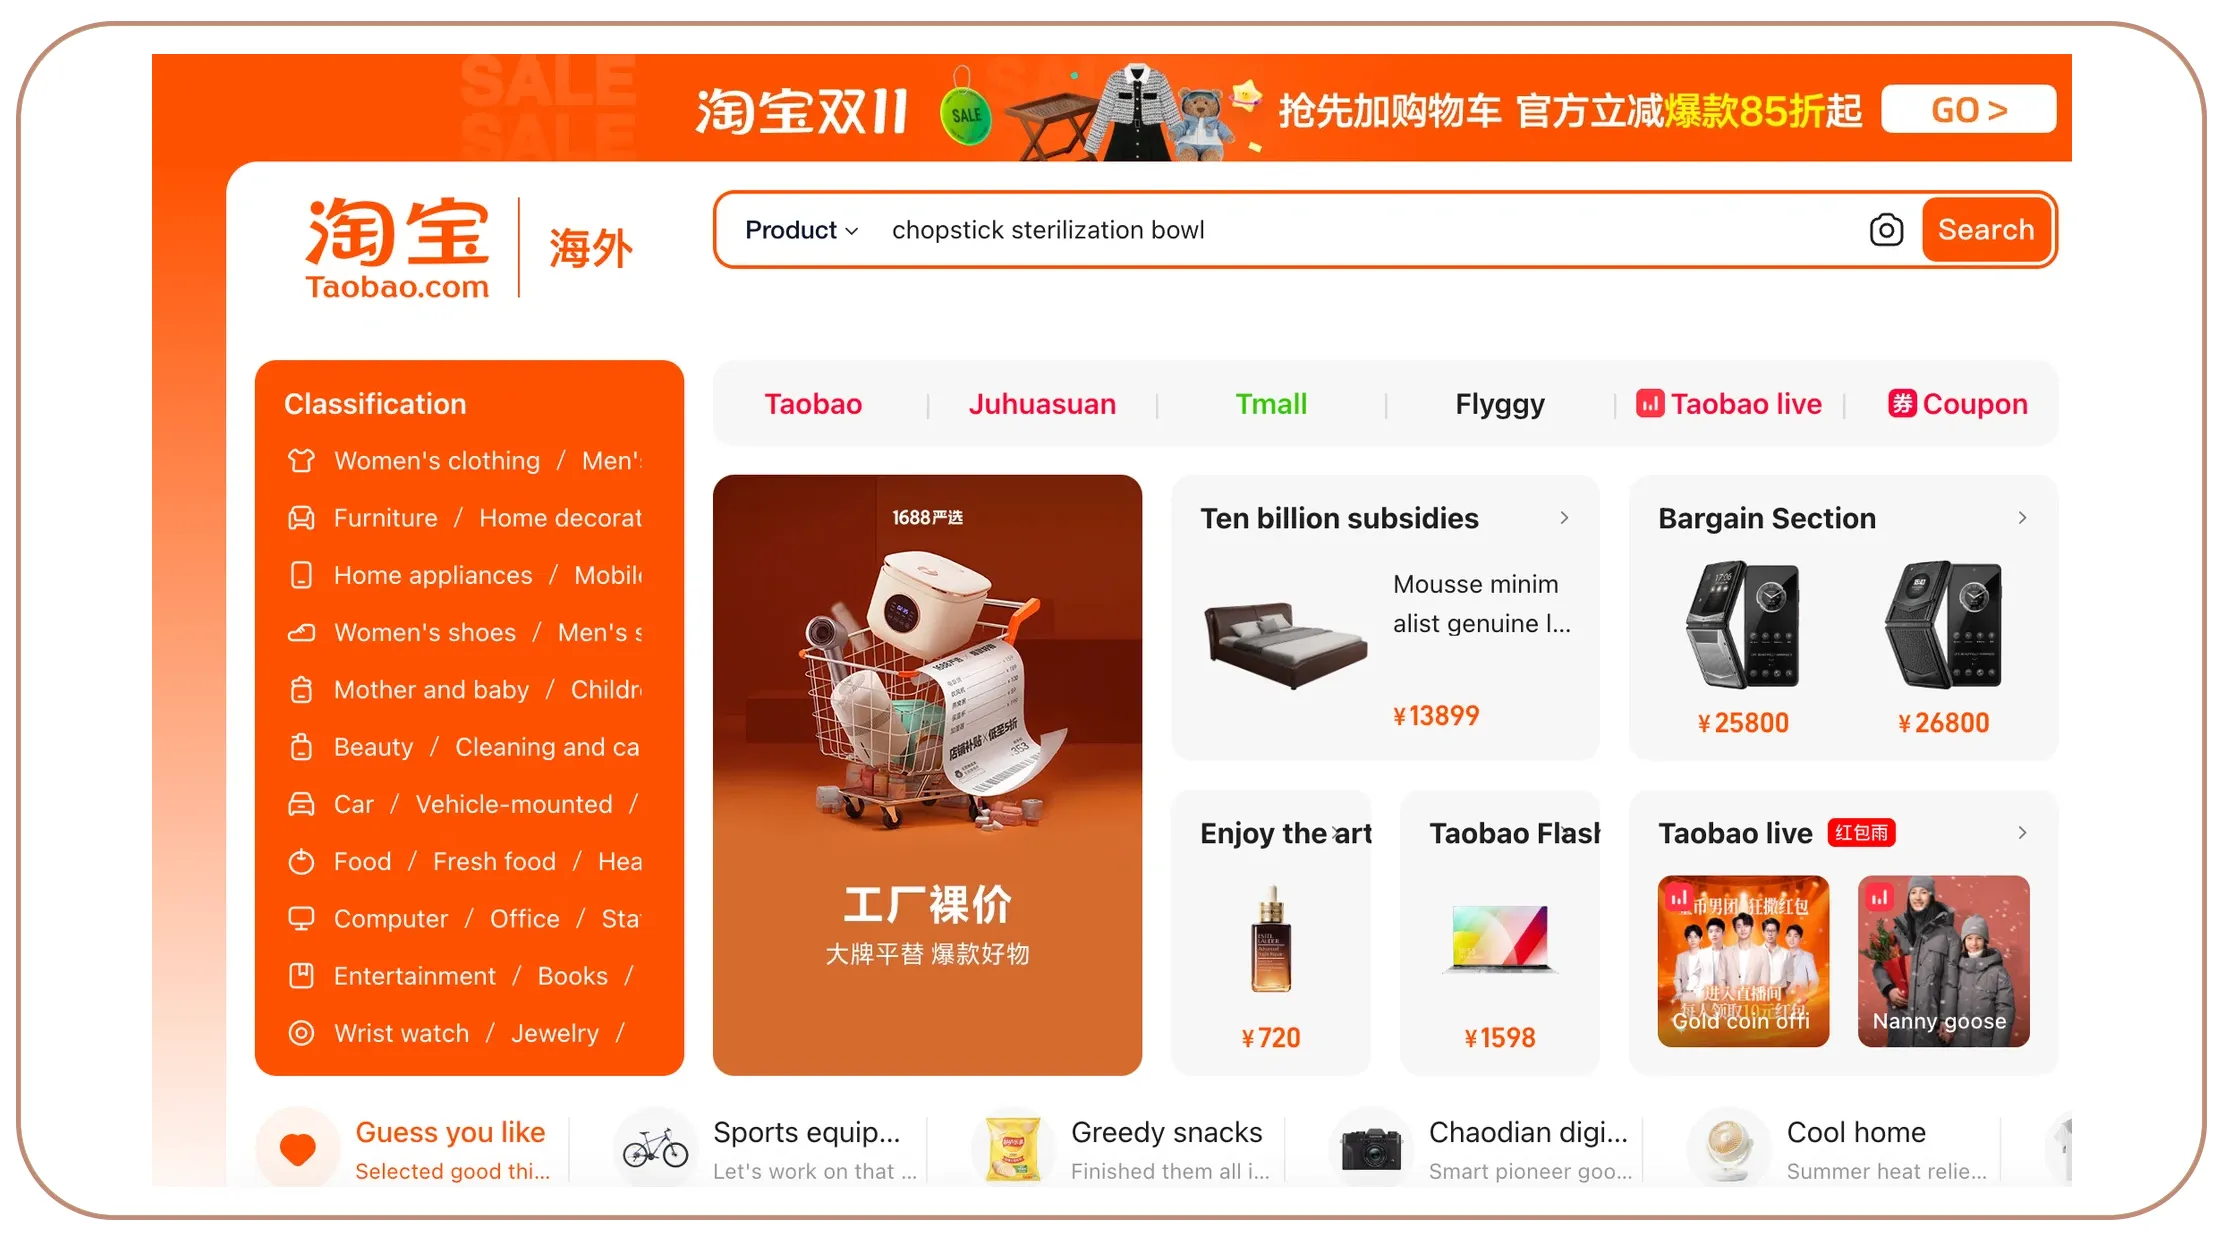
A reliable E-Commerce Dataset allows businesses to analyze marketplace changes over time instead of relying only on current listings. Historical data can contain product, price, seller, rating, availability, and promotional observations captured at different points.
This historical layer is important for identifying trends. A product that appears popular today may have experienced declining interest for several months. Another product with fewer listings may be growing quickly.
What Can Historical Data Reveal?
- Product launches.
- Product removals.
- Price changes.
- Seller expansion.
- Category growth.
- Promotional cycles.
- Availability changes.
- Rating trends.
- Assortment changes.
- Competitive movements.
Illustrative Historical Dataset
| Year | Records Captured* | Key Analysis |
|---|---|---|
| 2020 | 1M | Baseline catalog |
| 2021 | 3M | Product growth |
| 2022 | 7M | Pricing trends |
| 2023 | 12M | Seller activity |
| 2024 | 20M | Category intelligence |
| 2025* | 32M | Competitive analysis |
| 2026* | 45M | Longitudinal monitoring |
*Illustrative figures.
Historical data can also support before-and-after analysis. Suppose a competitor launches a major promotion. Analysts can compare prices and availability before, during, and after the promotion.
Another useful approach is product lifecycle analysis. Products can be grouped according to their first appearance, price trajectory, availability, and marketplace activity.
For example:
Launch → Growth → Stable → Promotional → Decline → Removal
Not every product follows this exact pattern. However, historical records make these stages easier to study.
Businesses can also combine marketplace data with internal information. Internal sales data can show what customers purchased. Marketplace data can show what competitors offered. Together, these datasets can provide a broader view of market demand and competitive supply.
Historical datasets also improve reporting. Instead of asking, "What is the price today?" teams can ask, "How has this price changed over the past six months?"
That shift creates more useful business intelligence.
How Can Market Research Teams Use Marketplace Data?
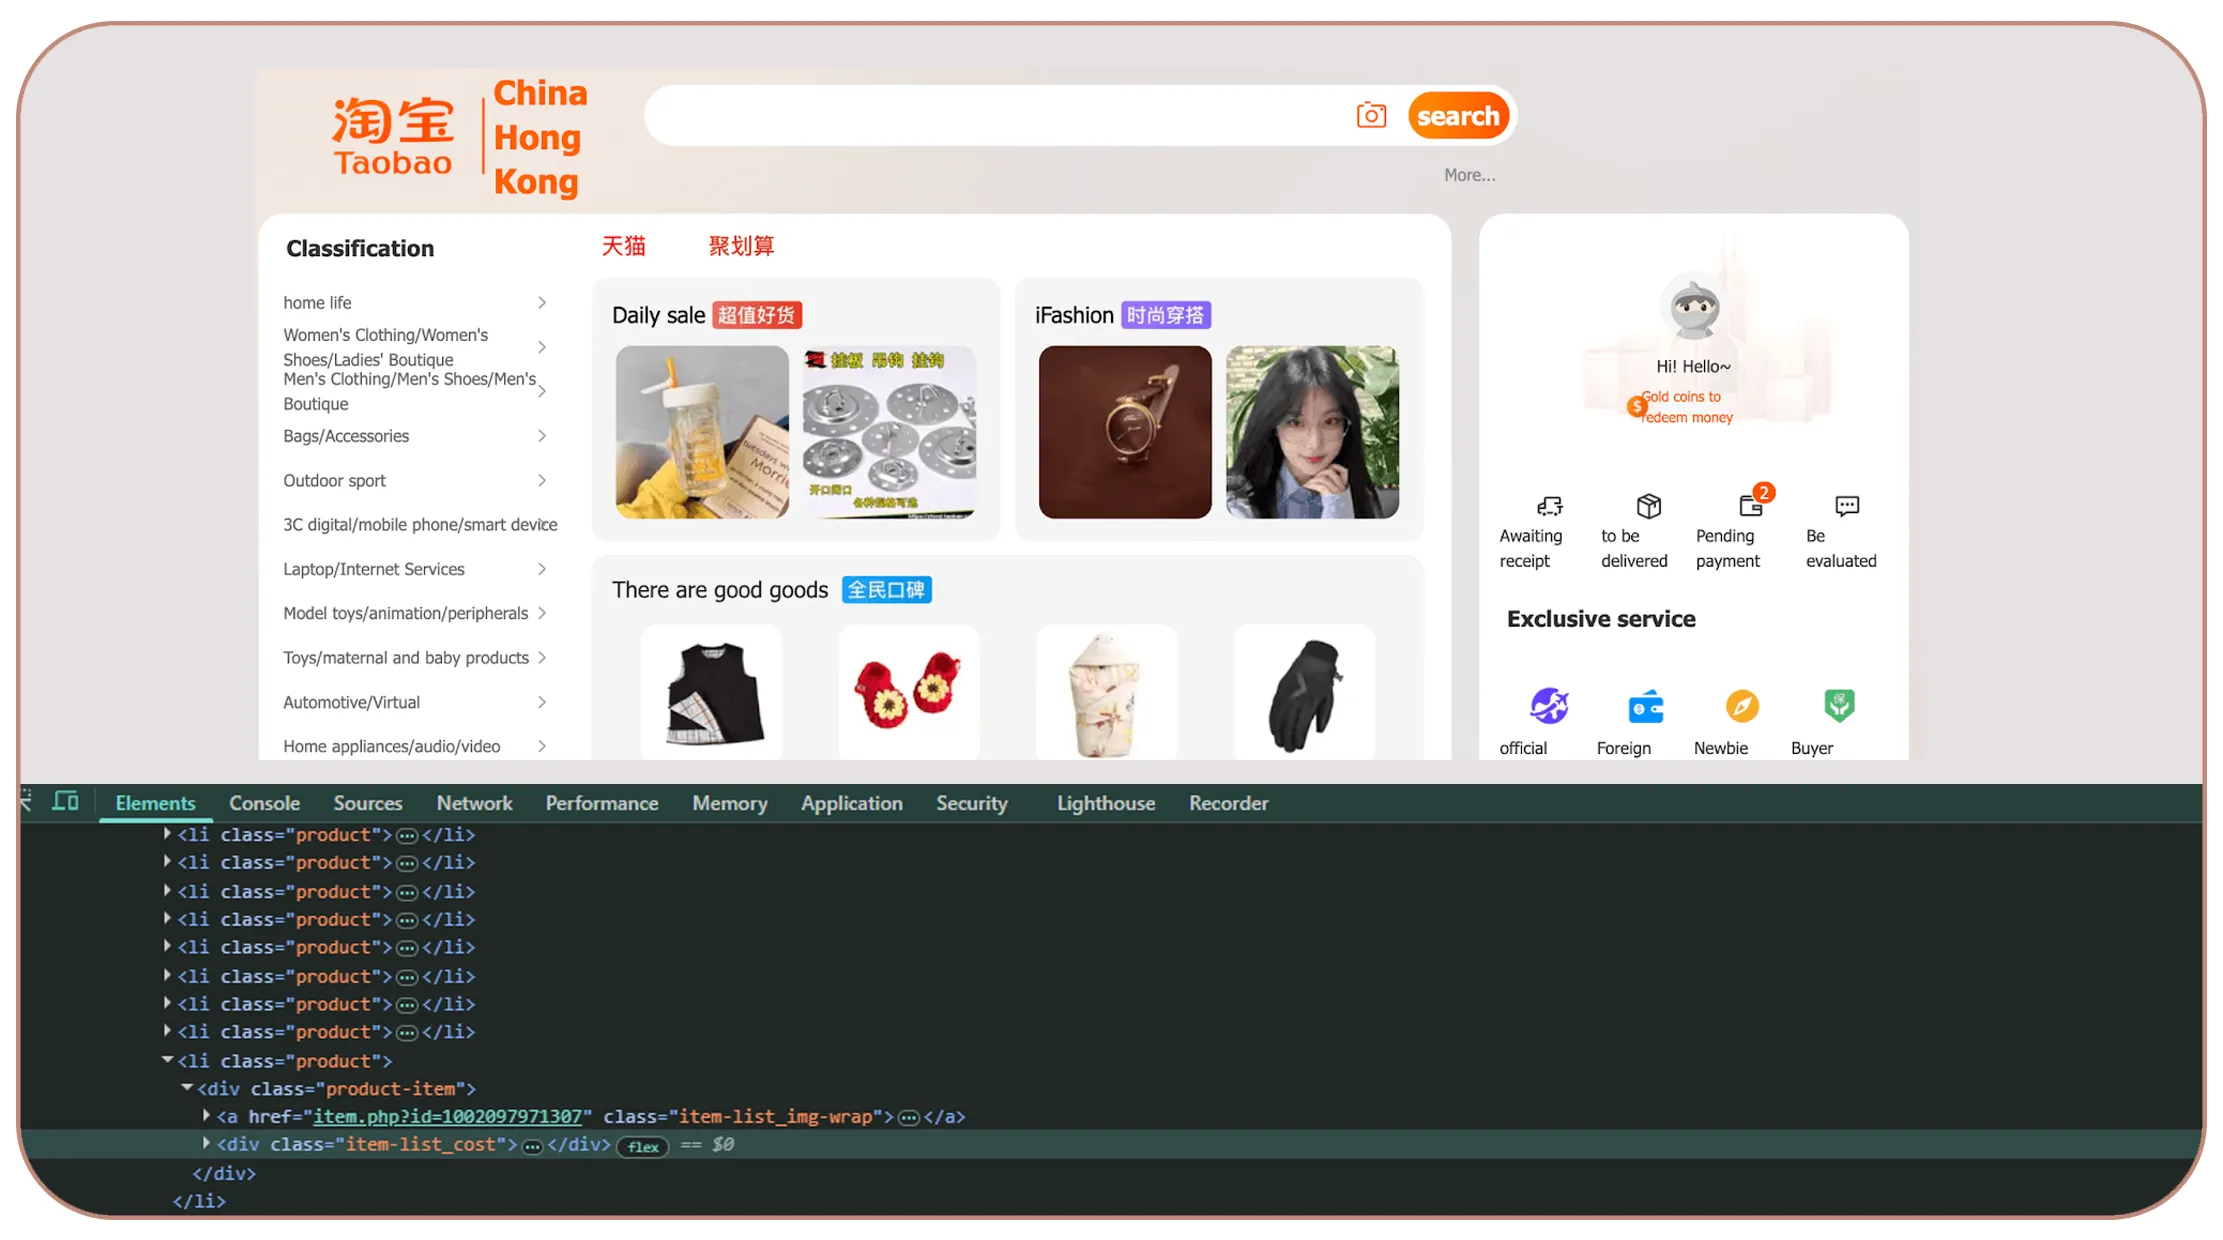
Market Research teams can use structured marketplace information to study pricing, assortment, sellers, product trends, and competitive positioning. The data can support both short-term decisions and long-term strategic research.
A market research workflow can begin with category discovery. Analysts identify important product categories and collect representative listings. They can then compare prices, seller activity, ratings, reviews, and assortment.
The next step is competitor benchmarking. Businesses can group comparable sellers and examine differences in product count, pricing, ratings, and promotional activity.
Which Research Questions Can the Data Answer?
- Which products are gaining visibility?
- Which categories are expanding?
- Which sellers offer competitive prices?
- How frequently do prices change?
- Which products have strong ratings?
- Which sellers are expanding assortment?
- Which categories show promotional activity?
- Which products appear repeatedly across sellers?
Illustrative Research Coverage
| Year | Categories Studied* | Research Focus |
|---|---|---|
| 2020 | 20 | Product discovery |
| 2021 | 35 | Pricing |
| 2022 | 50 | Seller comparison |
| 2023 | 75 | Product trends |
| 2024 | 100 | Competitive analysis |
| 2025* | 130 | Market opportunities |
| 2026* | 160 | Continuous intelligence |
*Illustrative research scope.
Researchers can create category-level price distributions. They can calculate minimum, maximum, median, and average prices. Median prices are often useful when extreme values could distort an average.
Review and rating information can also add qualitative context. A product with a high rating and large review volume may have stronger customer validation than a newly listed product with very few reviews.
Market research teams can further identify assortment gaps. If competitors offer products within a category that a retailer does not carry, the gap can become a research opportunity.
However, marketplace data should not be treated as a direct measure of total market demand. It represents observable marketplace activity. Analysts should combine it with other sources when making broader market-size or demand claims.
Why Choose Real Data API for Marketplace Intelligence?
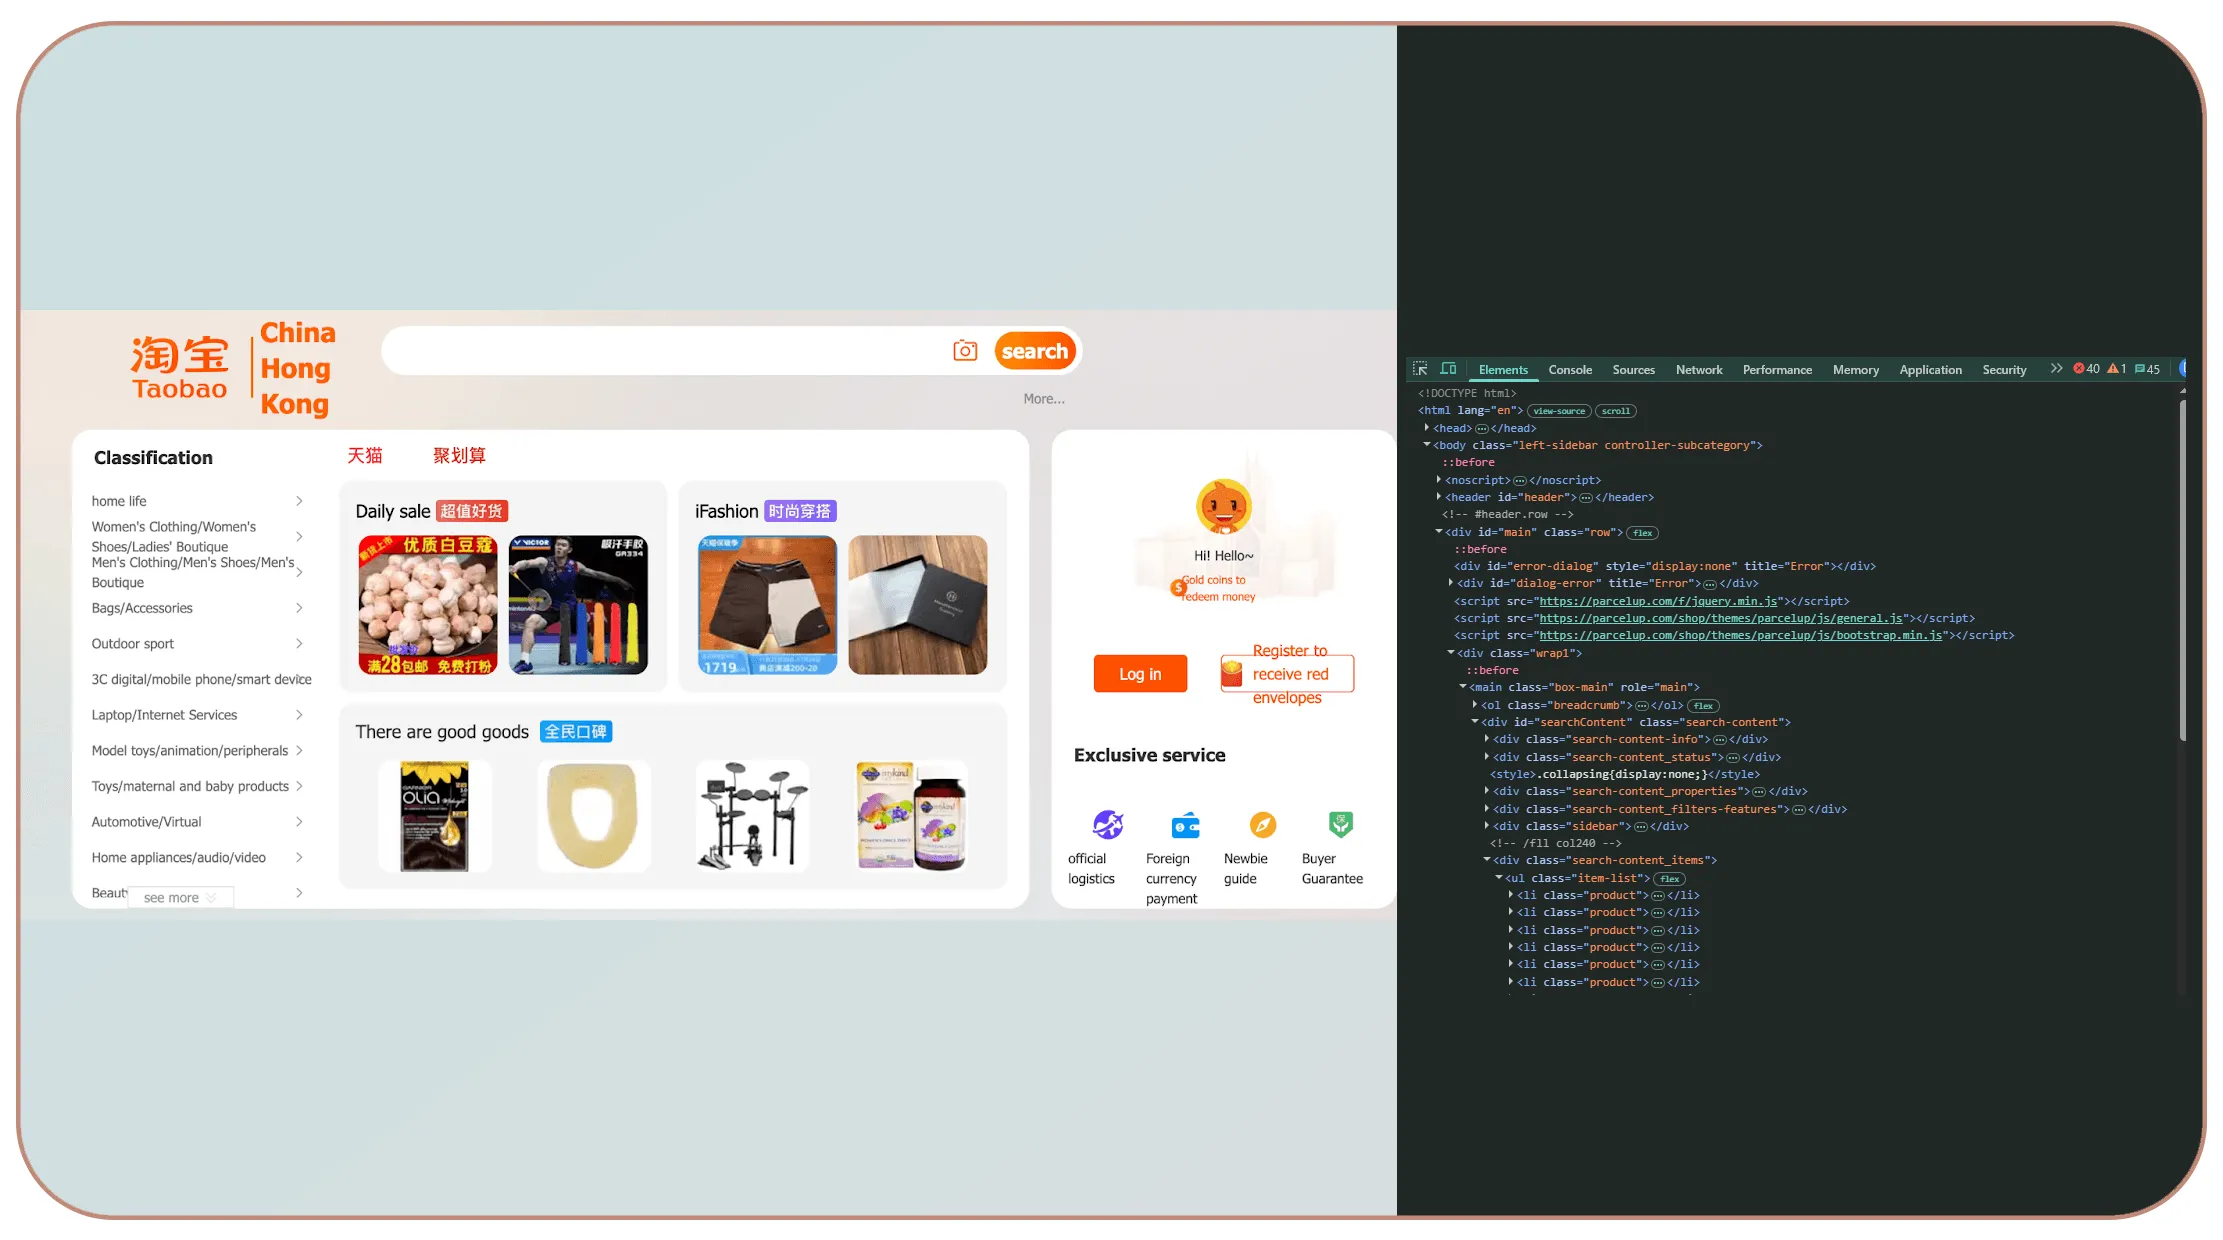
Real Data API helps businesses create scalable data workflows for product research, pricing intelligence, competitor monitoring, seller analysis, and marketplace research. scrape Taobao product data workflows can be designed around structured collection, normalization, validation, scheduled updates, and API-ready delivery.
A reliable marketplace data workflow should provide:
- Structured product information.
- Consistent data fields.
- Historical timestamps.
- Automated validation.
- Duplicate detection.
- Scheduled refreshes.
- Scalable processing.
- API-based delivery.
- Analytics-ready datasets.
- Integration support.
Real Data API can help businesses move beyond one-time product extraction. Continuous collection creates historical datasets that support trend analysis and competitive benchmarking.
Pricing teams can use structured records to monitor changes. Merchandising teams can evaluate assortment. Research teams can study categories and sellers. Data teams can integrate information into internal analytics systems.
The architecture can also scale as monitoring requirements grow. Businesses can begin with a focused product category and expand into multiple categories, sellers, or market segments.
Data quality remains central to the workflow. Normalization and validation help create consistent records. Timestamped observations help preserve historical context. Structured outputs make the information easier to consume across business systems.
Businesses should always ensure their collection practices follow applicable laws, marketplace terms, access restrictions, privacy requirements, and other relevant policies.
Conclusion
Taobao marketplace monitoring becomes more valuable when businesses collect structured information continuously instead of relying on occasional manual checks. Product listings reveal assortment. Price histories reveal market movement. Seller records reveal competition. Historical datasets reveal trends.
A scalable workflow can connect these signals into a single intelligence system. That system can support pricing analysis, inventory monitoring, competitor benchmarking, product research, seller comparison, and market intelligence.
The 2020-2026 framework above uses illustrative figures to show how data coverage can grow as monitoring programs mature. Actual volumes depend on product categories, refresh frequency, technical architecture, and business requirements.
For retailers, brands, marketplaces, pricing teams, and research organizations, scrape Taobao product data can provide the structured marketplace visibility needed for faster and more informed decisions.
Ready to turn Taobao marketplace activity into actionable e-commerce intelligence? Connect with Real Data API to build a scalable product, pricing, seller, and competitor monitoring workflow!
Latest posts
How Scrape Xiaohongshu Product Trends in Real Time Solves Product Discovery and Competitor Monitoring Challenges?
How to Scrape Taobao Product Data to Solve Pricing, Inventory, and Competitor Monitoring Challenges?
How to Extract grocery product listings Data from SPAR to Build Accurate Grocery Intelligence and Competitive Market Insights?
Scrape Douyin follower growth and engagement data to track influencer performance and trends






.png)



