Introduction
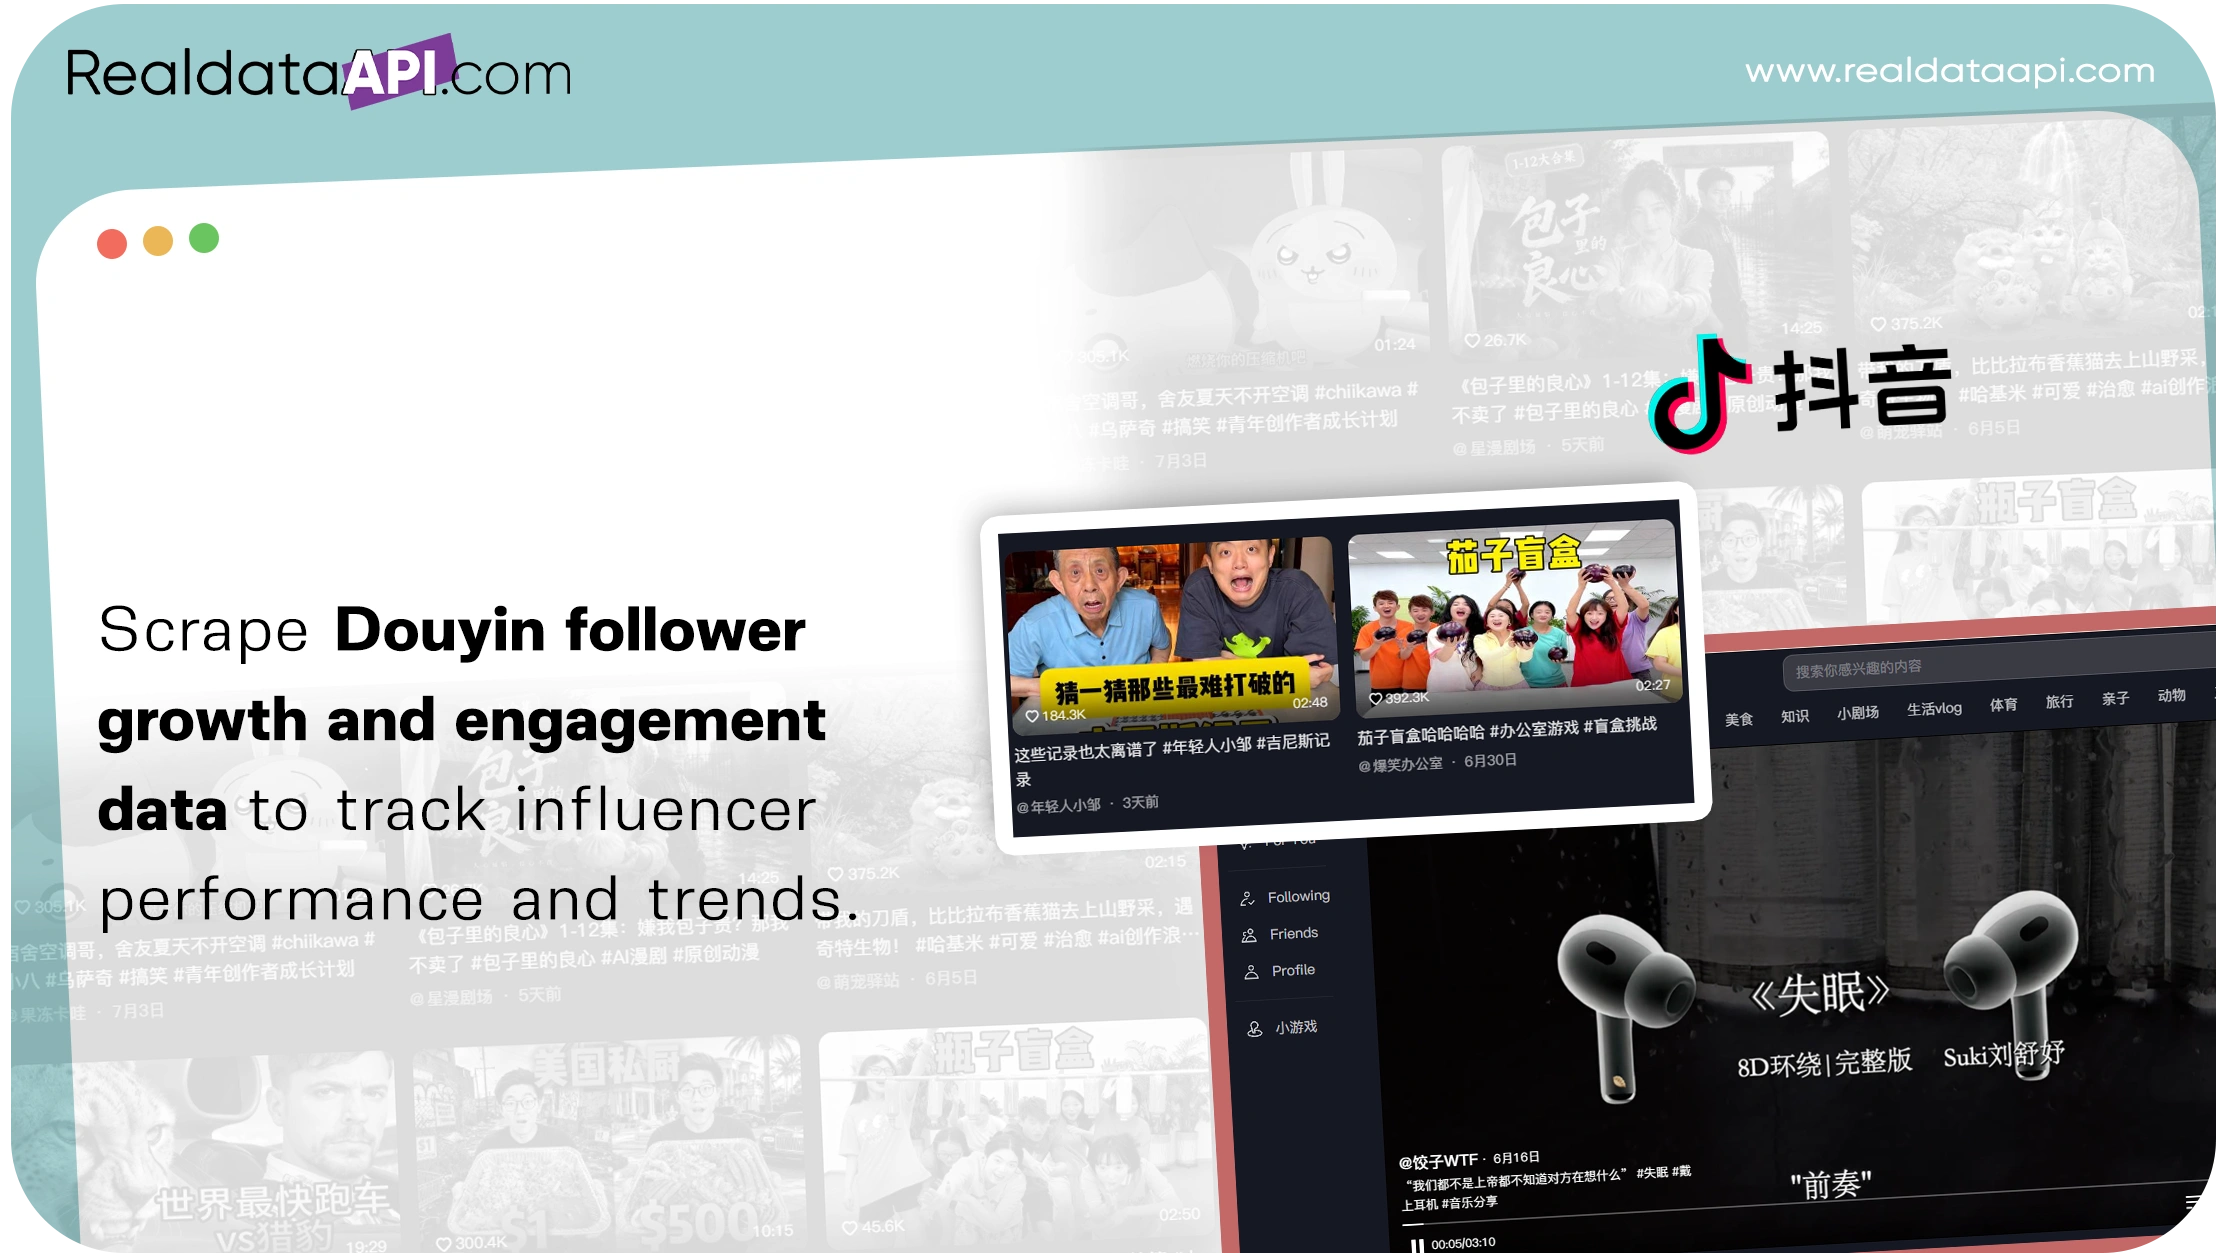
Brands can track influencer performance more accurately by collecting follower growth, likes, comments, shares, posting frequency, and content-level signals over time. web scraping Douyin follower growth and engagement data turns scattered public signals into structured datasets that help marketers compare creators, detect growth patterns, measure engagement, and improve campaign decisions.
A 2024 study analyzed 12,842 product-related short videos from 170 Douyin influencers and used follower counts plus likes, comments, and shares as key performance signals. Another study notes that Douyin combines social media with social commerce, making sales and conversion metrics important alongside engagement.
For brands, agencies, influencer platforms, and market researchers, the main challenge is not simply collecting numbers. It is building a consistent historical view that shows why an account grew, which content drove engagement, and whether growth remained sustainable.
The Douyin API can support structured access where applicable, while automated collection workflows can help organize publicly available information for compliant analytics and research.
How Can Brands Build Reliable Douyin Creator Profiles?
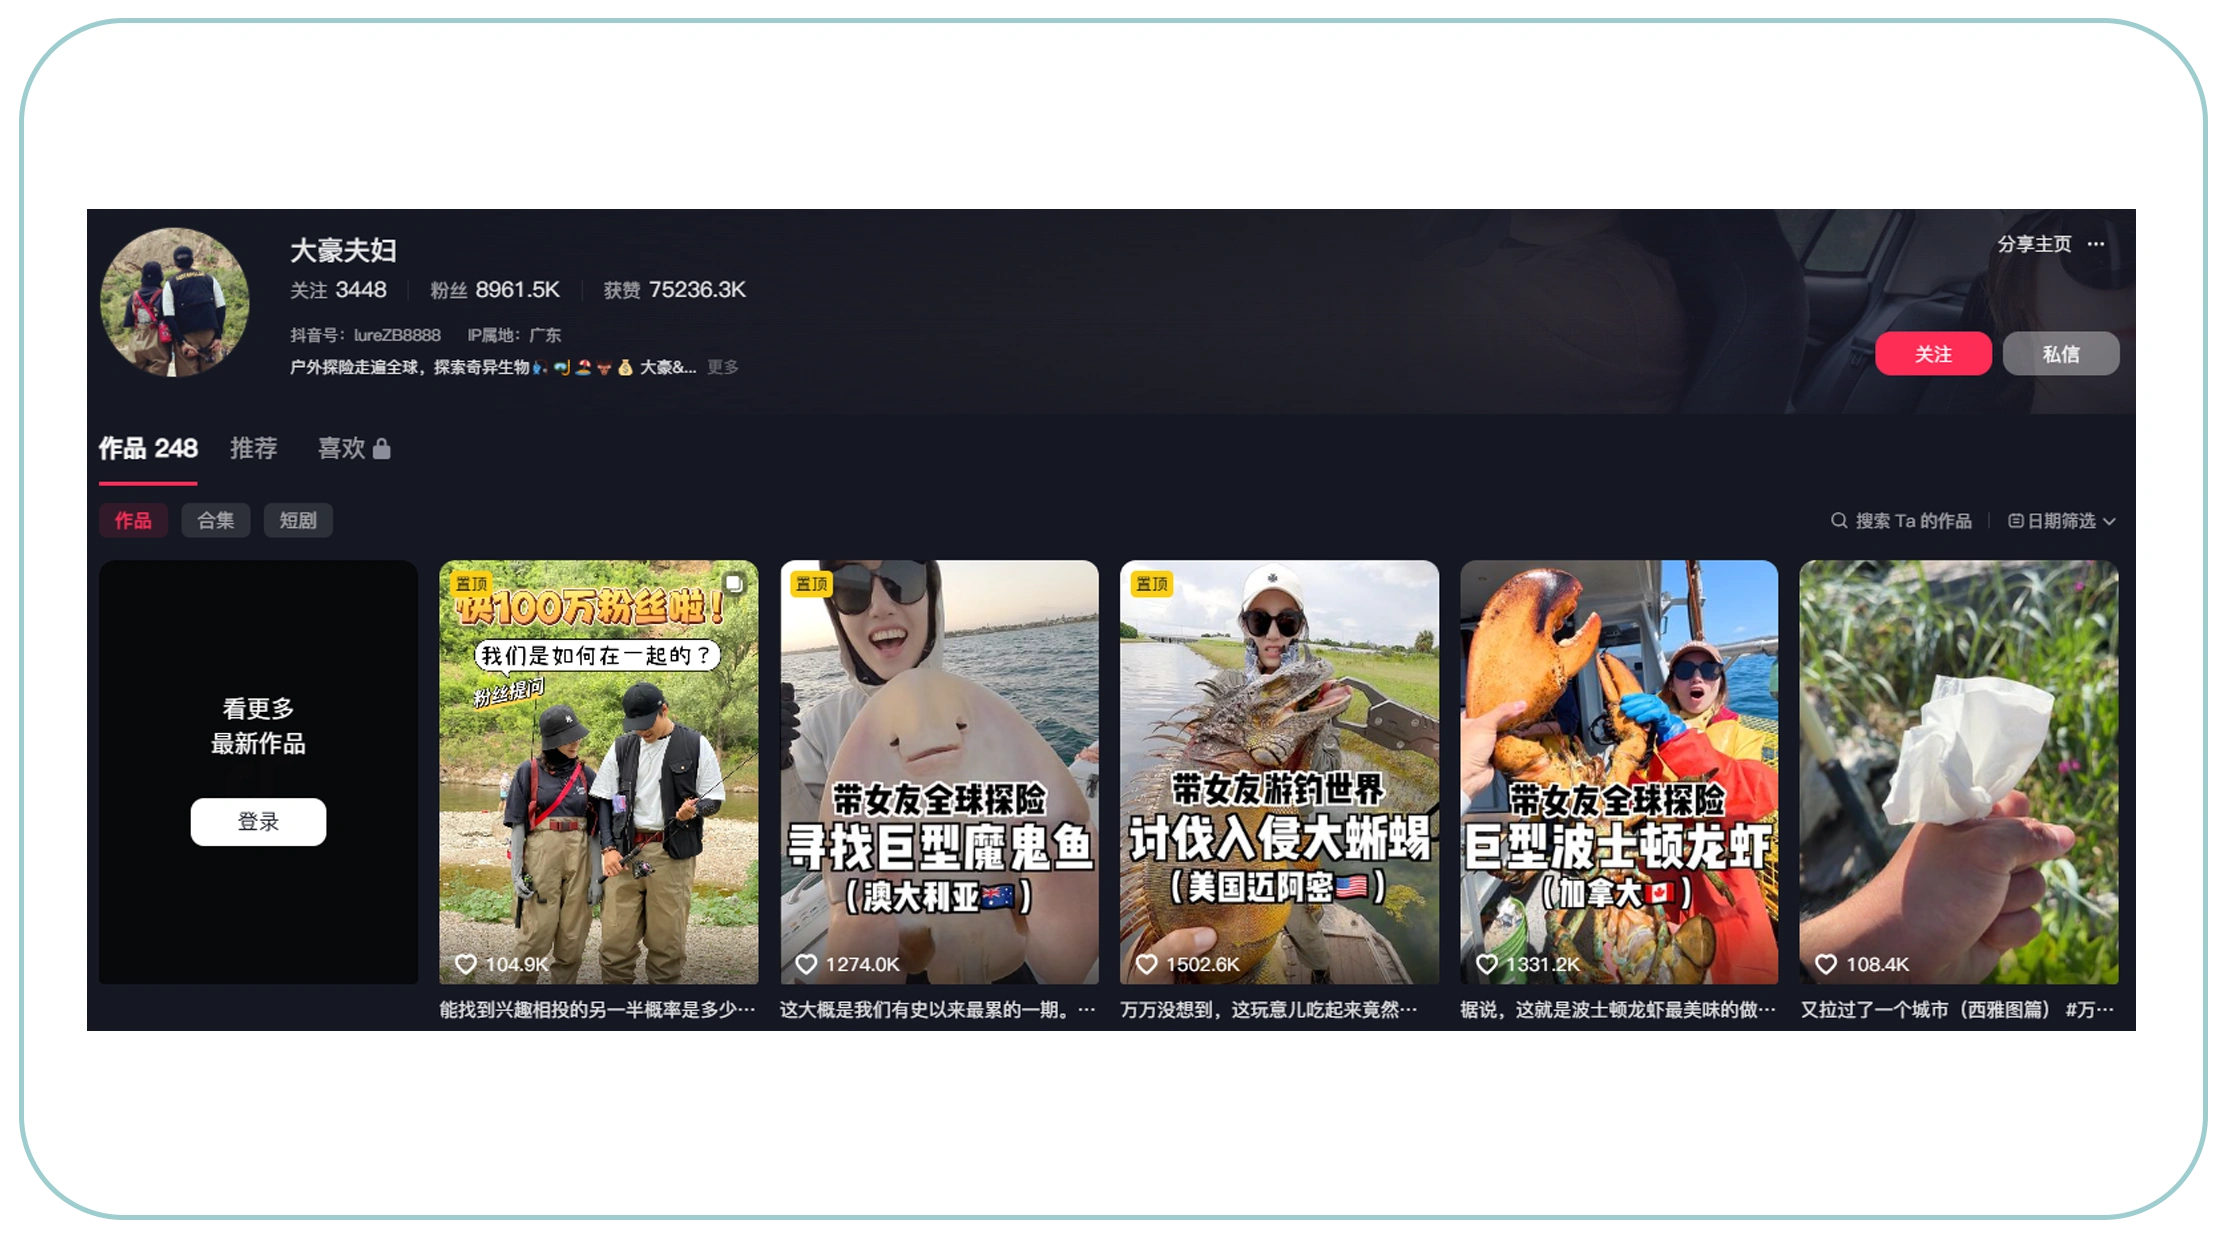
Brands need a consistent creator-level dataset before they can compare influencer performance. A profile should capture more than a username and follower count. Useful fields can include creator ID, display name, profile category, follower count, following count, video count, profile description, verification status, location where publicly available, and collection timestamp.
With scrape Douyin user profiles data, marketers can create historical snapshots instead of relying on a single profile check. Each snapshot can record the same creator at different points in time. This makes follower growth measurable.
For example, a creator with 200,000 followers today may appear more attractive than a creator with 120,000 followers. However, the second creator may have gained 40,000 followers in one month while the first gained only 5,000. Growth velocity can therefore reveal emerging influence.
What Can a Profile Dataset Track?
- Creator identity and profile metadata.
- Follower growth.
- Following changes.
- Number of published videos.
- Verification information.
- Creator category.
- Posting frequency.
- Collection date and time.
- Historical profile changes.
Example Historical Monitoring Table
| Year | Creator Profiles Tracked* | Main Measurement |
|---|---|---|
| 2020 | 5,000 | Follower count |
| 2021 | 8,000 | Follower growth |
| 2022 | 12,000 | Content activity |
| 2023 | 18,000 | Engagement signals |
| 2024 | 25,000 | Creator benchmarking |
| 2025* | 35,000 | Campaign intelligence |
| 2026* | 45,000 | Longitudinal performance |
*Illustrative dataset for explaining a monitoring framework.
A structured profile dataset also supports segmentation. Brands can group creators by follower size, category, growth rate, or posting frequency. Agencies can then build shortlists based on measurable performance instead of follower count alone.
Historical snapshots become especially valuable during campaign planning. A sudden follower increase can indicate viral content, a successful collaboration, paid promotion, or another event worth investigating.
The objective is not simply to collect profile information. It is to create a reliable timeline that explains how creator accounts evolve.
How Does Creator-Level Data Improve Influencer Analytics?
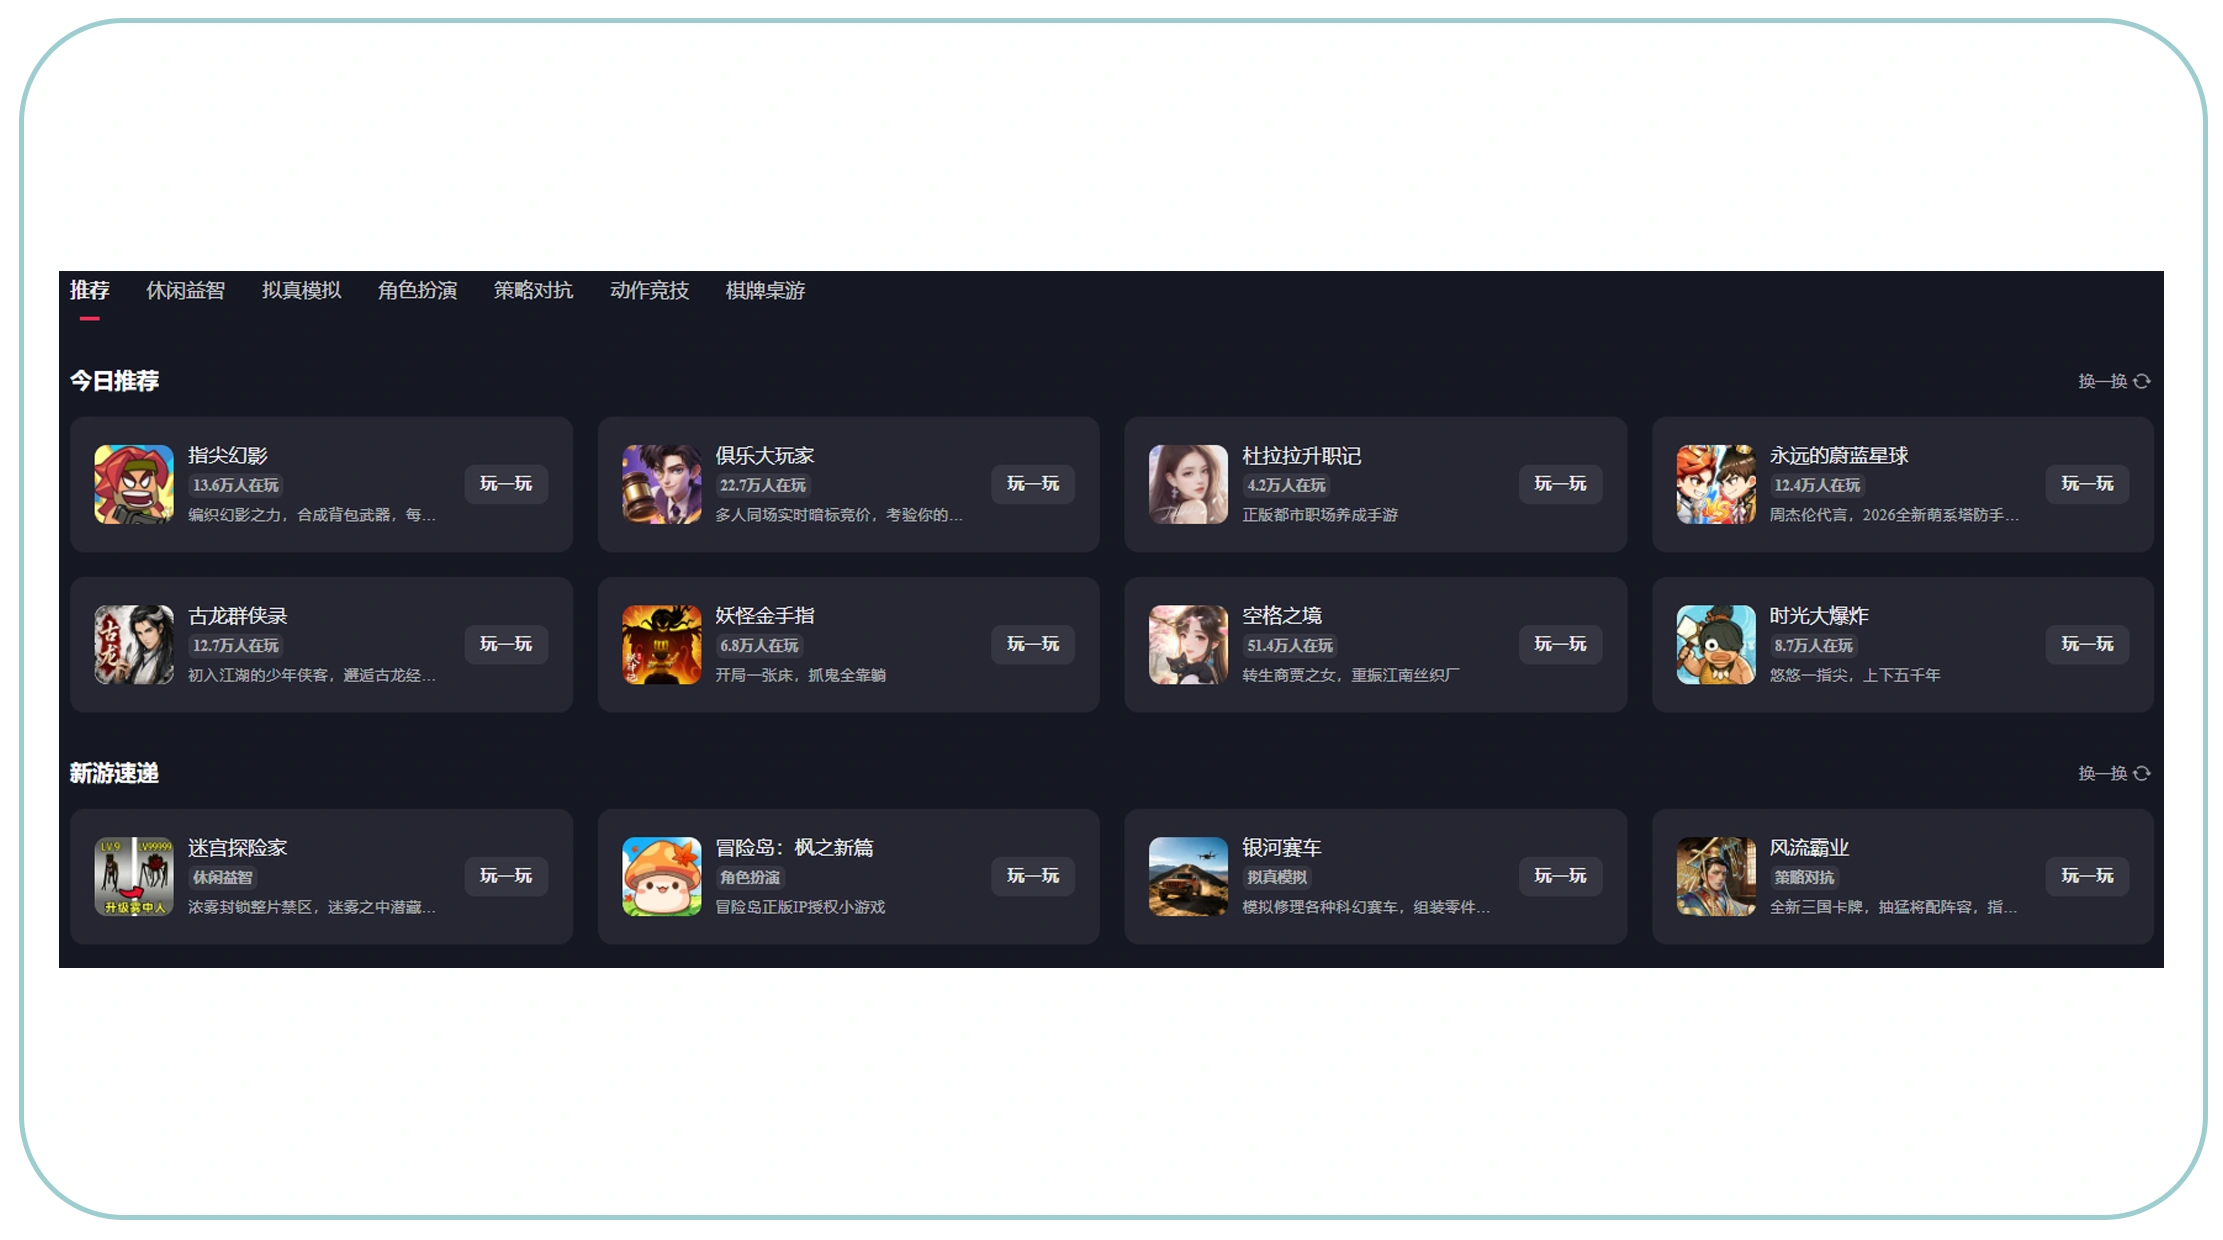
Influencer marketing becomes more measurable when brands combine profile growth with content-level engagement. Douyin data scraping for influencer analytics can organize creator and video signals into a common analytical structure.
Follower count provides scale. Engagement provides audience response. Posting frequency provides activity context. Together, these metrics offer a stronger picture of creator performance.
For example, two creators may each have one million followers. Creator A may receive consistently strong engagement across recent posts. Creator B may have a large follower base but weak recent interaction. A campaign based only on follower count could treat them as equal.
Useful Engagement Signals
- Likes per video.
- Comments per video.
- Shares per video.
- Views where publicly available.
- Engagement per follower.
- Average engagement by content category.
- Posting frequency.
- Follower growth rate.
- Engagement changes after campaigns.
A simple engagement-rate calculation can compare creators with different audience sizes:
Engagement Rate = (Likes + Comments + Shares) ÷ Followers × 100
The calculation should be applied consistently across the dataset. Brands should also define whether they use average, median, or post-level engagement.
Illustrative Performance Dataset
| Year | Average Followers* | Avg. Engagement* | Primary Use |
|---|---|---|---|
| 2020 | 85K | 4.2% | Baseline |
| 2021 | 120K | 4.5% | Growth analysis |
| 2022 | 180K | 4.8% | Creator comparison |
| 2023 | 260K | 5.1% | Campaign selection |
| 2024 | 340K | 5.3% | Performance benchmarking |
| 2025* | 430K | 5.6% | ROI analysis |
| 2026* | 520K | 5.9% | Predictive monitoring |
*Illustrative figures, not Douyin-wide benchmarks.
A 2025 industry report estimated the global influencer marketing industry at more than $32.5 billion, showing why brands increasingly need measurable creator performance systems.
Analytics can also reveal consistency. A creator who generates one viral post but performs poorly afterward may require a different campaign strategy from a creator with stable engagement across dozens of videos.
How Can Public Signals Reveal Audience Insights?
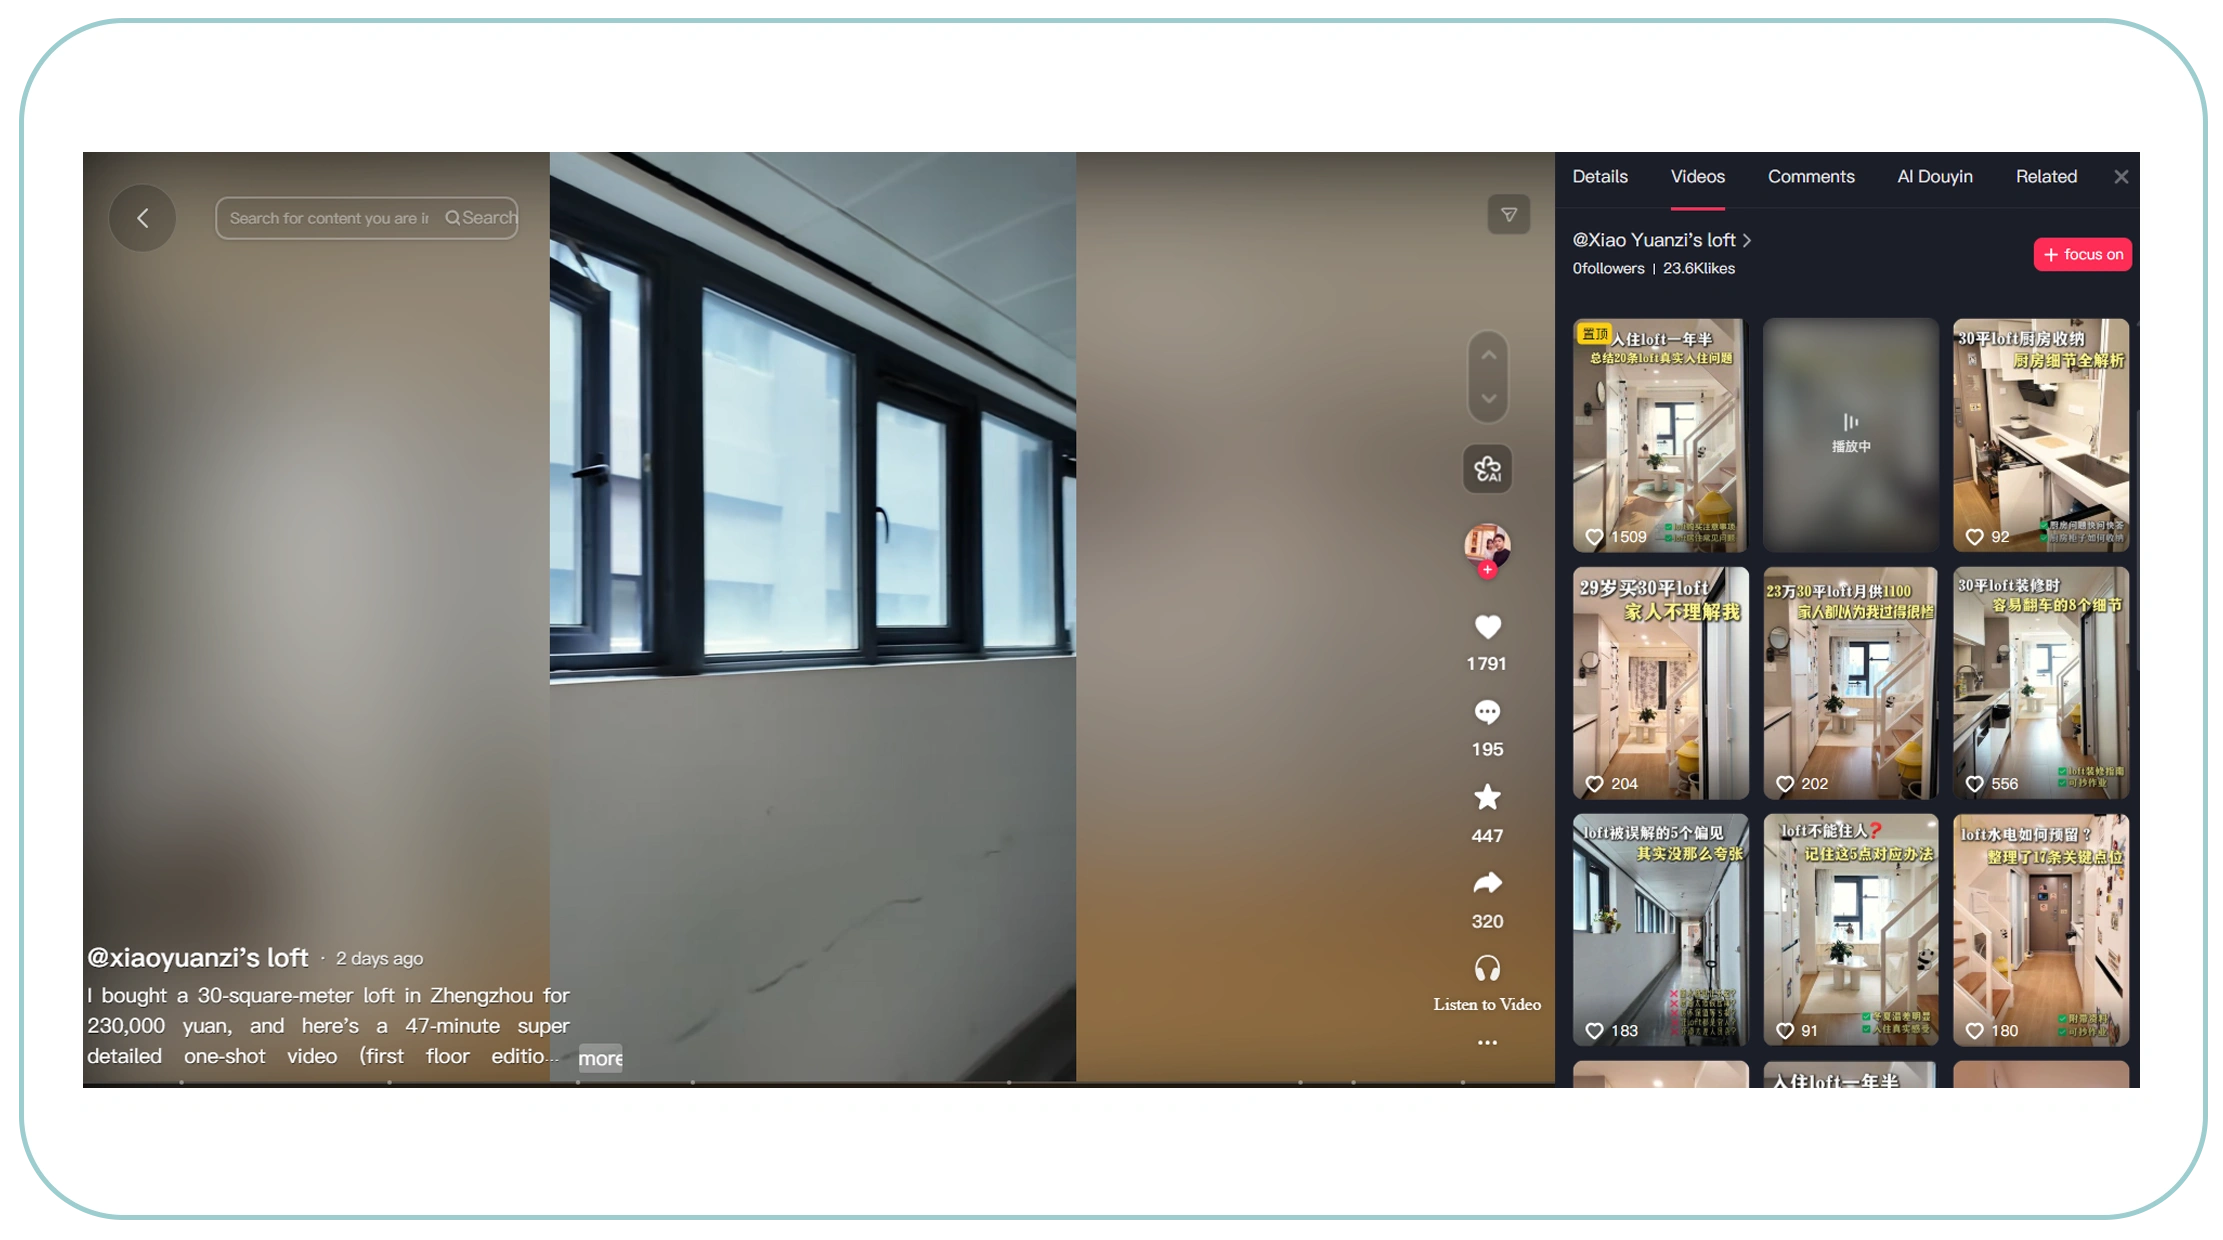
Follower numbers alone cannot explain audience behavior. Brands need content and engagement patterns to understand what audiences respond to. A Douyin public data scraper for Audience insights can organize publicly available signals into datasets for trend analysis, creator comparison, and content research, subject to platform rules and applicable law.
Audience analysis can begin with simple measurements. Researchers can compare engagement by topic, hashtag, posting frequency, video format, and creator category. They can then identify recurring patterns.
Which Audience Signals Matter?
- Engagement by content category.
- Comment volume.
- Share activity.
- Like-to-view relationships where view data is available.
- Follower growth after high-performing posts.
- Content publishing frequency.
- Popular themes.
- Recurring hashtags.
- Creator category performance.
A particularly useful approach is event-based analysis. Suppose an influencer publishes a product review and gains 15,000 followers over the following week. That change can be compared with the content's engagement metrics.
This helps marketers move from:
"This creator has many followers."
to:
"This creator's audience responds strongly to this type of content."
Illustrative Audience Insight Table
| Year | Content Signals* | Audience Analysis |
|---|---|---|
| 2020 | Likes | Basic popularity |
| 2021 | Likes + comments | Interaction |
| 2022 | Shares + comments | Content resonance |
| 2023 | Follower changes | Growth attribution |
| 2024 | Content categories | Topic analysis |
| 2025* | Creator comparisons | Audience benchmarking |
| 2026* | Multi-signal trends | Advanced performance analysis |
*Framework examples rather than platform-wide statistics.
Researchers can also use comments as qualitative signals. Comment volume does not automatically mean positive sentiment, but it can indicate that a video generated discussion. Combining comment counts with text analysis can provide additional context.
This approach helps brands identify audience interests, creator strengths, emerging topics, and content opportunities without treating follower size as the only measure of influence.
Why Is a Historical Dataset Important for Douyin Performance Tracking?
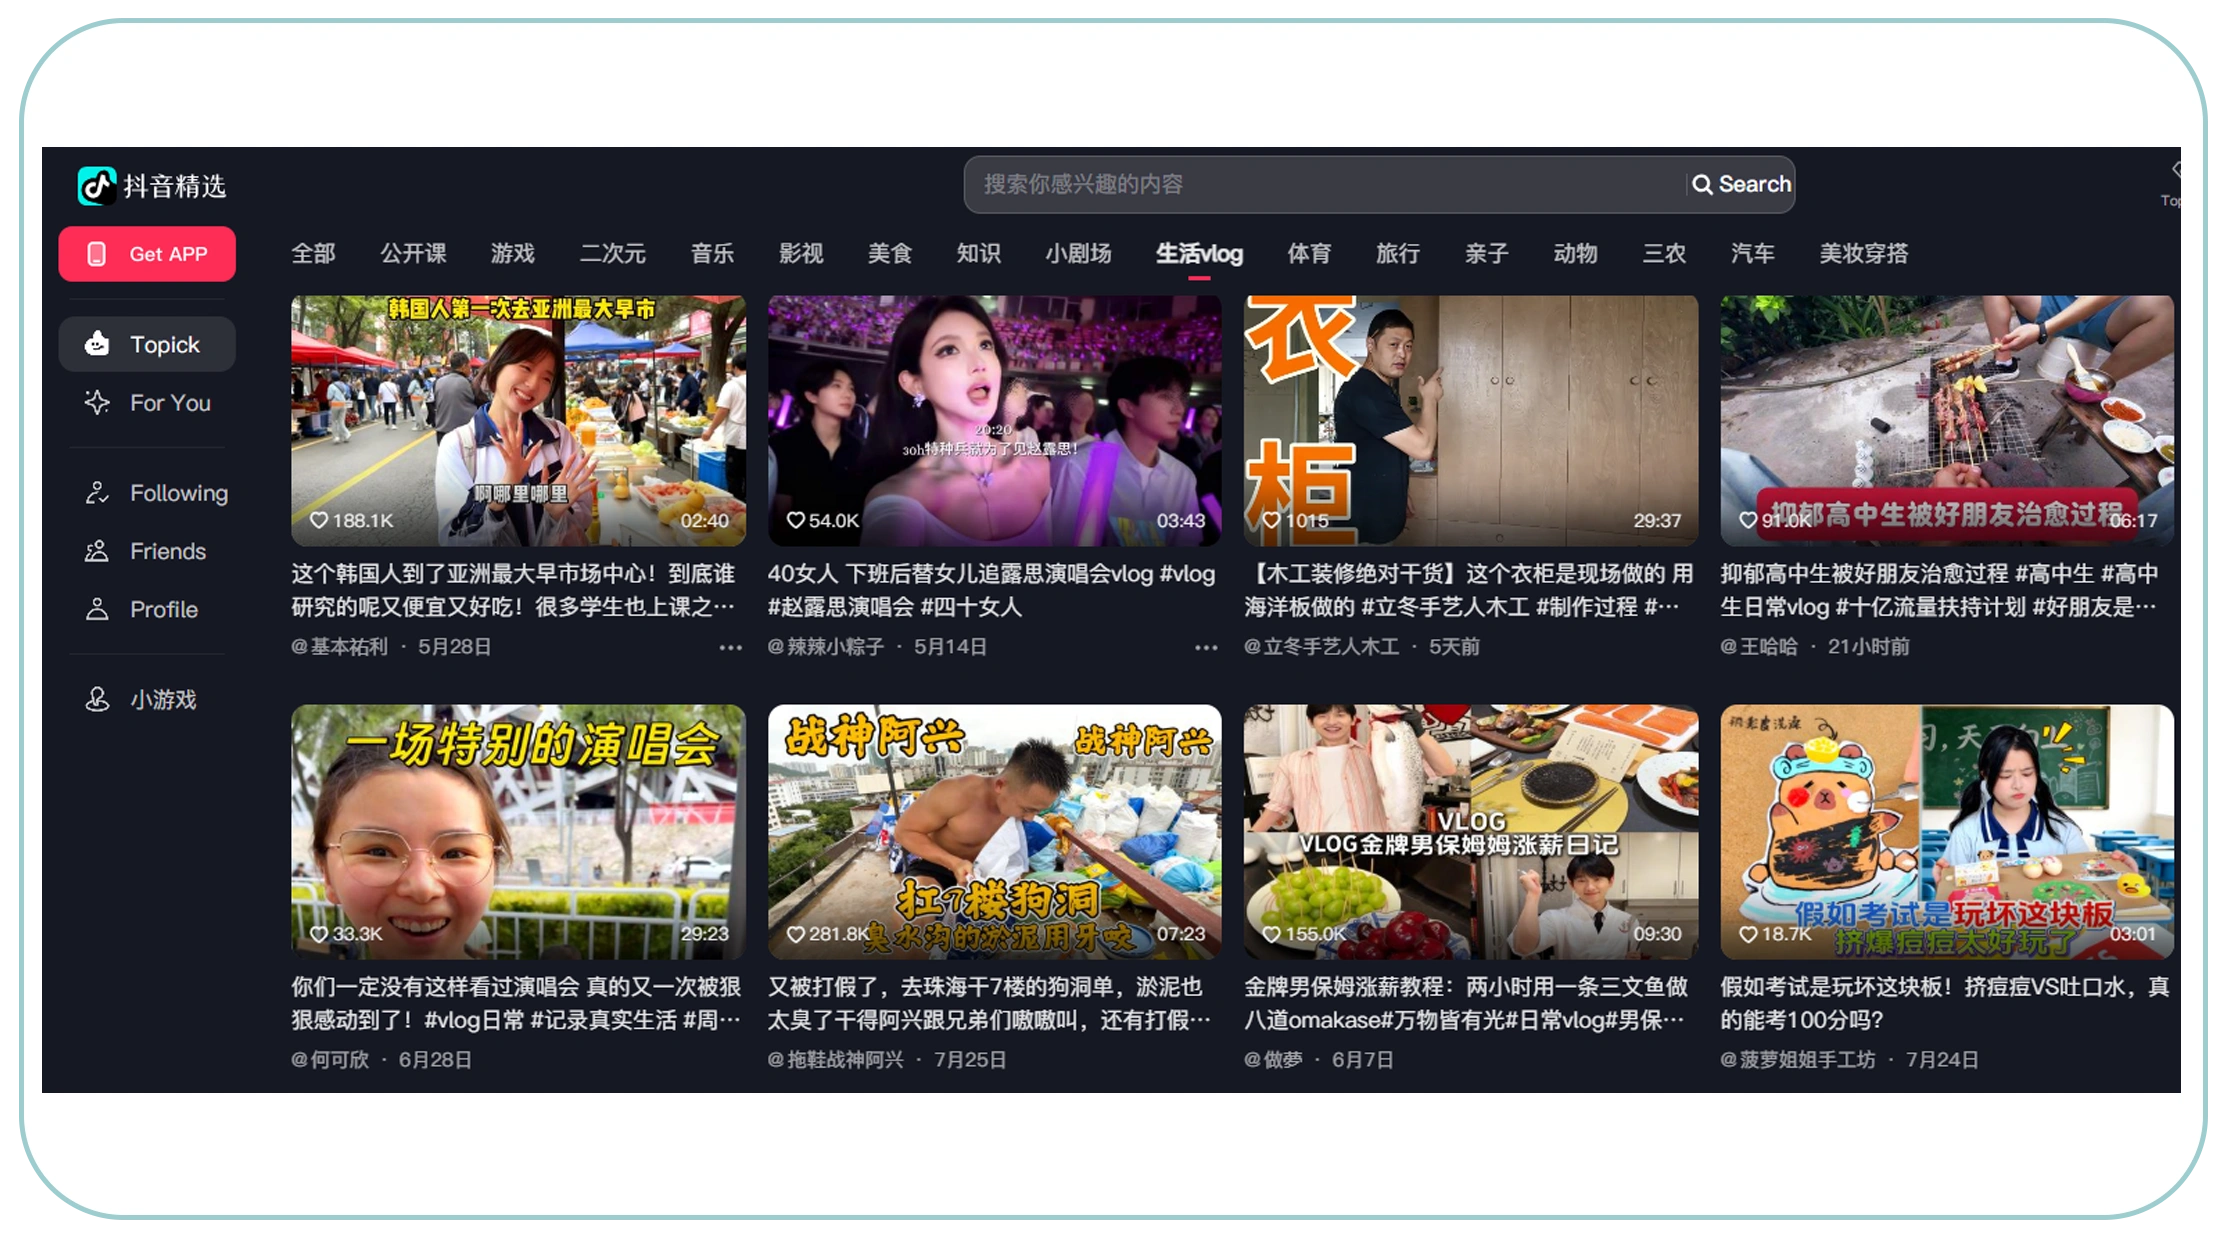
A creator's current metrics provide only a snapshot. A Social Media Dataset can provide the historical context needed to understand growth, engagement, posting patterns, and campaign changes. Combining this with web scraping Douyin follower growth and engagement data allows analysts to build longitudinal creator records.
Historical data is valuable because social performance changes quickly. Algorithms shift. Trends appear and disappear. Creators change content categories. Campaigns can create temporary spikes. A single data point cannot capture these changes.
Example Seven-Year Tracking Framework
| Year | Dataset Focus | Business Question |
|---|---|---|
| 2020 | Profile metrics | Who was growing? |
| 2021 | Content activity | Which creators posted consistently? |
| 2022 | Engagement | Which content generated interaction? |
| 2023 | Growth trends | Which creators accelerated? |
| 2024 | Campaign signals | Which partnerships performed? |
| 2025* | Competitive data | Which creators gained market share? |
| 2026* | Trend monitoring | Who is emerging now? |
*These yearly categories are illustrative. Actual datasets should reflect the fields available and the collection period.
Historical records allow analysts to calculate growth rates over different periods. They can compare seven-day, 30-day, quarterly, and annual changes. This makes it easier to distinguish steady growth from short-lived viral spikes.
What Can Historical Data Reveal?
- Sustained creator growth.
- Sudden follower acceleration.
- Engagement declines.
- Changes in posting frequency.
- Content category shifts.
- Campaign-related performance changes.
- Emerging creators.
- Competitive movements.
Douyin's role in social commerce makes this especially useful. Academic research describes the platform as supporting a more closed-loop journey from awareness and interest toward purchase, with sales and conversion metrics playing an important role.
For brands, historical datasets therefore support more than social reporting. They can contribute to creator selection, competitive intelligence, campaign planning, and market research.
Can Automated Collection Replace Manual Influencer Tracking?
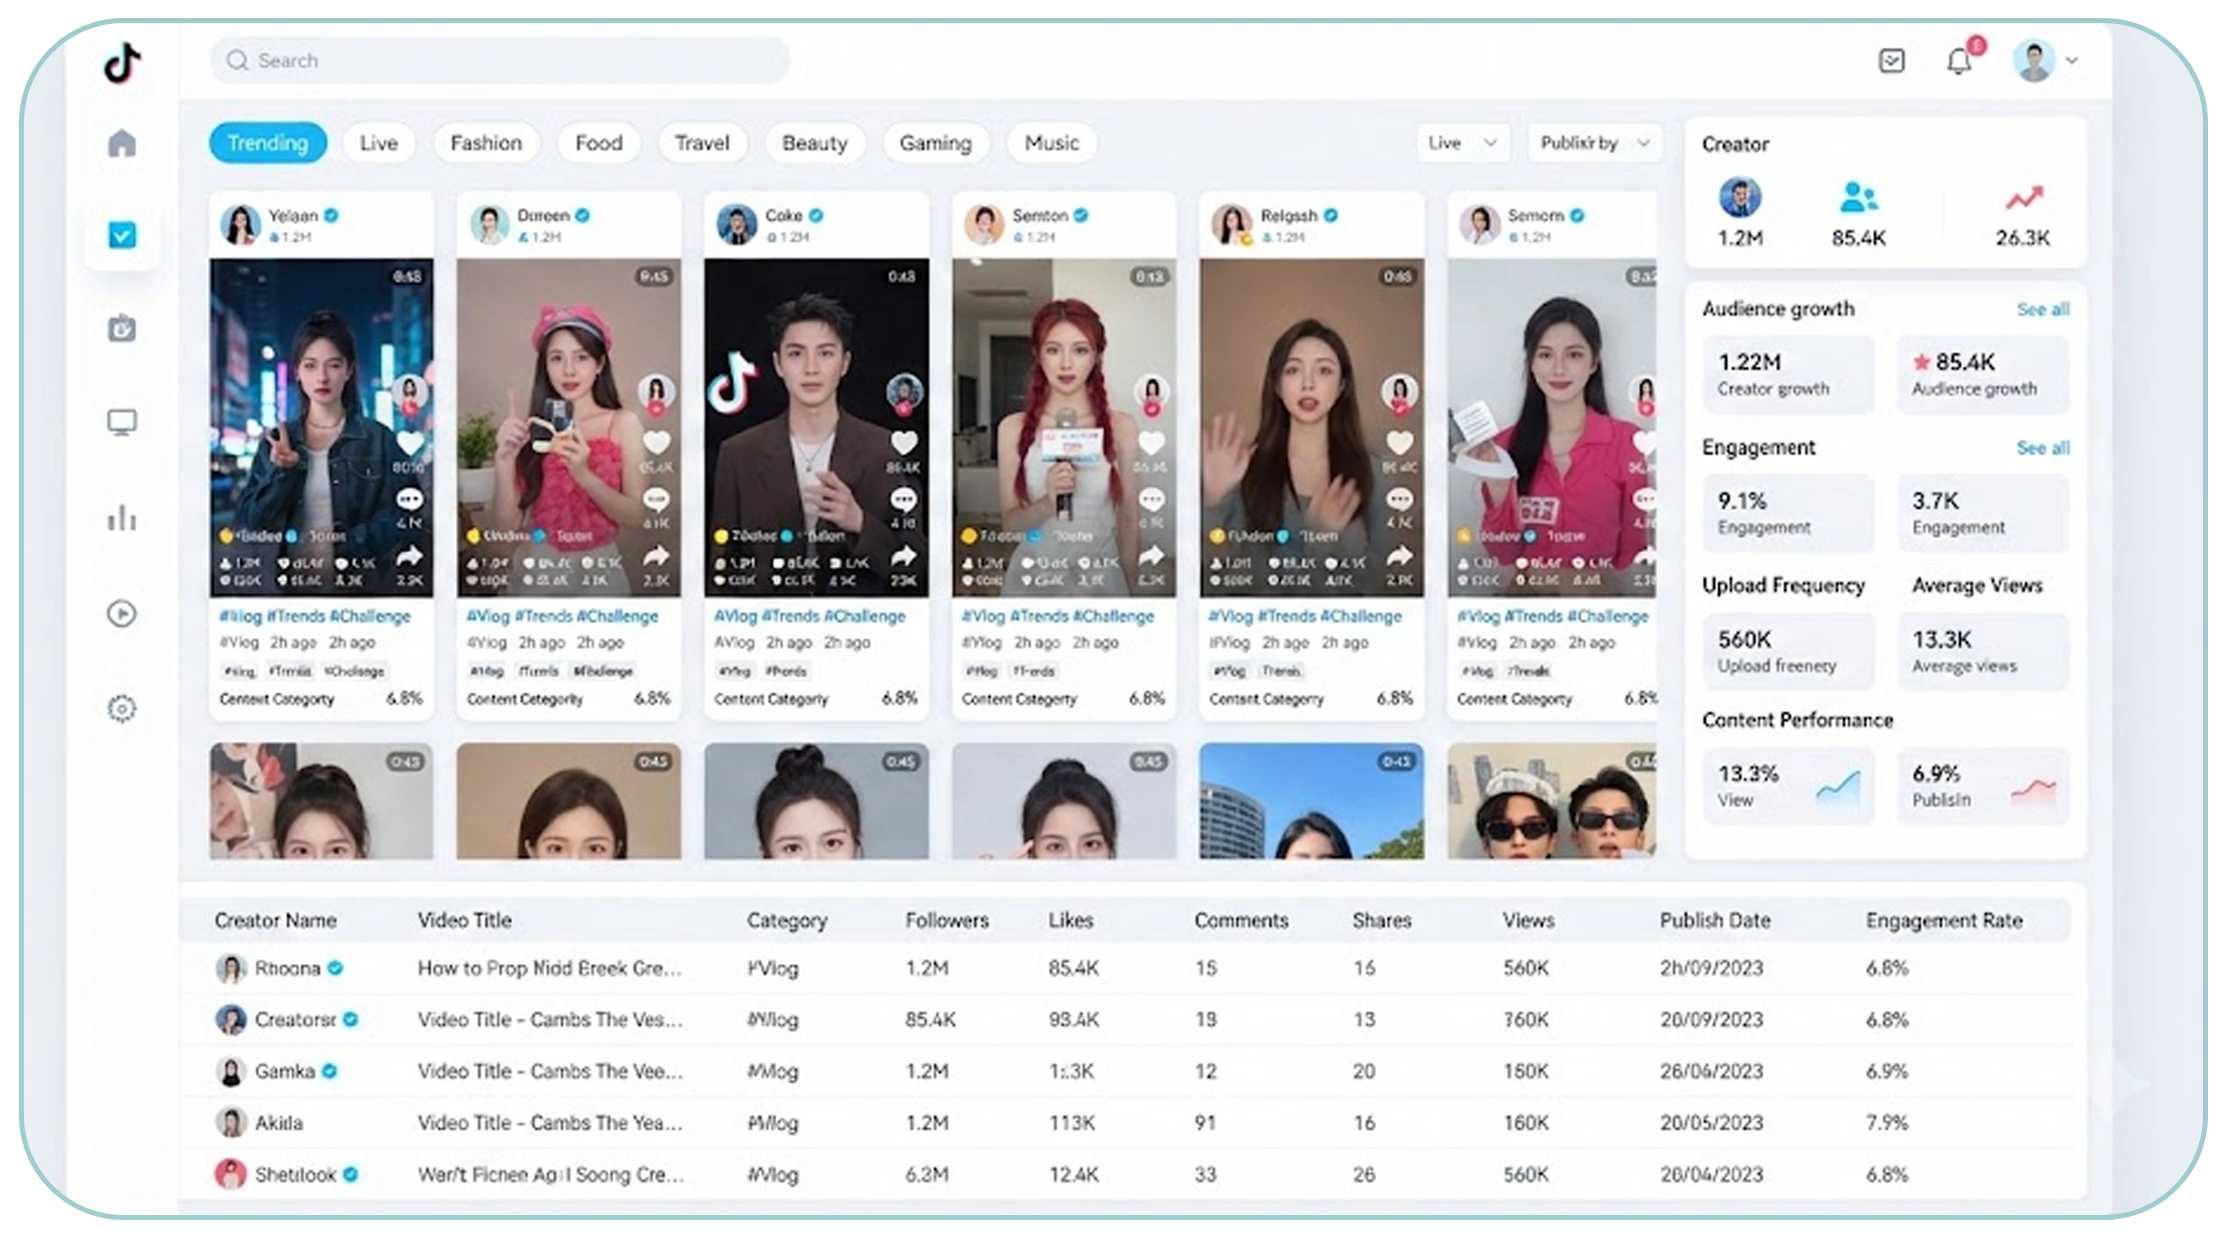
Manual monitoring works for a handful of creators. It becomes difficult when an agency needs to monitor hundreds or thousands of profiles. Instant Data Scraper can be useful for simple table-oriented collection tasks, but larger influencer intelligence programs usually require structured workflows, scheduling, validation, storage, and analytics.
Automation can reduce repetitive work. A typical workflow can follow these steps:
- Define creator profiles or discovery sources.
- Collect permitted public information.
- Capture timestamps.
- Normalize profile and content fields.
- Remove duplicate records.
- Validate missing or inconsistent values.
- Store historical snapshots.
- Calculate growth and engagement metrics.
- Feed the dataset into dashboards.
- Refresh records on a defined schedule.
Illustrative Automation Metrics
| Year | Manual Tracking Time* | Automated Coverage* |
|---|---|---|
| 2020 | 100% | 10% |
| 2021 | 85% | 25% |
| 2022 | 70% | 40% |
| 2023 | 55% | 55% |
| 2024 | 40% | 70% |
| 2025* | 30% | 82% |
| 2026* | 20% | 90% |
*Illustrative operational targets, not measured industry averages.
Automation also improves consistency. A human analyst may collect follower counts at different times each day. A scheduled process can use a defined collection schedule and timestamp every observation.
However, automation should not mean unrestricted collection. Teams should review Douyin's terms, applicable laws, privacy requirements, robots directives where relevant, and any API or access restrictions before collecting data.
The right architecture depends on scale. A small research project may need a simple extraction workflow. An enterprise program may require APIs, queues, databases, validation layers, monitoring, and dashboard integration.
How Can Market Research Teams Turn Creator Data Into Decisions?
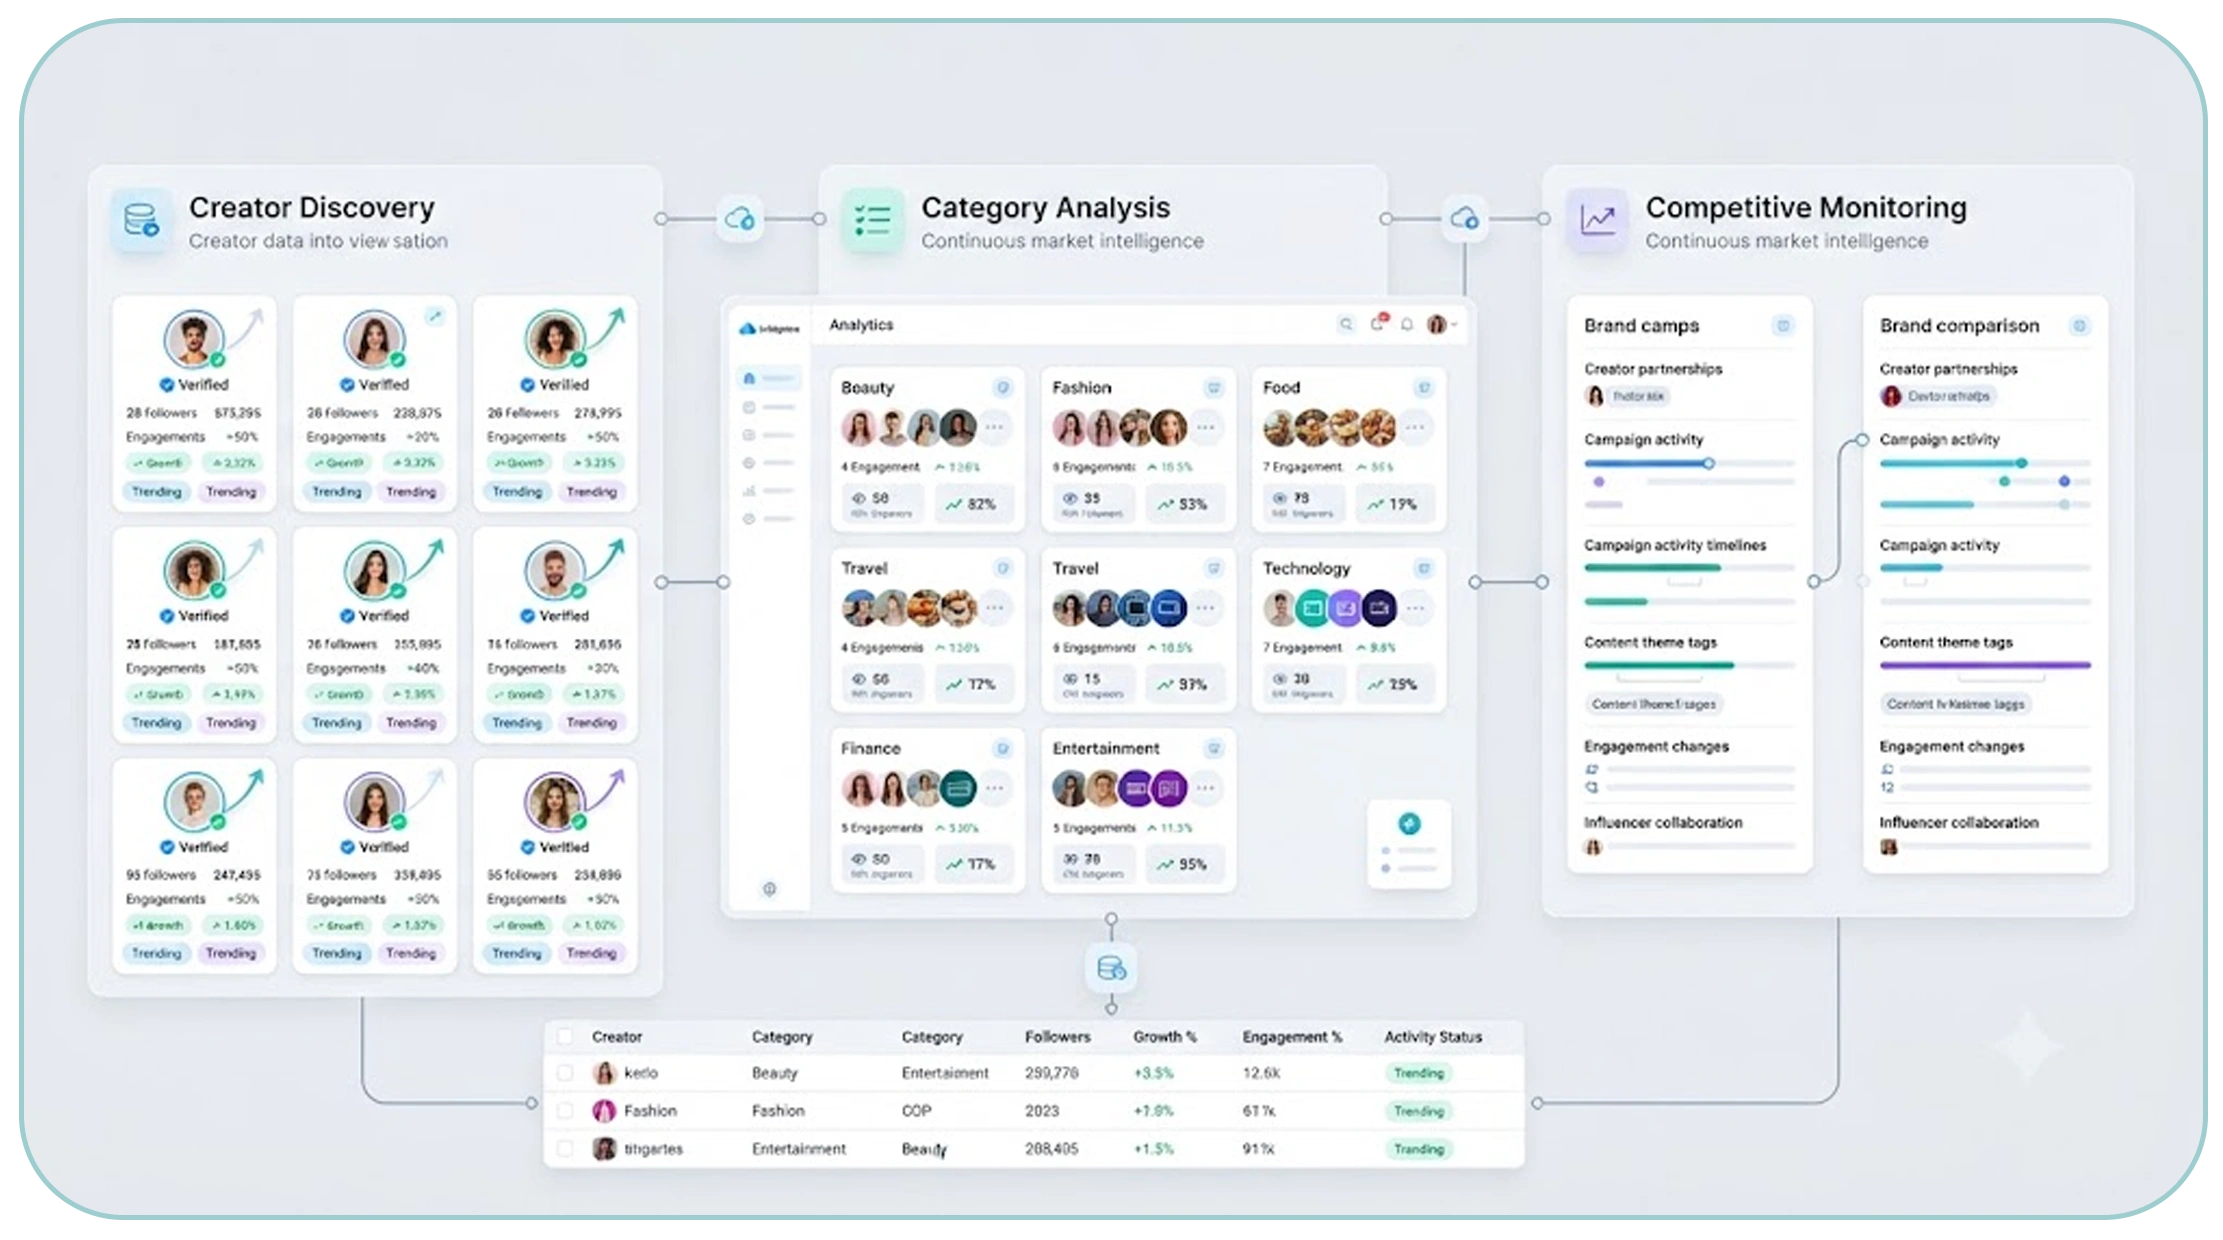
Market research teams can use creator datasets to study audience trends, competitive positioning, category growth, and influencer performance. Market Research becomes more useful when creator data is refreshed regularly and connected to broader social and commercial signals.
The first step is creator discovery. Analysts can identify accounts that are growing faster than established competitors. Growth rate can be more informative than absolute follower count when searching for emerging influencers.
The second step is category analysis. Teams can group creators by beauty, fashion, food, travel, technology, finance, entertainment, or other niches. They can then compare engagement and follower growth within each category.
The third step is competitive monitoring. Brands can track competitor partnerships, creator activity, content themes, and engagement changes. This can reveal where competitors are increasing their influencer investment.
Example Market Research Scorecard
| Metric | Weight* | Purpose |
|---|---|---|
| Follower growth | 25% | Measures momentum |
| Engagement | 25% | Measures audience response |
| Posting consistency | 15% | Measures activity |
| Content relevance | 15% | Measures brand fit |
| Share activity | 10% | Indicates content spread |
| Comment activity | 10% | Indicates discussion |
*Illustrative scoring model.
The same framework can support campaign evaluation. Before a campaign, marketers can establish a baseline. During the campaign, they can monitor changes. Afterward, they can compare follower growth and engagement against the baseline.
The result is a shift from basic reporting to performance intelligence.
For example, an influencer with moderate follower growth but exceptional engagement may deserve further evaluation. Another creator with rapid follower growth but declining engagement may require closer investigation.
The historical approach also supports forecasting. If an account has maintained consistent growth for several months, analysts can flag it as an emerging creator. This does not guarantee future performance, but it provides a stronger basis for outreach and research.
Why Choose Real Data API for Douyin Data Intelligence?
Real Data API can help businesses build scalable data workflows for social media research, competitor monitoring, creator discovery, and market intelligence. web scraping Douyin follower growth and engagement data can be organized into structured datasets that support historical tracking and analytics.
A practical data workflow can include:
- Profile data collection.
- Video-level data collection where permitted.
- Follower growth monitoring.
- Engagement measurement.
- Timestamped historical records.
- Data normalization.
- Duplicate removal.
- Structured output.
- Scheduled refreshes.
- API-ready delivery.
- Dashboard integration.
The main advantage is scale. Teams do not need to depend entirely on manual searches when they need to monitor large creator lists. Structured datasets also make comparisons easier across creators, categories, and time periods.
Real Data API can support use cases such as influencer discovery, campaign benchmarking, social media research, creator monitoring, and competitive intelligence.
Data collection should always follow applicable platform rules, legal requirements, privacy standards, and permitted access methods.
Conclusion
Influencer performance tracking works best when brands measure change rather than isolated numbers. Follower count shows audience size. Engagement shows interaction. Posting activity shows consistency. Historical records show momentum.
A structured approach can combine these signals into a single performance dataset. That helps brands identify emerging creators, compare influencer quality, monitor campaigns, study audience interests, and understand competitive movements.
The creator economy continues to expand. A 2025 industry report placed the global influencer marketing market above $32.5 billion, while research on Douyin highlights its importance in social commerce and influencer-led consumer journeys.
For brands, agencies, and research teams, web scraping Douyin follower growth and engagement data can provide the historical foundation needed for more informed creator decisions.
Build a scalable Douyin data strategy with Real Data API and turn creator performance signals into actionable influencer intelligence!
Latest posts
How Myntra Fashion Dataset Solves Fashion Intelligence Challenges Across Products, Prices, Brands, and Fashion Market Trends?
How Hyatt Travel Dataset Helps Businesses Track Hotels, Room Prices, Amenities, Locations, and Travel Trends?

How Louis Vuitton Fashion Dataset Enables Better Analysis of Luxury Products, Prices, Brands, and Fashion Trends?
How Blinkit Grocery Dataset Enables Smarter Analysis of Products, Prices, Availability, and Quick-Commerce Trends?






.png)



