.webp)
TL;DR
- A structured Blinkit grocery dataset helps brands, retailers, FMCG companies, and researchers analyze product assortment, prices, availability, and marketplace changes over time.
- Blinkit Grocery Data Scraping can transform frequently changing catalog information into standardized records for pricing intelligence, assortment monitoring, and quick-commerce research.
- Historical data from 2020–2026 can help teams connect catalog-level changes with the rapid expansion of India's quick-commerce ecosystem and make recurring analysis more systematic.
Introduction
The fastest way to understand a quick-commerce marketplace is to turn changing product pages into structured, time-stamped data. A Blinkit Grocery Dataset can provide a structured view of product names, categories, prices, discounts, availability, brands, pack sizes, and other publicly visible attributes for recurring analysis.
This matters because quick commerce has moved far beyond a narrow grocery proposition. Eternal describes Blinkit today as a quick-commerce platform offering grocery and daily essentials alongside electronics, beauty and personal care, stationery, emergency supplies, fashion, sports, and toys. Its current corporate page states that more than 31 million customers use the app monthly and that the network has more than 2,400 stores across 300+ cities.
The market has also expanded rapidly. Eternal's historical data shows Blinkit's dark-store network rising from 377 stores in FY23 to 526 in FY24 and 1,301 by FY25, while reported orders increased from 119 million in FY23 to 203 million in FY24 and 424 million in FY25.
For FMCG brands, this creates a practical data challenge: product assortment, prices, promotions, and availability can change faster than manually maintained spreadsheets can capture.
A recurring Blinkit Grocery Data Scraping workflow can address this problem by collecting defined fields at scheduled intervals, normalizing the information, validating records, and delivering structured outputs for dashboards, reports, APIs, or databases.
How can structured marketplace collection improve grocery intelligence?
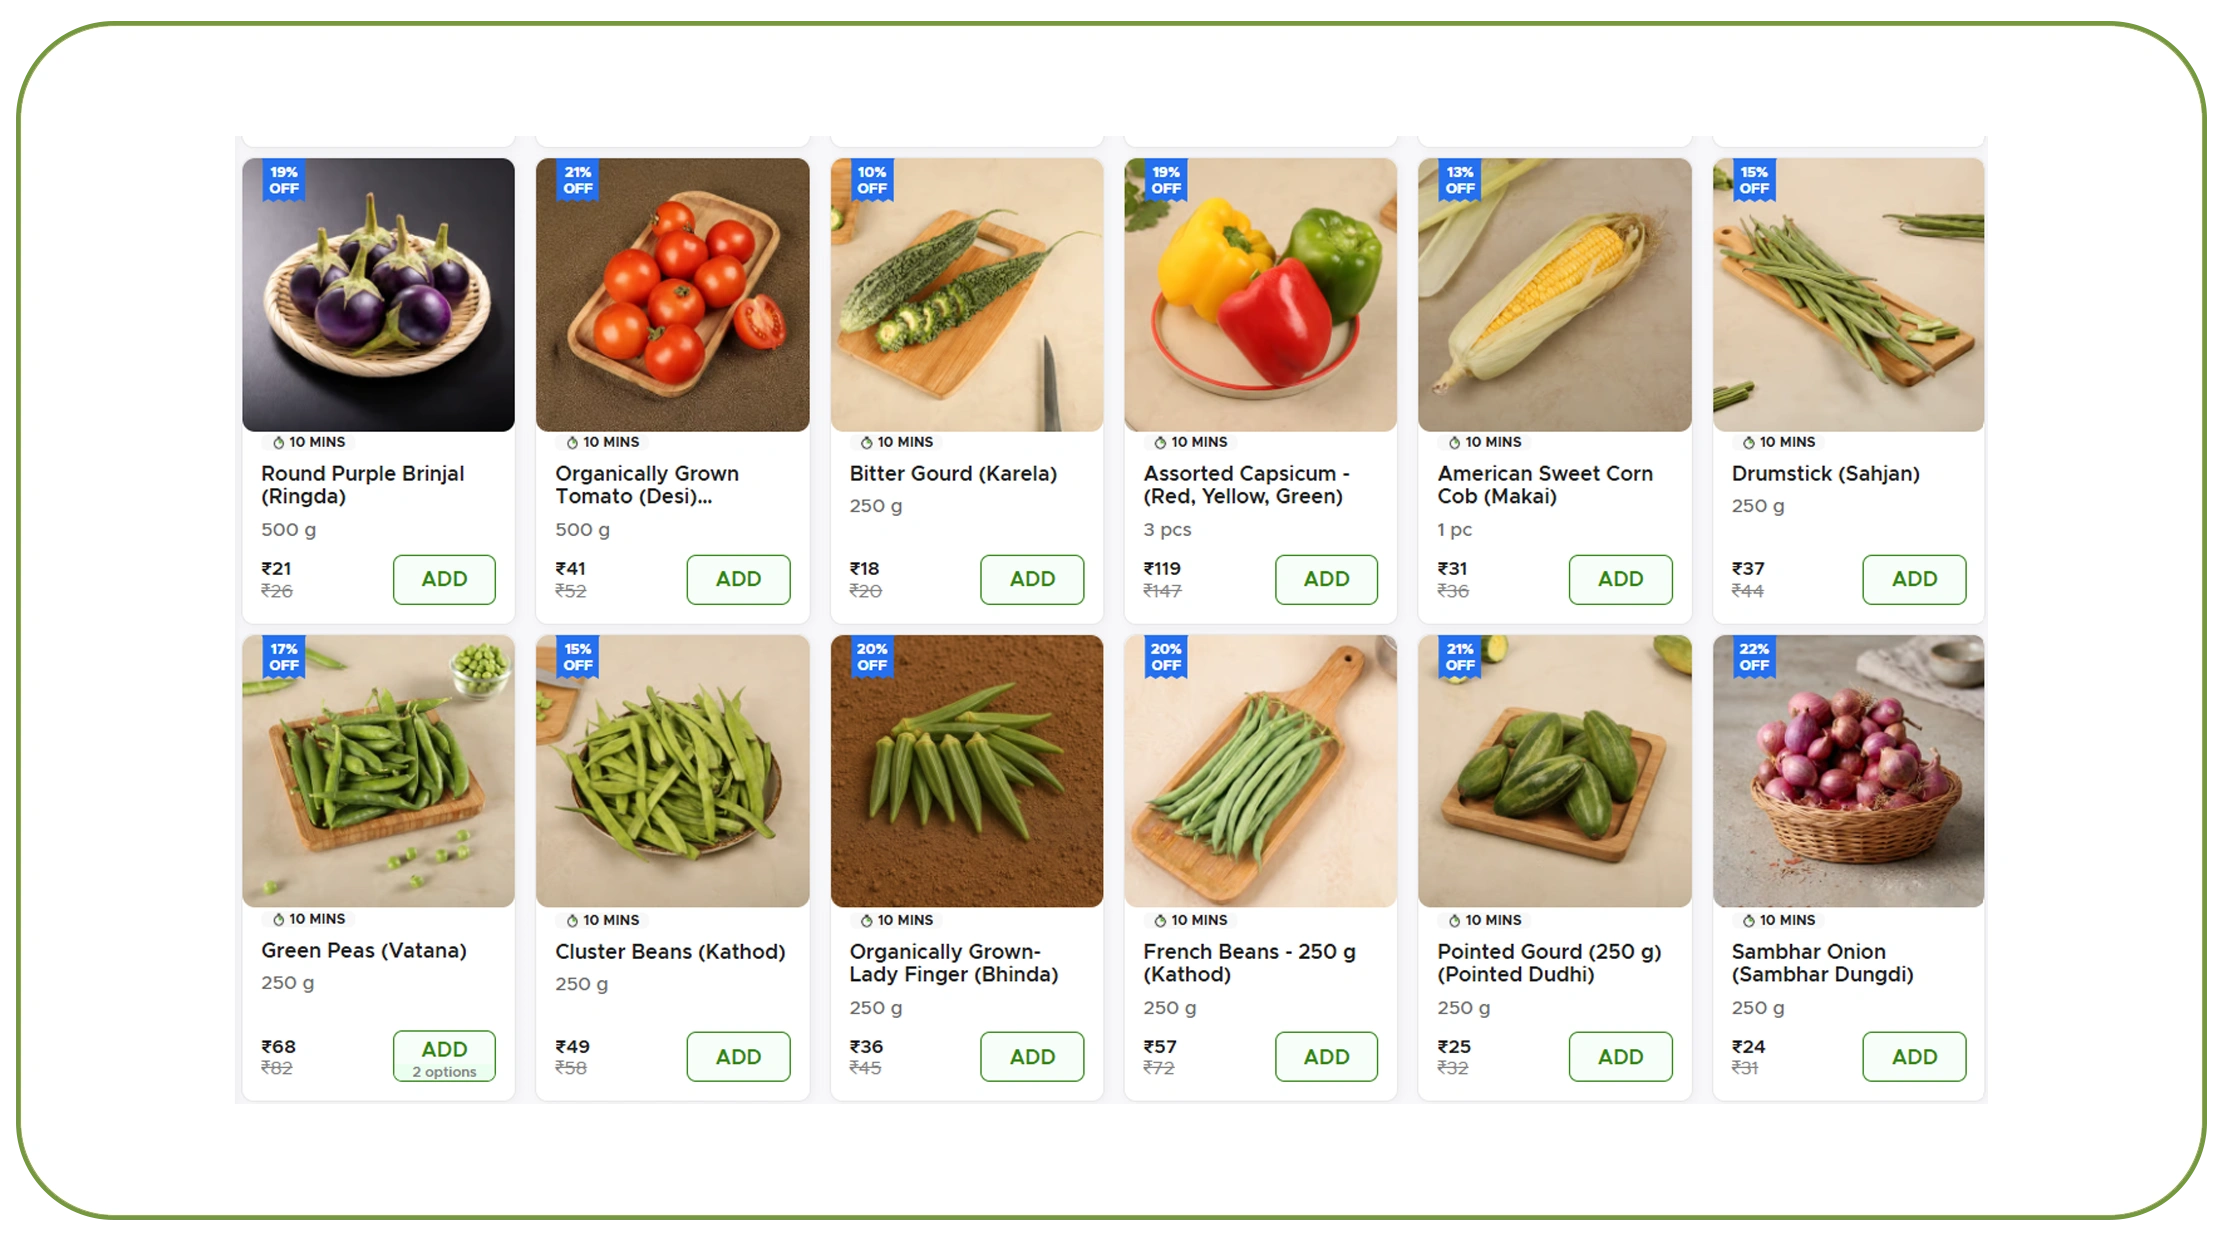
Blinkit grocery data collection services, Blinkit grocery dataset workflows can help organizations convert dynamic marketplace information into standardized records that are easier to compare historically.
For an FMCG brand, the goal is not simply to know whether a product appears online. The useful question is how its price, availability, category position, pack size, promotion, and competitive context change over time.
A structured collection process can capture fields such as:
- Product name
- Brand
- Category and subcategory
- Pack size
- MRP and selling price
- Discount
- Availability
- Product URL
- Product or SKU identifier
- Seller/store information where available
- Collection timestamp
- Location or service area where relevant
Example Historical Monitoring Framework
| Year | Market-Development Context | Recommended Data Focus |
|---|---|---|
| 2020 | COVID-era acceleration of digital grocery | Product and availability snapshots |
| 2021 | Expansion of online grocery behavior | Category and price tracking |
| 2022 | Blinkit acquisition by Zomato | Product and marketplace history |
| 2023 | Store and order-scale expansion | Assortment and availability |
| 2024 | 639 active stores in 1QFY25 | Pricing and category monitoring |
| 2025 | 1,301 stores by FY25 | High-frequency product intelligence |
| 2026 | 2,400+ stores and 300+ cities stated by Eternal | Scalable multi-location monitoring |
The 2020–2026 timeline should be interpreted as a combination of market context and recommended data-collection priorities rather than a claim that the same dataset existed continuously throughout those years. Blinkit was acquired by Zomato in 2022, and historical company data shows significant acceleration in stores and orders afterward.
The scale of expansion makes structured monitoring increasingly relevant. In August 2024, Blinkit reported that average gross order value throughput per store had increased from approximately ₹6 lakh per day at 383 stores to approximately ₹10 lakh at 639 stores. The company also said selection available in some neighborhoods had increased four- to five-fold over eight quarters, reaching as many as 25,000 unique SKUs in some locations.
For businesses, this means a marketplace can contain thousands of observations that are difficult to monitor manually. Automated collection creates a repeatable foundation for pricing, assortment, availability, and competitive research.
What information should businesses capture from grocery product listings?
Scrape Blinkit grocery product data projects become more valuable when the collection schema reflects the actual decisions the business needs to make.
A retailer may focus on competitive prices. An FMCG manufacturer may prioritize brand presence, pack sizes, availability, and promotions. A market research company may require a broader product taxonomy and historical observations.
Recommended Data Schema
| Data Field | Example Use | Buyer Persona |
|---|---|---|
| Product name | Product identification | Retailer / Analyst |
| Brand | Brand visibility | FMCG brand |
| Category | Assortment analysis | Retailer |
| Pack size | SKU comparison | Manufacturer |
| MRP | Reference pricing | Pricing team |
| Selling price | Competitive monitoring | Revenue team |
| Discount | Promotion analysis | Marketing team |
| Availability | Stock visibility | Supply-chain team |
| Product URL | Traceability | Data team |
| Timestamp | Historical comparison | Research team |
| Location | Geographic analysis | Market researcher |
From 2020 to 2026, the role of product-level data has expanded alongside quick-commerce scale. Early online-grocery analysis could focus primarily on whether products were listed and at what price. As quick-commerce platforms expanded their selection, store networks, and categories, analysts increasingly needed richer product attributes and more frequent observations.
Blinkit's expansion illustrates this evolution. Its active dark stores were reported at 377 in FY23, 526 in FY24, and 639 in 1QFY25. By FY25, company data showed 1,301 stores and 424 million orders for the year.
The implication for data buyers is straightforward: broader geographic and assortment coverage requires a schema that can distinguish products, variants, locations, timestamps, and pricing observations.
Historical snapshots can then answer practical questions. Did a brand disappear because the SKU was discontinued, or was it temporarily unavailable? Did a price change affect all pack sizes or only one? Did a category gain more products over several months?
These questions require repeated observations rather than one-time catalog exports.
How does systematic extraction support competitive research?
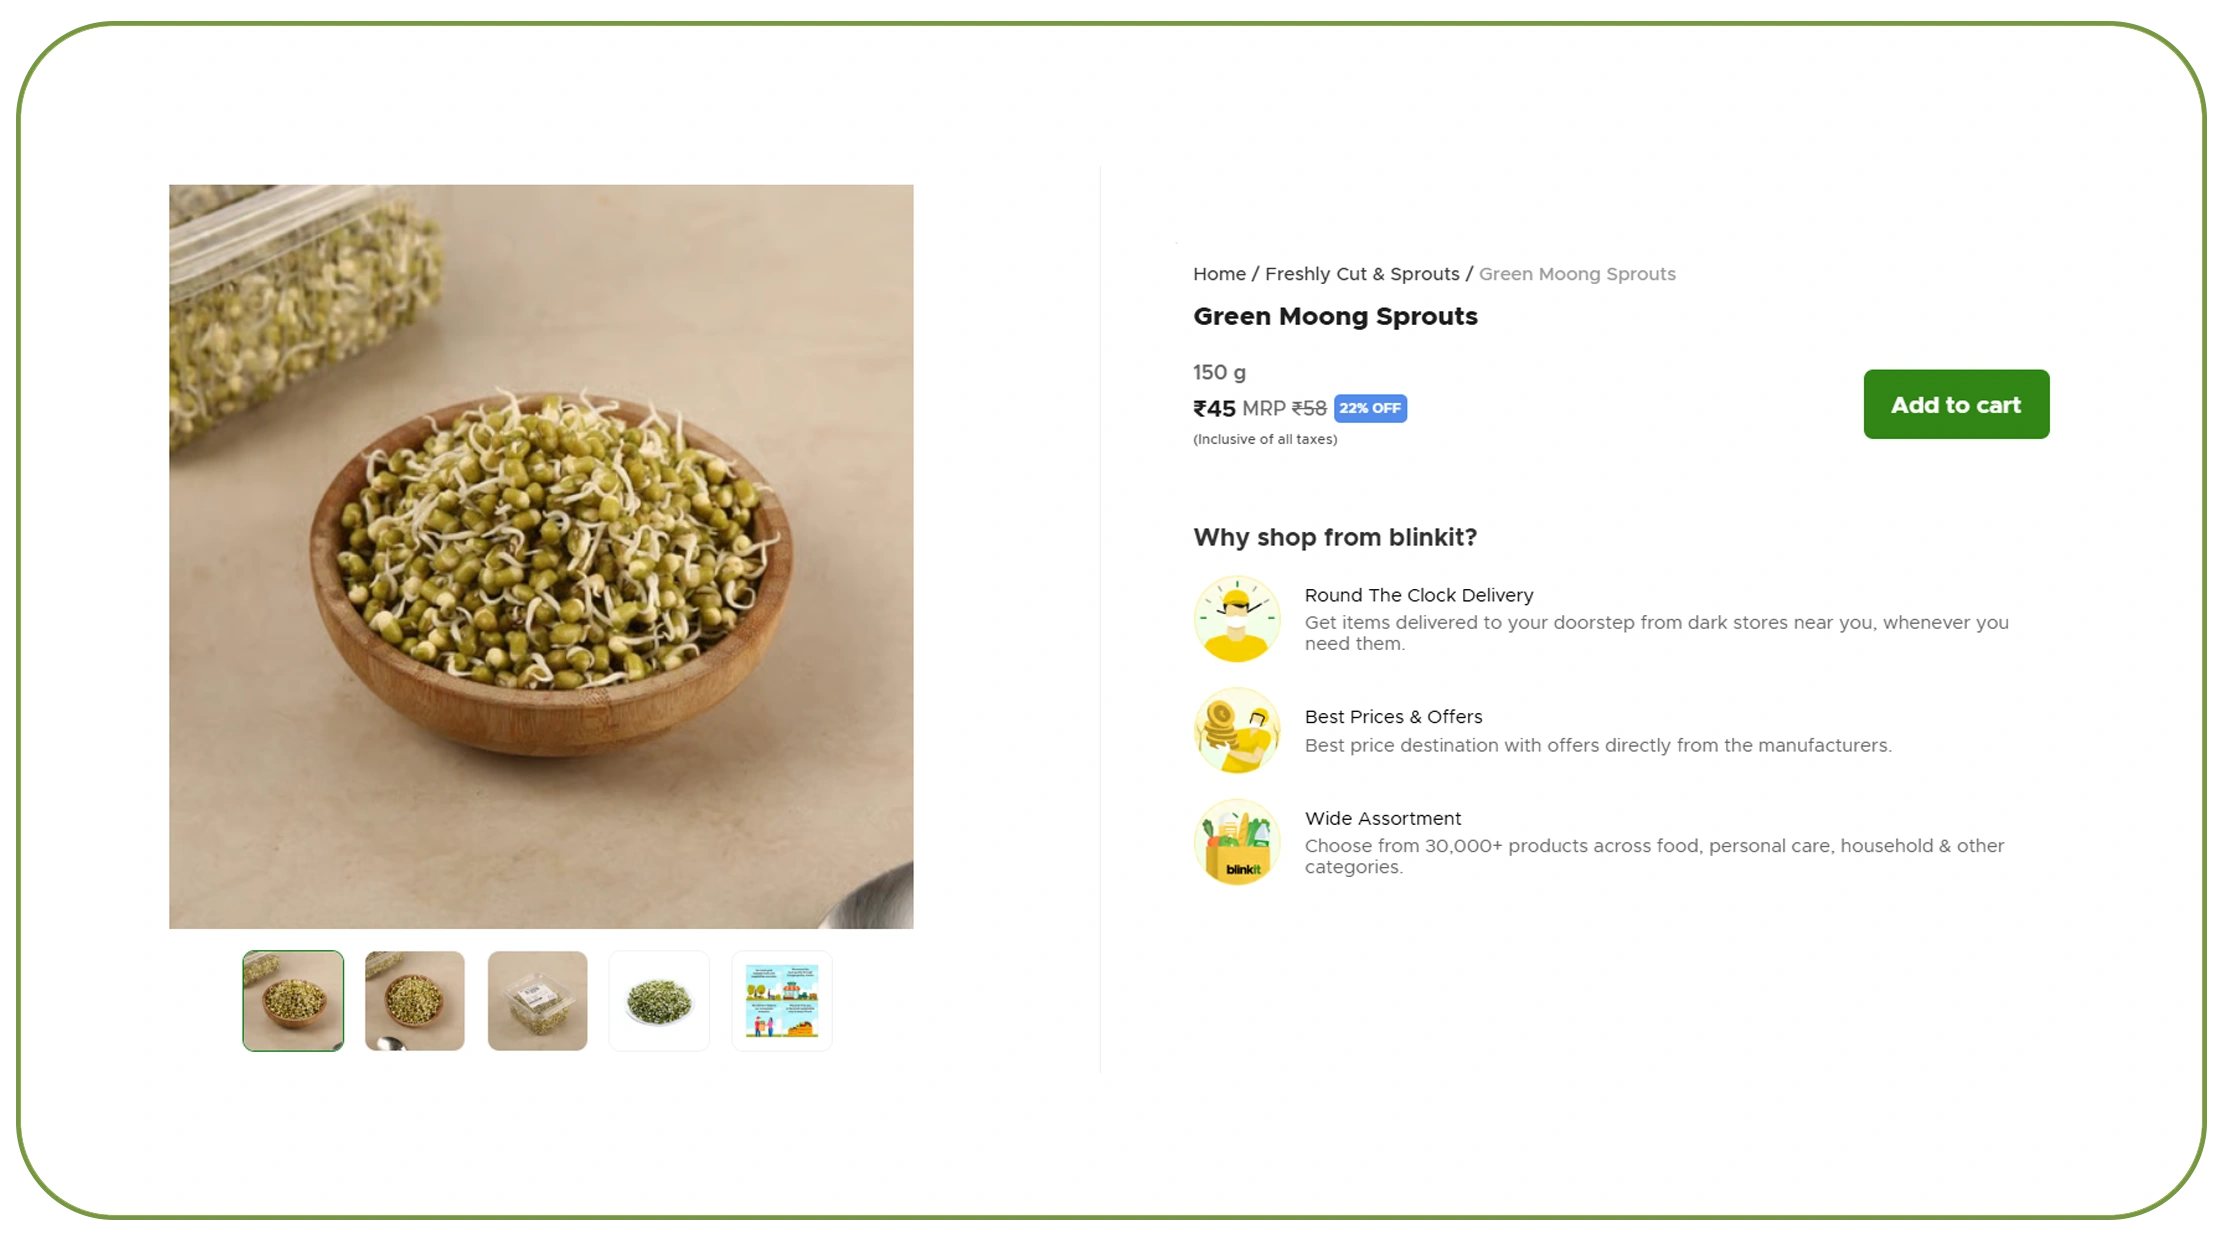
Blinkit grocery data extraction, Blinkit grocery dataset workflows can give market researchers and brands a consistent way to organize marketplace observations for comparative analysis.
A robust extraction pipeline generally includes discovery, collection, parsing, normalization, validation, deduplication, timestamping, storage, and delivery. Each stage contributes to data reliability.
For example, two products may have slightly different titles but represent the same underlying SKU. A normalization layer can standardize product names, brands, pack sizes, and categories so analysts can compare like-for-like products.
Suggested Analytical Outputs
| Output | Calculation | Business Question |
|---|---|---|
| Price index | Brand price ÷ benchmark price | How does pricing compare? |
| Availability rate | Available observations ÷ total observations | How consistently is a SKU visible? |
| Assortment share | Brand SKUs ÷ tracked category SKUs | How broad is the assortment? |
| Discount frequency | Discount observations ÷ total observations | How often are promotions visible? |
| New-SKU rate | New products ÷ total products | How quickly is assortment changing? |
| Price-change rate | Changed prices ÷ tracked products | How dynamic is pricing? |
The 2020–2026 period is especially useful for demonstrating why historical data matters. Quick commerce has shifted from relatively limited grocery selection toward broad, multi-category digital storefronts. In 2024, Blinkit said some locations offered up to 25,000 unique SKUs, with growth extending beyond FMCG, fruits and vegetables, and staples into electronics, beauty, pet care, and toys.
By 2025, Blinkit's reported network had reached 1,301 stores, while its orders reached 424 million for the fiscal year. In 2026, Eternal's corporate page reports more than 2,400 stores across 300+ cities.
For market researchers, this creates opportunities to build longitudinal datasets covering product assortment, category depth, price movements, and availability patterns.
The most useful output is therefore not a raw collection of pages. It is a validated historical dataset that can feed pricing dashboards, category reports, competitor monitoring systems, and research models.
Turn recurring marketplace observations into structured grocery intelligence with scalable extraction, validation, and analytics-ready delivery!
Get Insights Now!How can frequently refreshed pricing data improve quick-commerce decisions?
Real-time Blinkit grocery product data prices can support businesses that need more frequent visibility into changing prices, promotions, product availability, and assortment.
"Real-time" should be defined according to the business requirement. A daily dataset may be sufficient for strategic market research, while pricing teams monitoring volatile categories may require multiple observations per day.
Frequency-Based Monitoring Model
| Monitoring Requirement | Suggested Frequency |
|---|---|
| Strategic market research | Monthly |
| Tactical competitor analysis | Weekly |
| Availability tracking | Daily |
| Operational price monitoring | Multiple times daily |
| Promotion monitoring | Event-based |
| High-frequency pricing | Custom schedule |
These frequencies are recommended operating models rather than reported Blinkit statistics.
The need for frequent monitoring is connected to the scale and speed of the sector. In 2024, Blinkit reported 130% year-on-year growth in gross order value to ₹4,923 crore in the June quarter. The company also reported an increase in average store-level throughput and significant expansion in product selection.
In FY25, reported orders reached 424 million, more than double the 203 million recorded in FY24. Such growth increases the importance of understanding what consumers can actually see and purchase at different points in time.
For pricing teams, timestamps are essential. A price without a timestamp is only a snapshot. A sequence of time-stamped prices becomes a price history.
The same principle applies to availability. If a product is unavailable today but available tomorrow, the dataset should preserve both observations. This can help distinguish persistent stock issues from short-lived availability changes.
Location can add another dimension. Quick-commerce availability may vary by service area, store, and market. A multi-location monitoring system can therefore support geographic assortment and pricing comparisons.
The outcome is a more practical intelligence layer for teams responsible for pricing, category management, digital shelf monitoring, and competitive research.
How can a historical dataset reveal product and pricing patterns?
A Blinkit Grocery Dataset can provide a structured foundation for comparing products, prices, promotions, availability, and assortment changes across observation periods.
The dataset becomes particularly useful when each observation contains a timestamp and a consistent product identifier. This allows analysts to distinguish between a genuinely new SKU and a product that has simply changed its title or presentation.
Example Historical Intelligence Structure
| Period | Core Analysis | Potential Business Output |
|---|---|---|
| 2020–2021 | Digital grocery assortment | Market baseline |
| 2022 | Platform transition | Marketplace history |
| 2023 | Store and order expansion | Assortment tracking |
| 2024 | Selection growth | Category intelligence |
| 2025 | Network scale | Price and availability monitoring |
| 2026 | Broad geographic footprint | Multi-location intelligence |
Historical figures provide useful context. Eternal's reported data shows Blinkit's order count increasing from 119 million in FY23 to 203 million in FY24 and 424 million in FY25. The number of stores increased from 377 in FY23 to 526 in FY24 and 1,301 in FY25.
Current company information reports more than 2,400 stores across 300+ cities and more than 31 million monthly customers. These figures illustrate the scale at which product intelligence may need to operate.
For an FMCG company, a historical dataset can reveal whether its products are consistently listed, whether pack-size availability changes, and whether competitors enter or leave a category.
For retailers, it can support category benchmarking. Analysts can group products by brand, pack size, category, price range, or promotional status.
For investors and market researchers, structured historical records can complement broader market reports by providing product-level evidence.
A well-designed dataset should also maintain source URLs, timestamps, and collection metadata. These fields improve traceability and make it easier to investigate unexpected observations.
What should businesses look for in a product-data monitoring system?
A Blinkit Product Data Scraper should be evaluated as a complete data pipeline rather than simply as a tool that retrieves web pages.
The most important capabilities are scalability, structured extraction, validation, scheduling, historical storage, and delivery. A reliable system should also accommodate changing page structures and different product attributes.
Recommended Technical Capabilities
| Capability | Business Value |
|---|---|
| Automated collection | Reduces manual monitoring |
| Product-level extraction | Supports SKU analysis |
| Price capture | Enables pricing intelligence |
| Availability capture | Supports stock visibility |
| Timestamping | Creates historical records |
| Normalization | Improves product comparisons |
| Validation | Reduces data-quality issues |
| Deduplication | Prevents repeated records |
| Scheduled jobs | Enables recurring monitoring |
| API/database delivery | Integrates with analytics systems |
The 2020–2026 evolution shows why scalability matters. Blinkit's network expanded from hundreds of stores to more than 2,400 stores reported by Eternal in 2026. In FY25 alone, the company reported 1,301 stores and 424 million orders.
At the same time, quick-commerce competition has become increasingly focused on store density, utilization, assortment, and operational efficiency. In 2025, reporting on the sector highlighted a shift toward using existing stores more efficiently after a period of rapid network expansion.
This makes structured data useful for more than price comparison. Businesses can study assortment depth, product availability, geographic differences, promotional patterns, and changes in category composition.
For technical teams, the final architecture should separate collection from storage and analytics. This makes it easier to update the collection layer without rebuilding downstream dashboards.
A scalable solution can also support multiple markets, categories, and monitoring frequencies. The result is a reusable data infrastructure rather than a one-off scraping exercise.
Why Choose Real Data API?
Blinkit Product Data Scraping becomes more valuable when collection is combined with normalization, validation, scheduling, historical storage, and structured delivery.
Real Data API can support organizations that need recurring product intelligence without building every component of the data pipeline internally.
Key Capabilities to Consider
- Scalable product-data collection
- Scheduled monitoring
- Product and SKU-level fields
- Price and discount tracking
- Availability monitoring
- Category and brand classification
- Data normalization
- Duplicate removal
- Quality validation
- Historical snapshots
- API-ready delivery
- Custom data fields
- Analytics-ready datasets
A buyer should select the collection frequency according to the business problem. Weekly monitoring may work for strategic research, while daily or higher-frequency collection may be more appropriate for dynamic pricing and availability use cases.
Historical storage is equally important. Retaining previous observations allows teams to calculate changes rather than merely view current values.
For FMCG brands, this can create a reusable intelligence layer for assortment, pricing, digital shelf, and competitive analysis.
Conclusion
A Blinkit grocery dataset can help businesses move from isolated marketplace observations to structured intelligence covering products, prices, availability, assortment, and quick-commerce trends.
The underlying market has changed significantly from 2020 to 2026. Blinkit's reported network grew from 377 active stores in FY23 to 1,301 in FY25, while annual reported orders increased from 119 million to 424 million over the same period. Eternal's current corporate information reports more than 2,400 stores across 300+ cities and more than 31 million monthly customers.
This expansion makes structured, repeatable marketplace monitoring increasingly relevant for FMCG companies, retailers, category managers, pricing teams, and market researchers.
The practical objective is not simply to collect more data. It is to create consistent historical observations that can be validated, compared, analyzed, and integrated into business workflows.
Build a scalable quick-commerce intelligence pipeline with structured product, pricing, availability, and historical data designed for your business needs — partner with Real Data API!
FAQs
What is Blinkit grocery data collection useful for?
It helps brands and retailers monitor product listings, prices, availability, categories, pack sizes, and marketplace changes for recurring competitive and assortment analysis.
Why should businesses scrape Blinkit grocery product data?
Structured product information can support pricing comparisons, SKU monitoring, promotional analysis, availability tracking, category research, and historical marketplace intelligence.
How does Blinkit grocery data extraction support FMCG brands?
It can organize product-level observations into consistent records, allowing brands to analyze assortment visibility, pricing changes, availability patterns, and competitive marketplace activity.
How frequently should companies monitor real-time Blinkit grocery product data prices?
Frequency depends on business needs. Daily collection suits regular monitoring, while higher-frequency schedules can support dynamic pricing and promotion-sensitive categories.
What can a Blinkit Product Data Scraper collect?
A scraper can collect publicly visible product attributes such as names, brands, categories, pack sizes, prices, discounts, availability, URLs, and timestamps when technically accessible.
Latest posts

How Louis Vuitton Fashion Dataset Enables Better Analysis of Luxury Products, Prices, Brands, and Fashion Trends?
How Blinkit Grocery Dataset Enables Smarter Analysis of Products, Prices, Availability, and Quick-Commerce Trends?
How Chanel Fashion Dataset Enables Smarter Analysis of Luxury Products, Prices, Categories, and Fashion Trends?
How Foodpanda Food Dataset Helps Businesses Track Restaurants, Menus, Prices, Ratings, and Food Delivery Trends?






.png)



