
TL;DR
- IKEA e-commerce dataset gives retailers, brands, analysts, and researchers structured visibility into products, prices, categories, availability, and assortment movements across IKEA's digital catalog.
- IKEA Product Data Scraping can transform changing online catalog information into historical, analysis-ready records for pricing intelligence, category research, competitor benchmarking, and retail trend analysis.
Introduction
IKEA's digital retail ecosystem has become an increasingly important source of product, pricing, category, and consumer-facing retail intelligence. In FY25, IKEA reported EUR 44.6 billion in global retail sales, 915 million store visits, and online sales representing 28% of total IKEA turnover. IKEA also opened 66 new sales locations during the year.
For businesses studying home-furnishing retail, an IKEA e-commerce dataset can provide a structured way to monitor product names, categories, prices, availability, specifications, and other publicly visible attributes.
At the same time, Ikea Product Data Scraping can help convert frequently changing catalog information into organized records. Instead of relying on isolated manual checks, businesses can maintain historical observations and analyze how products, prices, categories, and availability change over time.
This article explains how structured IKEA e-commerce data can solve practical challenges around product intelligence, pricing analysis, category benchmarking, competitive research, and retail trend identification.
How Can Digital Catalog Data Improve Retail Intelligence?
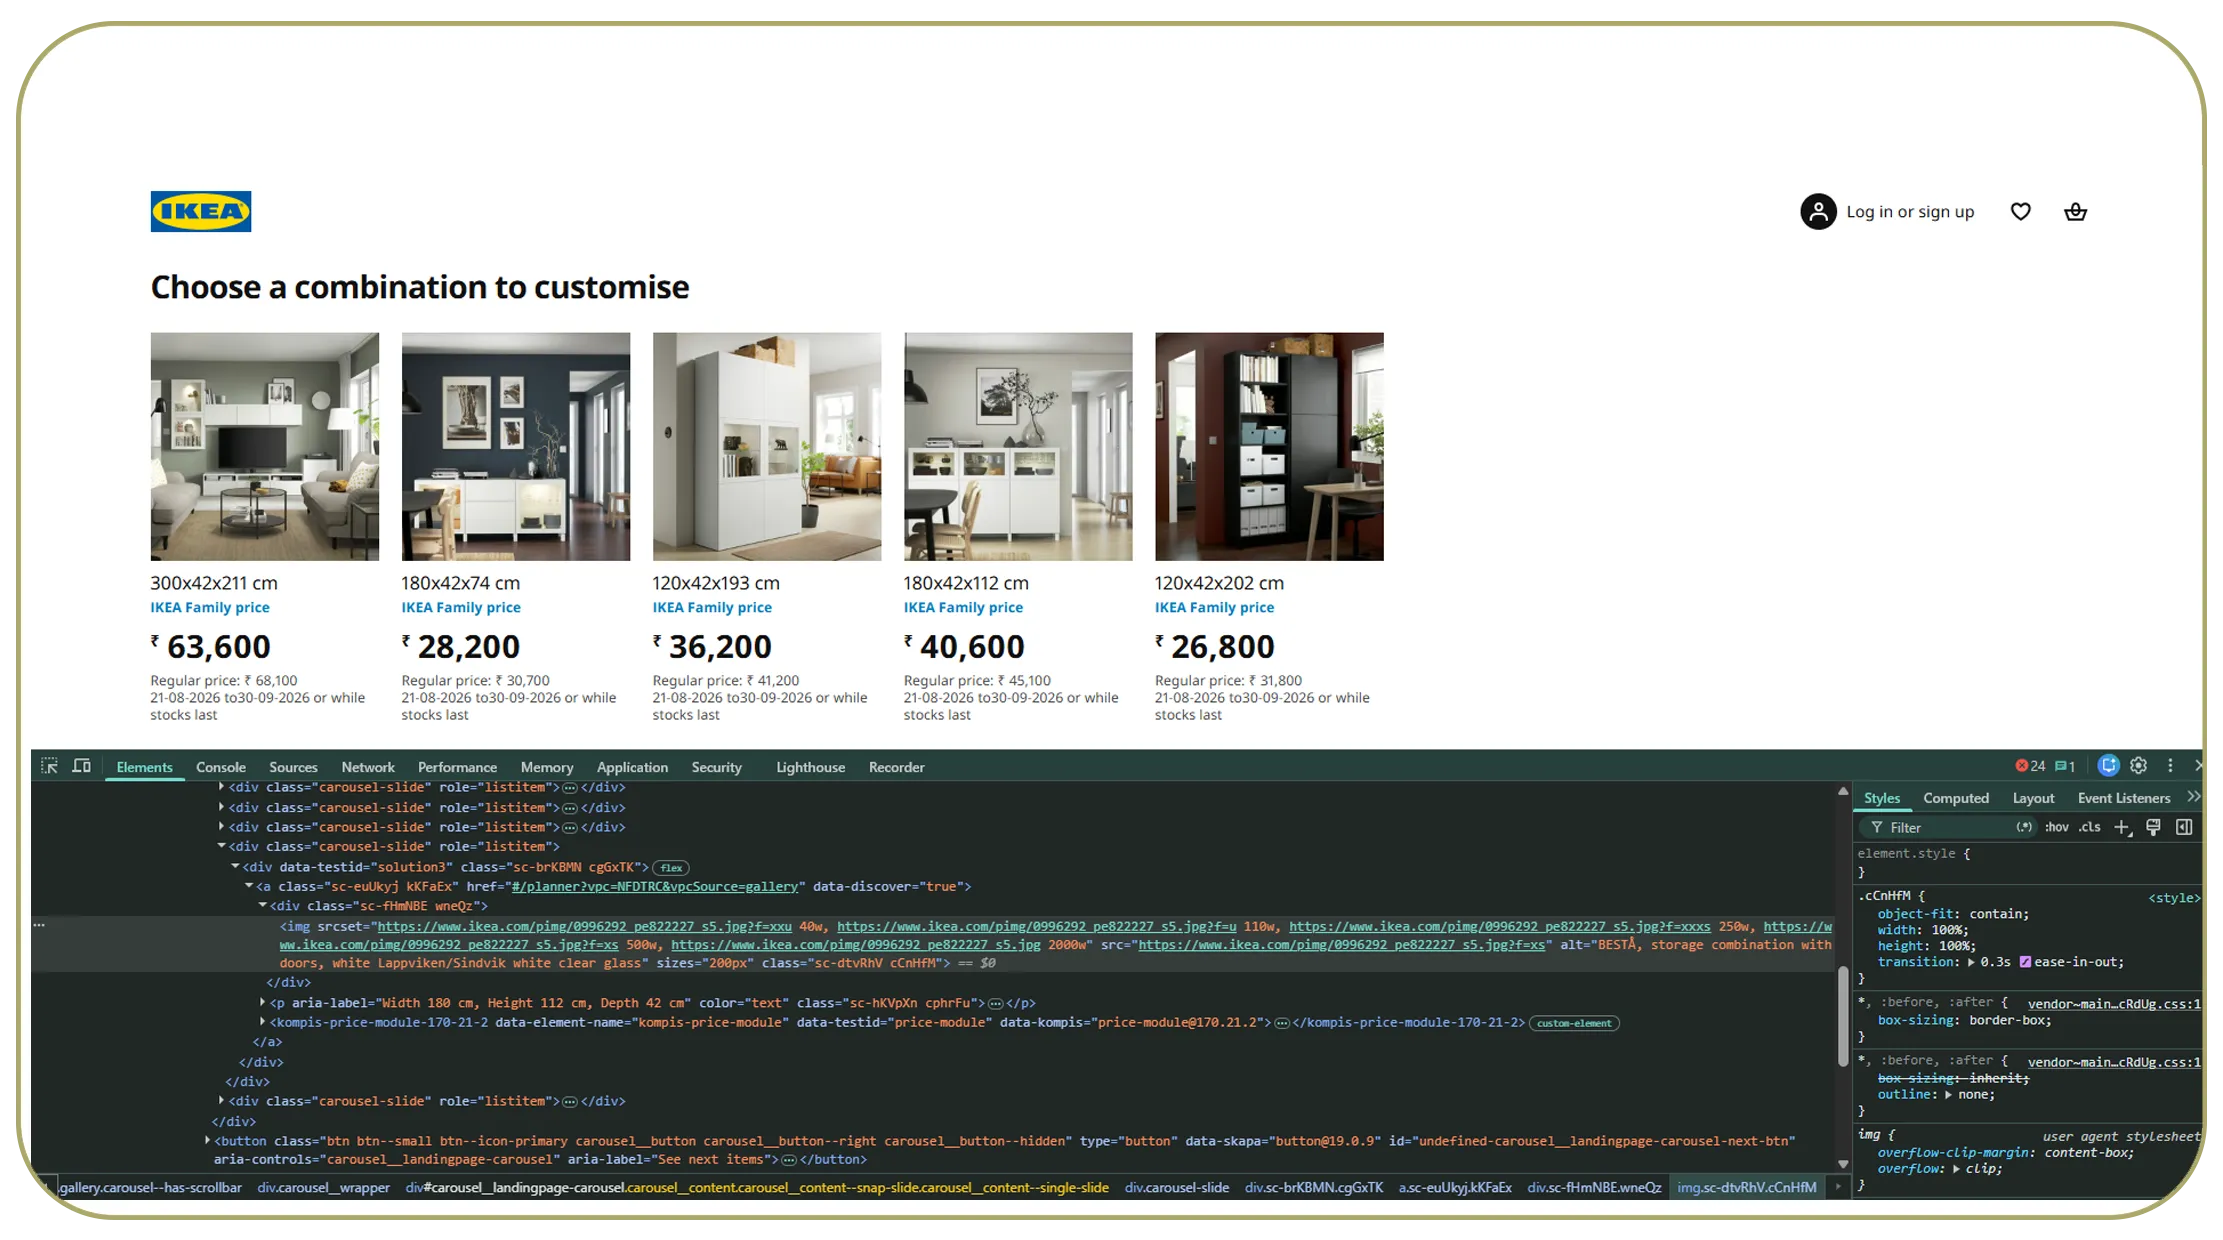
IKEA e-commerce data web scraping can help businesses collect product-level information from IKEA's online retail environment and organize it into a consistent analytical structure.
The value is not simply in collecting product pages. A useful dataset connects multiple attributes, including product name, product ID or SKU where available, category, subcategory, price, promotional price, product description, dimensions, material information, availability, ratings where available, and product URL.
This structure enables analysts to move beyond individual product observations and identify patterns across thousands of listings.
| Data Attribute | Intelligence Use |
|---|---|
| Product name | Product identification |
| SKU/Product ID | Record matching |
| Category | Category-level analysis |
| Price | Price benchmarking |
| Discount | Promotion analysis |
| Availability | Stock visibility |
| Dimensions | Product comparison |
| Materials | Attribute analysis |
2020–2026 Perspective
IKEA's digital transformation accelerated during the pandemic period. In FY20, global IKEA retail sales were EUR 39.6 billion, rising to EUR 41.9 billion in FY21 and EUR 44.6 billion in FY22. IKEA reported that FY22 online channels received 4.3 billion visits, although online sales were 10% lower than FY21 as physical stores reopened.
In FY23, total IKEA retail sales reached EUR 47.6 billion, while online sales stabilized at 23% of sales. FY24 brought another major digital milestone: online sales represented 26% of total IKEA sales after the company lowered prices across 63 markets.
In FY25, online sales increased to 28% of IKEA turnover, demonstrating the continued relevance of digital channels.
For businesses, this evolution means online catalog data can provide an important complementary view of IKEA's retail activity. Historical collection also makes it possible to distinguish temporary catalog changes from longer-term product and pricing trends.
What Information Should Businesses Collect From the Online Catalog?
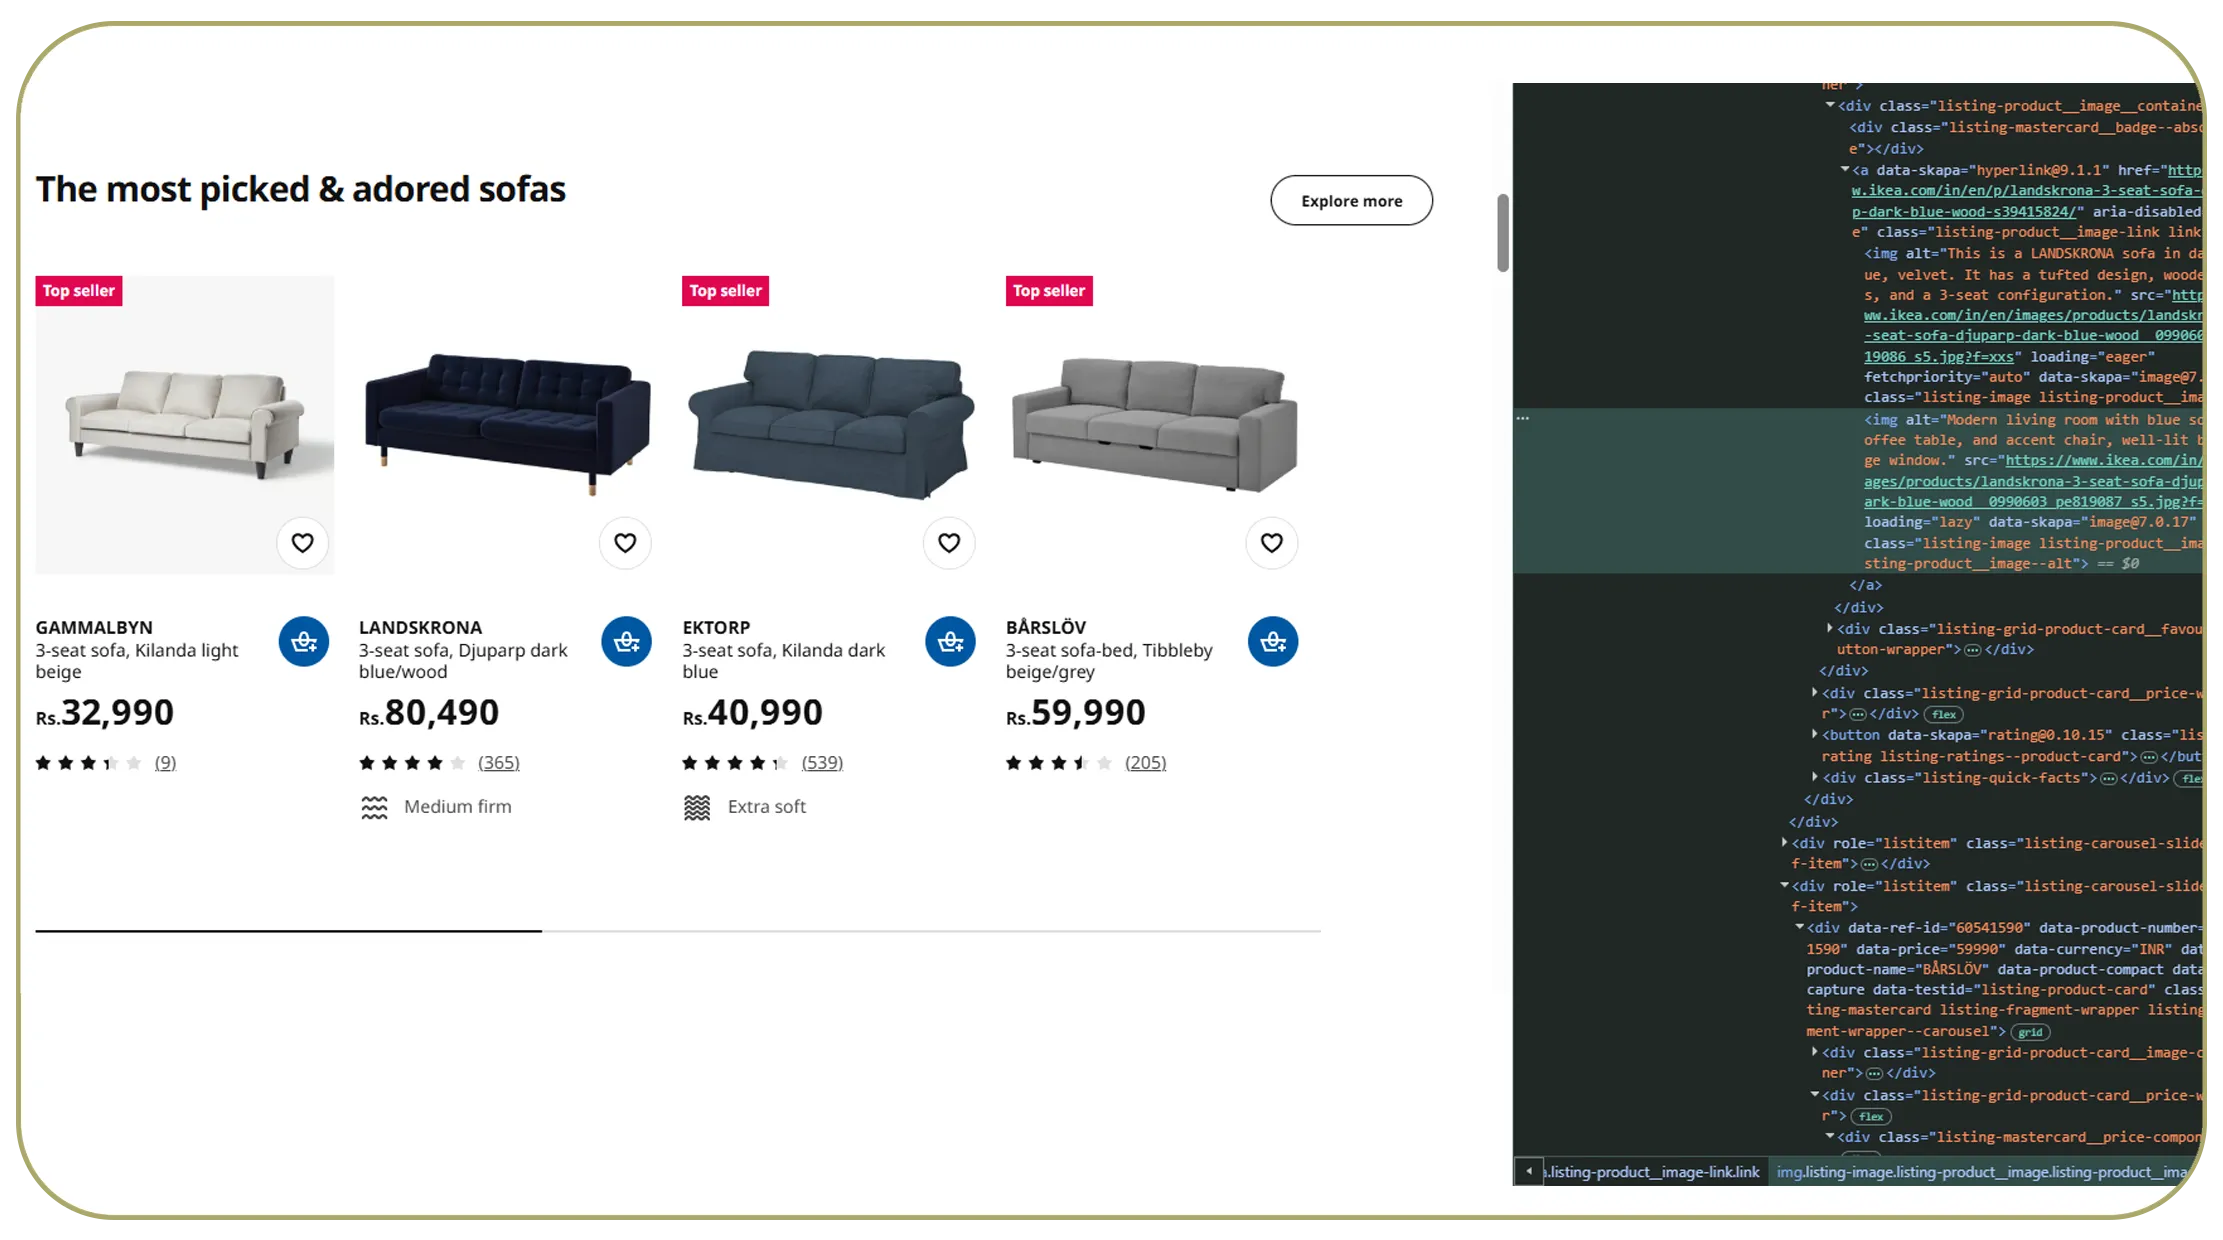
Businesses that extract IKEA e-commerce data can create a product intelligence layer covering the fields most relevant to their research objectives.
A basic dataset may focus on product name, category, price, and availability. A more advanced dataset can include dimensions, color, material, ratings, product descriptions, promotional information, and other accessible attributes.
The right data structure depends on the intended use. Pricing teams may prioritize price histories and promotions, while category managers may require assortment, product attributes, and availability information.
Recommended Data Structure
| Dataset Layer | Example Fields | Business Application |
|---|---|---|
| Product | Name, SKU, URL | Product tracking |
| Pricing | Current price, sale price | Price benchmarking |
| Category | Department, category, subcategory | Category intelligence |
| Attributes | Size, color, material | Product comparison |
| Availability | In stock/out of stock | Availability monitoring |
| Customer signals | Ratings, reviews | Product research |
| Time | Collection date | Historical analysis |
2020–2026 Perspective
The changing share of IKEA's digital business highlights why structured collection matters. FY22 online sales represented 22% of IKEA product sales, while FY23 online sales were 23%. FY24 increased to 26%, and FY25 reached 28% of total IKEA turnover.
IKEA U.S. provides another illustration of this digital expansion. Its FY23 annual summary reported more than $6.3 billion in total sales, a 3.3% increase in ecommerce, and more than 525 million online visits. In FY24, IKEA U.S. reported approximately $1.95 billion in ecommerce sales.
In FY25, IKEA U.S. reported $5.3 billion in total sales, including $1.9 billion in ecommerce sales, and announced plans for four additional U.S. stores in 2026 on top of six previously announced locations.
These developments create a larger digital footprint for product and pricing analysis.
Why Is Fresh Product Information Important?
Real-Time IKEA Product Data can help businesses identify changes in product availability, pricing, assortment, and catalog status with less delay.
Retail data becomes less useful when it is treated as a permanent snapshot. Products may be added, removed, repriced, temporarily unavailable, or reorganized into different categories. A recurring data collection process creates a timeline of these changes.
For example, a retailer comparing storage products may want to know whether a particular product's price changed after a competitor launched a promotion. A furniture manufacturer may want to monitor category-level price movements. A market researcher may need to identify newly introduced products.
What Can Fresh Data Reveal?
| Change | Potential Insight |
|---|---|
| Price increase | Pricing movement |
| Price decrease | Affordability/competitive signal |
| Product launch | Assortment expansion |
| Product removal | Catalog change |
| Stock status change | Availability movement |
| Category change | Merchandising structure |
2020–2026 Perspective
The pandemic period demonstrated how quickly retail conditions could change. In FY22, IKEA reported that supply-chain shortages made it difficult to keep shelves full while inflation and cost pressures affected prices.
By FY24, IKEA had substantially lowered prices across 63 markets, and the company reported a 21% increase in online visitation alongside a 4.5% increase in store visitation.
FY25 showed the effect of the affordability strategy continuing into a broader digital environment. IKEA reported a 3% increase in both sales volumes and customers, while online sales accounted for 28% of turnover.
For analysts, these developments demonstrate why historical and fresh data should be evaluated together. A single price point cannot explain whether a change represents a broader affordability strategy, a product-specific promotion, a category shift, or a temporary catalog event.
Need regularly refreshed IKEA product and pricing information? Real Data API can help businesses build structured data workflows around their specific monitoring requirements.
Get Insights Now!How Can Product Data Strengthen Competitive Research?
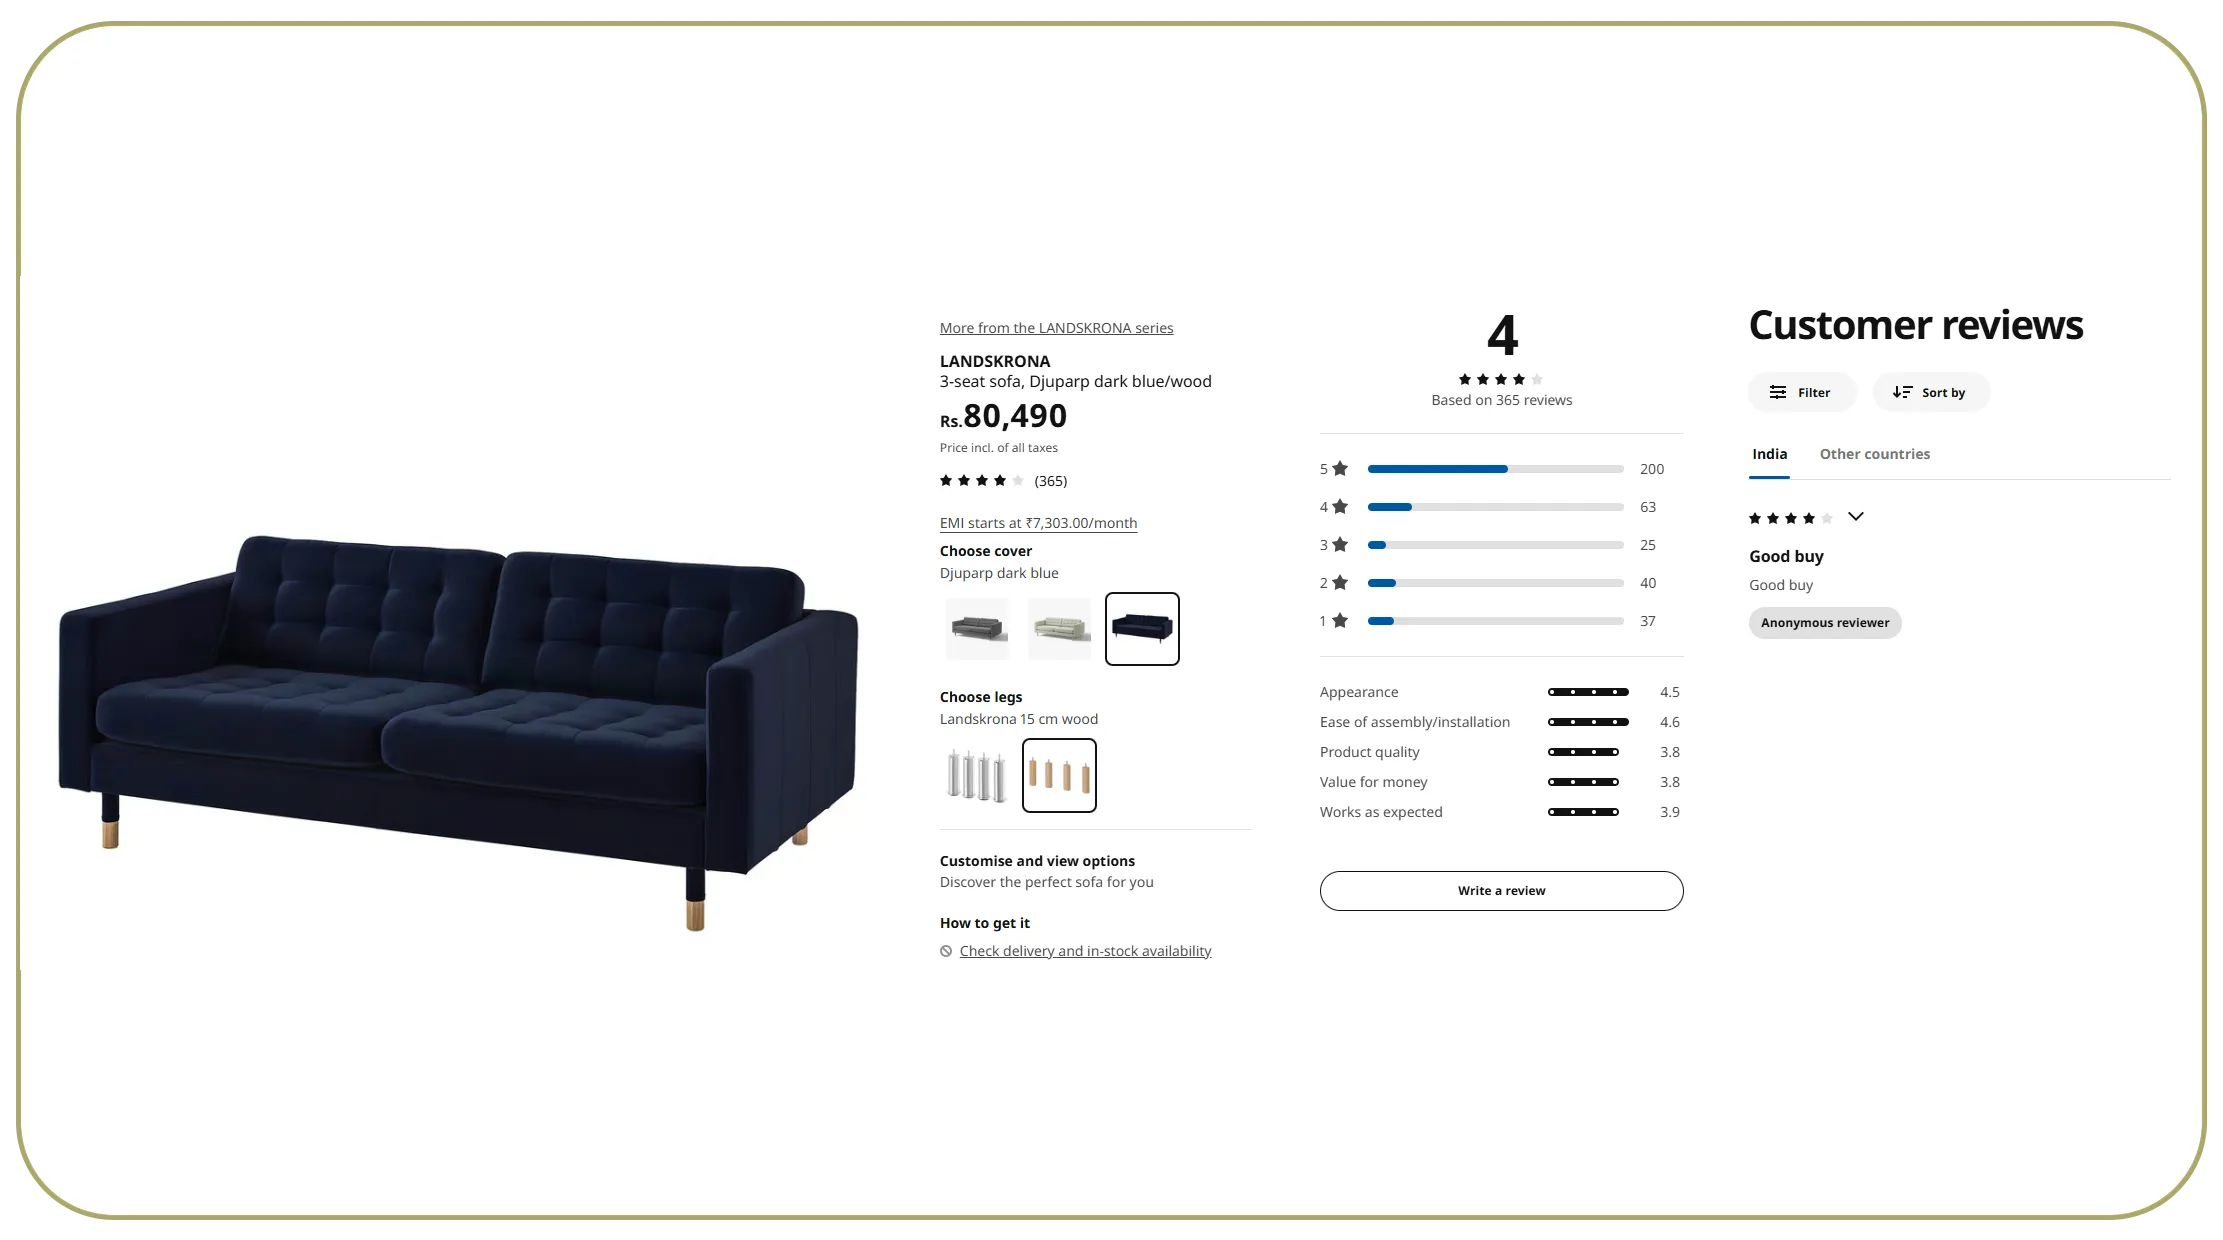
IKEA product data supports competitive analysis when product information is normalized and collected consistently across time.
Although IKEA has a distinctive business model and product assortment, its catalog can still provide useful reference points for businesses operating in furniture, home décor, storage, kitchen, bedroom, office, and lifestyle categories.
Competitive research should not rely on price alone. Businesses can compare product attributes, dimensions, materials, category placement, assortment breadth, promotional activity, and availability.
Useful Comparison Dimensions
| Dimension | Example Question |
|---|---|
| Price | How does the price position change? |
| Product count | How broad is a category? |
| Pack/size | Are products directly comparable? |
| Material | What attributes are emphasized? |
| Category | Which segments receive more attention? |
| Availability | Which products are consistently listed? |
| Promotion | Which products receive discounts? |
2020–2026 Perspective
IKEA's product and channel development during this period provides several useful benchmark points. In FY22, the company reported 38 new IKEA sales locations globally. FY23 saw 71 new IKEA sales locations, with small stores and plan-and-order points playing an important role. FY24 added 56 new sales locations, while FY25 added 66.
The expansion of physical and digital touchpoints means product intelligence can no longer be viewed solely through a traditional store lens. The online catalog provides a standardized digital surface where products can be discovered, categorized, priced, and compared.
For competitive research, the key is to build consistent datasets rather than making isolated observations. This allows analysts to identify category movements, product introductions, price changes, and assortment patterns over time.
How Does Historical Collection Improve Product Intelligence?
IKEA e-commerce data extraction becomes significantly more valuable when every record contains a collection date and can be compared with earlier observations.
Historical datasets enable businesses to answer questions that a current product page cannot answer. These include:
- When did a product first appear?
- How frequently did its price change?
- Was a promotion temporary or recurring?
- Did the product move categories?
- Did availability change seasonally?
- Which categories expanded or contracted?
- Which products disappeared from the catalog?
Historical Data Framework
| Time Dimension | Example Analysis |
|---|---|
| Daily | Price and availability changes |
| Weekly | Promotional movements |
| Monthly | Category trends |
| Quarterly | Assortment evolution |
| Year-over-year | Long-term retail trends |
| Multi-year | Product lifecycle analysis |
2020–2026 Perspective
The historical IKEA sales trajectory illustrates why longitudinal datasets are useful. Global retail sales increased from EUR 39.6 billion in FY20 to EUR 41.9 billion in FY21 and EUR 44.6 billion in FY22. They reached EUR 47.6 billion in FY23 before moving to EUR 45.1 billion in FY24 and EUR 44.6 billion in FY25.
The FY24 decline was primarily linked to lower prices, according to IKEA, while FY25 saw sales volumes increase 2.6% compared with FY24.
This illustrates an important analytical principle: revenue changes do not automatically indicate reduced product demand. Price, volume, store visitation, online activity, and assortment all need to be considered together.
A historical product dataset provides the underlying observations needed to make those distinctions.
What Can a Structured Dataset Reveal About Retail Trends?
An IKEA e-commerce dataset can bring together product, pricing, category, availability, and historical information in one structured analytical layer.
The dataset can be used by multiple teams. Pricing analysts can monitor price movements. Category managers can examine assortment depth. Market researchers can study product trends. E-commerce teams can track digital catalog changes. Competitor intelligence teams can benchmark relevant categories.
Example Analytical Outputs
| Team | Analytical Output |
|---|---|
| Pricing analysts | Price movement tracking and benchmarking |
| Category managers | Assortment depth and composition analysis |
| Market researchers | Product trend and category studies |
| E-commerce teams | Digital catalog change monitoring |
| Competitor intelligence | Category benchmarking and positioning |
2020–2026 Perspective
IKEA's digital share increased from 22% of product sales in FY22 to 23% in FY23, 26% of total sales in FY24, and 28% of turnover in FY25.
The company also reported 915 million store visits in FY25, compared with 899 million in FY24, showing that digital growth has occurred alongside continued physical retail engagement.
For businesses analyzing retail trends, this omnichannel development matters. Digital catalog data should not necessarily be treated as a replacement for store-level information. Instead, it can provide a complementary source for understanding product visibility, pricing, assortment, and customer-facing retail changes.
A well-maintained dataset can therefore become a foundation for dashboards, trend reports, alerts, benchmarking studies, and category intelligence.
Why Choose Real Data API?
IKEA e-commerce dataset solutions are most useful when the collection process is scalable, structured, and aligned with a specific business objective.
Real Data API can help businesses develop customized workflows for collecting and organizing e-commerce product information. The focus can be placed on the fields, categories, geographic markets, and collection frequency relevant to the client's use case.
Flexible Data Collection
Businesses can define the product attributes they need, including names, prices, categories, descriptions, dimensions, availability, ratings, and other publicly accessible information.
Structured and Analysis-Ready Data
Collected information can be normalized into consistent fields, making it easier to compare products across categories and historical periods.
Recurring Monitoring
Businesses can establish recurring collection schedules to maintain current datasets and identify changes in product and pricing information.
Historical Intelligence
Date-stamped records can support trend analysis and historical comparisons instead of limiting analysis to a single snapshot.
Business-Focused Delivery
Data can be structured for pricing research, product intelligence, category analysis, competitor research, market studies, and internal analytics workflows.
For businesses that require a scalable approach to e-commerce intelligence, Real Data API can help convert changing online catalog information into a reusable data asset.
Conclusion
An IKEA E-Commerce Dataset can help businesses understand products, prices, categories, availability, and retail trends through structured, historical information. IKEA's own FY20–FY25 figures demonstrate the increasing role of digital commerce, with online sales reaching 28% of total turnover in FY25.
An IKEA API can be useful where an appropriate authorized data interface is available, while an IKEA Scraper can support collection workflows for publicly accessible web information where permitted.
For organizations building product intelligence, pricing benchmarks, category research, and competitive datasets, the focus should be on consistent collection, normalization, validation, and historical tracking.
Need structured IKEA product, price, category, and retail trend data? Contact Real Data API to build a customized e-commerce data solution for your business!
FAQs
What is an IKEA e-commerce dataset used for?
An IKEA e-commerce dataset can support product research, pricing analysis, assortment tracking, category benchmarking, availability monitoring, and historical retail trend analysis.
How does Ikea Product Data Scraping work?
Ikea Product Data Scraping collects publicly accessible product information and organizes fields such as names, prices, categories, specifications, and availability into structured records for analysis.
Why is IKEA e-commerce data web scraping useful?
IKEA e-commerce data web scraping can help businesses monitor changing catalog information at scale, creating consistent observations for product, pricing, and category research.
How can businesses extract IKEA e-commerce data?
Businesses can extract IKEA e-commerce data through a structured collection workflow designed around required fields, collection frequency, validation, normalization, and historical storage. Real Data API can support such data workflows.
Can Real-Time IKEA Product Data support ongoing monitoring?
Yes. Real-Time IKEA Product Data can support recurring monitoring of selected products, prices, availability, and catalog changes, subject to source accessibility and applicable terms.
Latest posts
How Foodpanda Food Dataset Helps Businesses Track Restaurants, Menus, Prices, Ratings, and Food Delivery Trends?
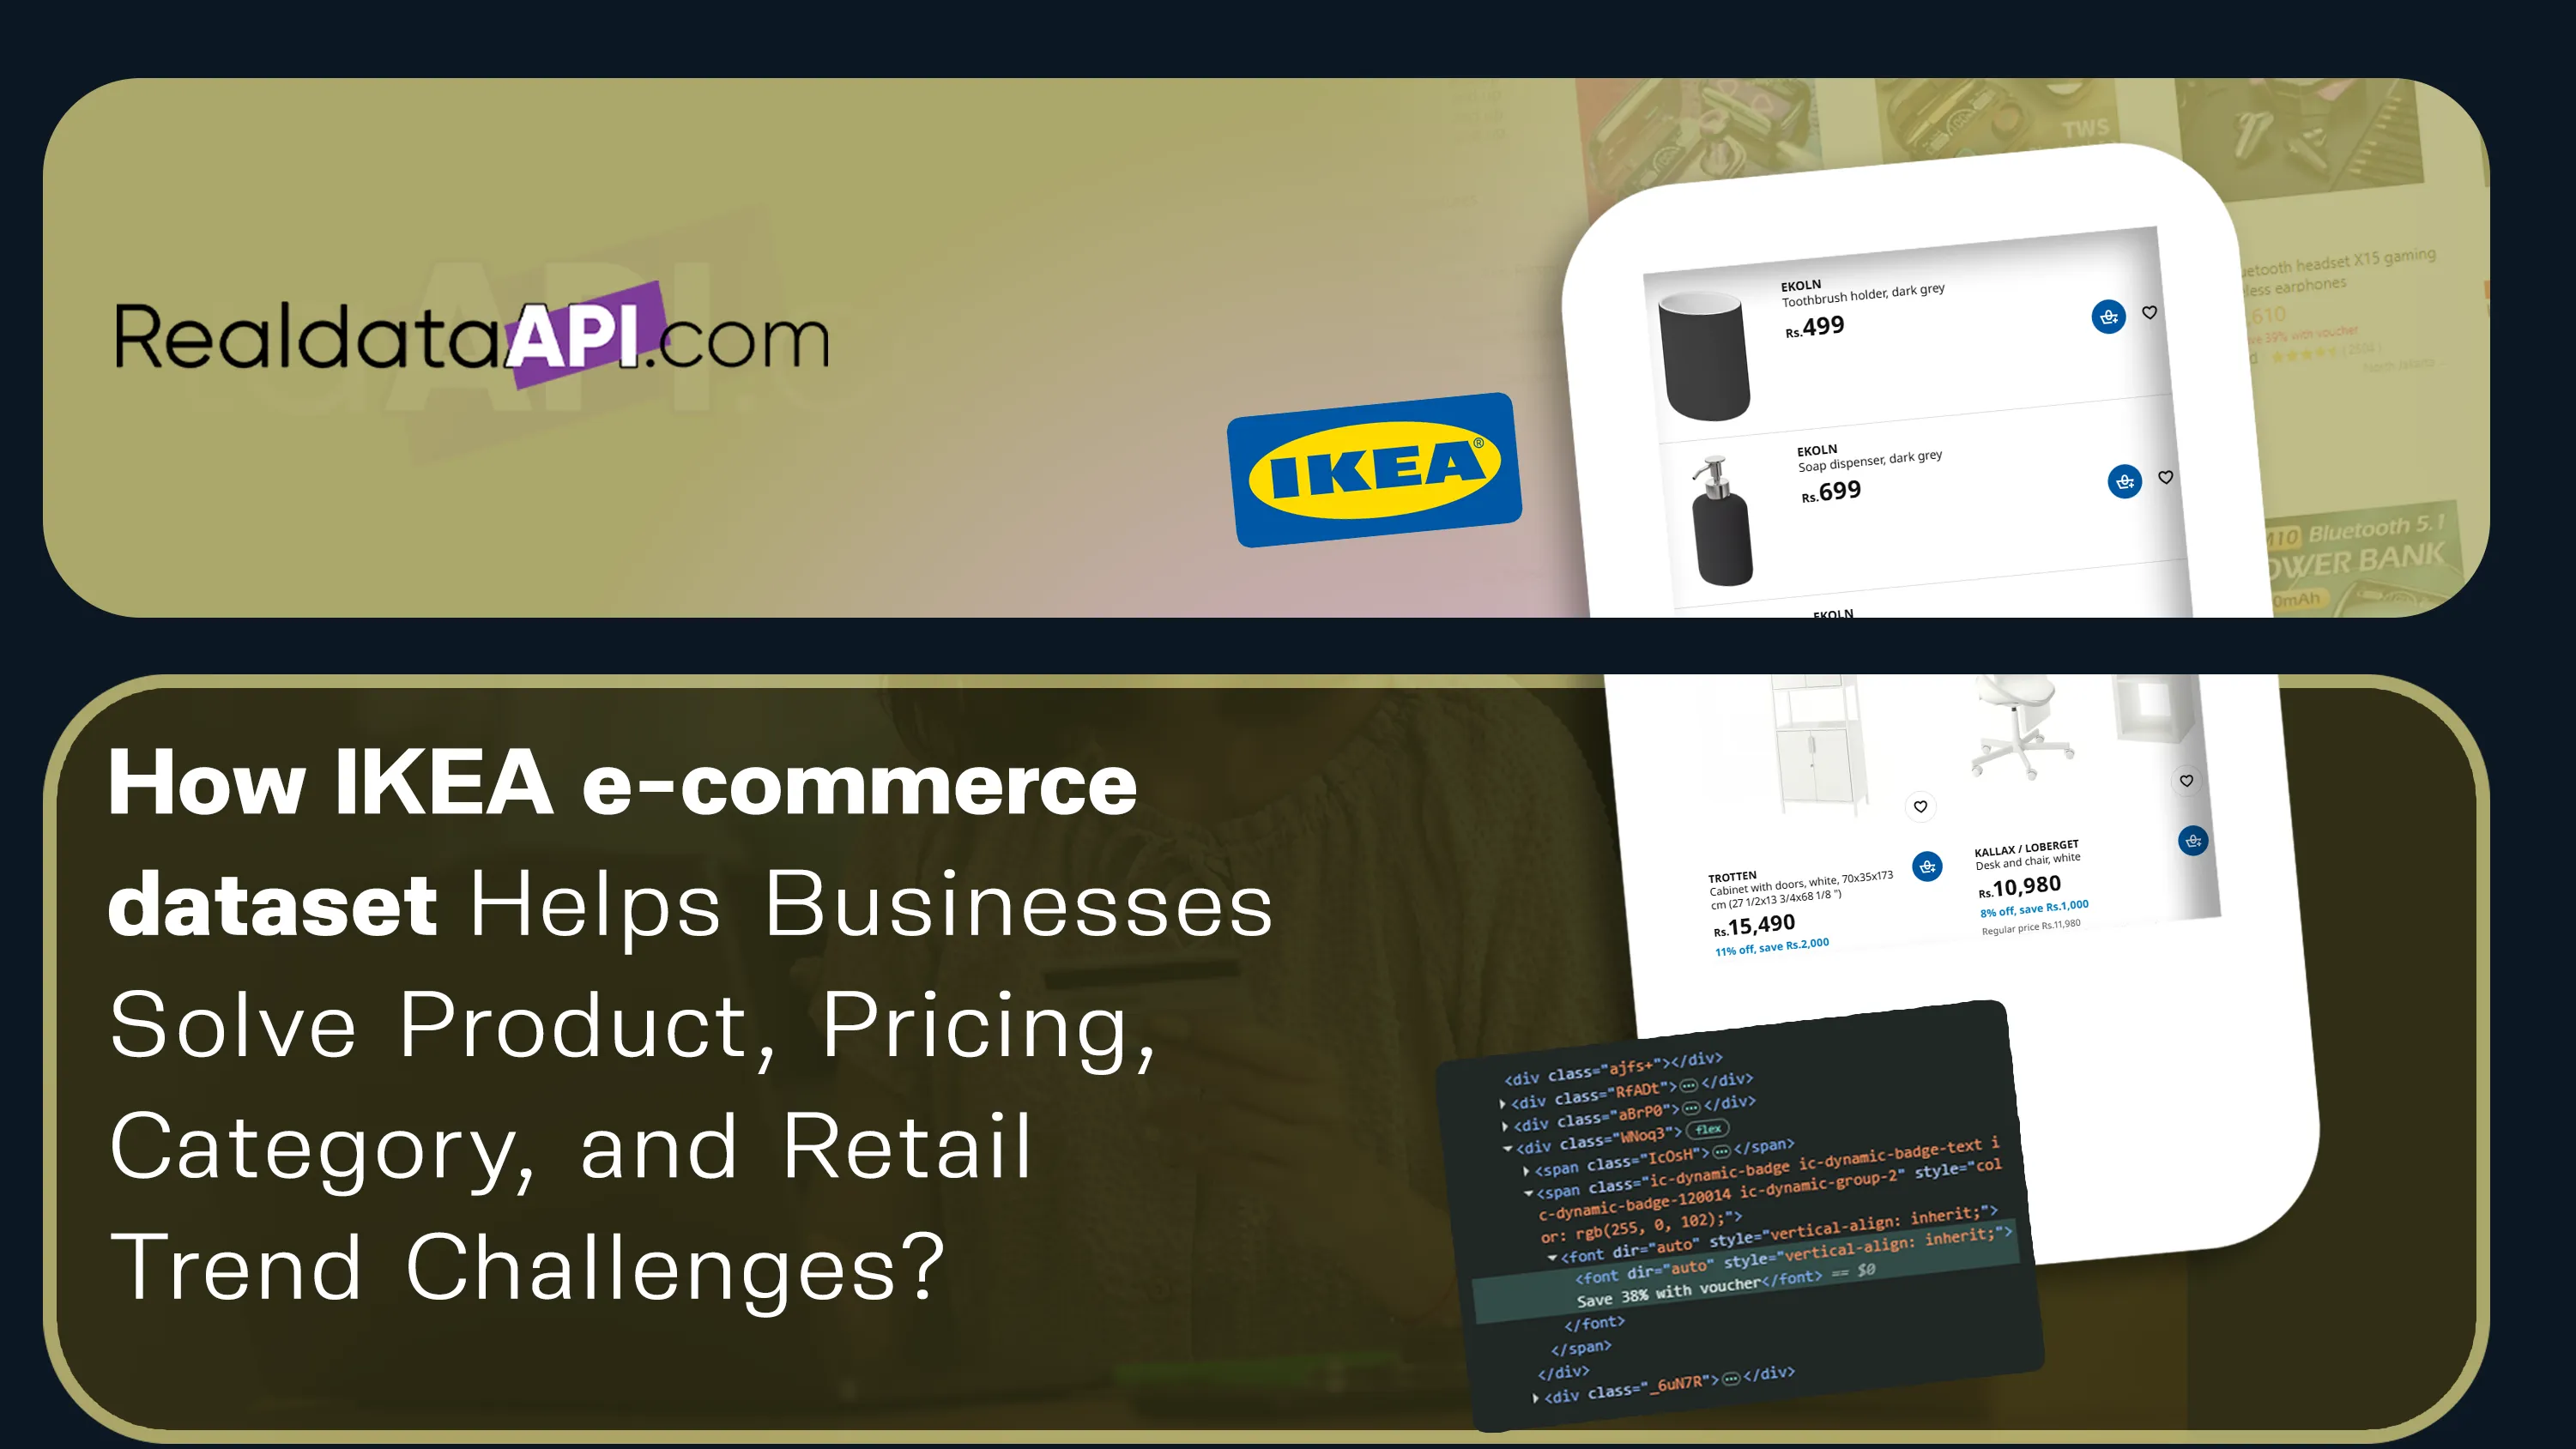
How IKEA E-commerce Dataset Helps Businesses Solve Product, Pricing, Category, and Retail Trend Challenges?
How Target e-commerce dataset Helps Brands Track Products, Prices, Availability, and Retail Market Trends for Smarter Insights?

How Dior fashion dataset Helps Brands Track Luxury Products, Prices, Collections, and Fashion Trends for Smarter Insights?






.png)



