TL;DR
- Target e-commerce dataset gives retailers, brands, analysts, and marketplaces structured visibility into products, prices, availability, categories, and changing retail conditions.
- Target Product data scraping helps convert publicly accessible product information into organized records for pricing intelligence, assortment monitoring, availability analysis, and competitive research.
- From 2020–2026, Target's digital merchandise sales and store-based fulfillment model have made timely retail data increasingly valuable for businesses seeking historical and current market insights.
Introduction
How can brands understand product assortment, pricing, availability, and retail trends across a large omnichannel retailer? A structured Target e-commerce dataset provides a practical foundation by organizing product information into consistent, analyzable records that can be compared over time.
The need is particularly relevant for retailers, consumer brands, marketplaces, pricing teams, and market researchers. Target operates nearly 2,000 stores in the United States and reported $104.78 billion in net sales for 2025. Its merchandise sales also include digitally originated purchases, which reached $21.1 billion in 2025.
This scale creates a large digital information environment. Product pages can contain names, brands, categories, prices, promotions, ratings, availability signals, descriptions, images, specifications, and other attributes. When captured consistently, these fields can support competitive intelligence and retail market analysis.
Target Product data scraping can help businesses move beyond manually checking individual pages. Automated workflows can collect selected fields at scheduled intervals, normalize them, preserve historical observations, and deliver them into databases or analytics systems.
For a brand monitoring a category such as beauty, food, apparel, home, or household essentials, the business questions are straightforward:
- Which products are currently listed?
- How have prices changed?
- Which products are unavailable?
- Which brands have the widest assortment?
- How frequently does the assortment change?
- Which categories are gaining or losing visibility?
- How does Target's online assortment compare with competitors?
- What retail trends can be identified from historical observations?
Target's own reporting shows why digital and store data should be considered together. In 2025, 97.6% of merchandise sales were fulfilled through stores, including store purchases and digitally originated orders fulfilled through shipping, Order Pickup, Drive Up, and Same-Day Delivery.
For data-driven businesses, this makes consistent product and availability intelligence useful for understanding both digital merchandising and the broader retail environment.
How can brands create a structured view of retail products?
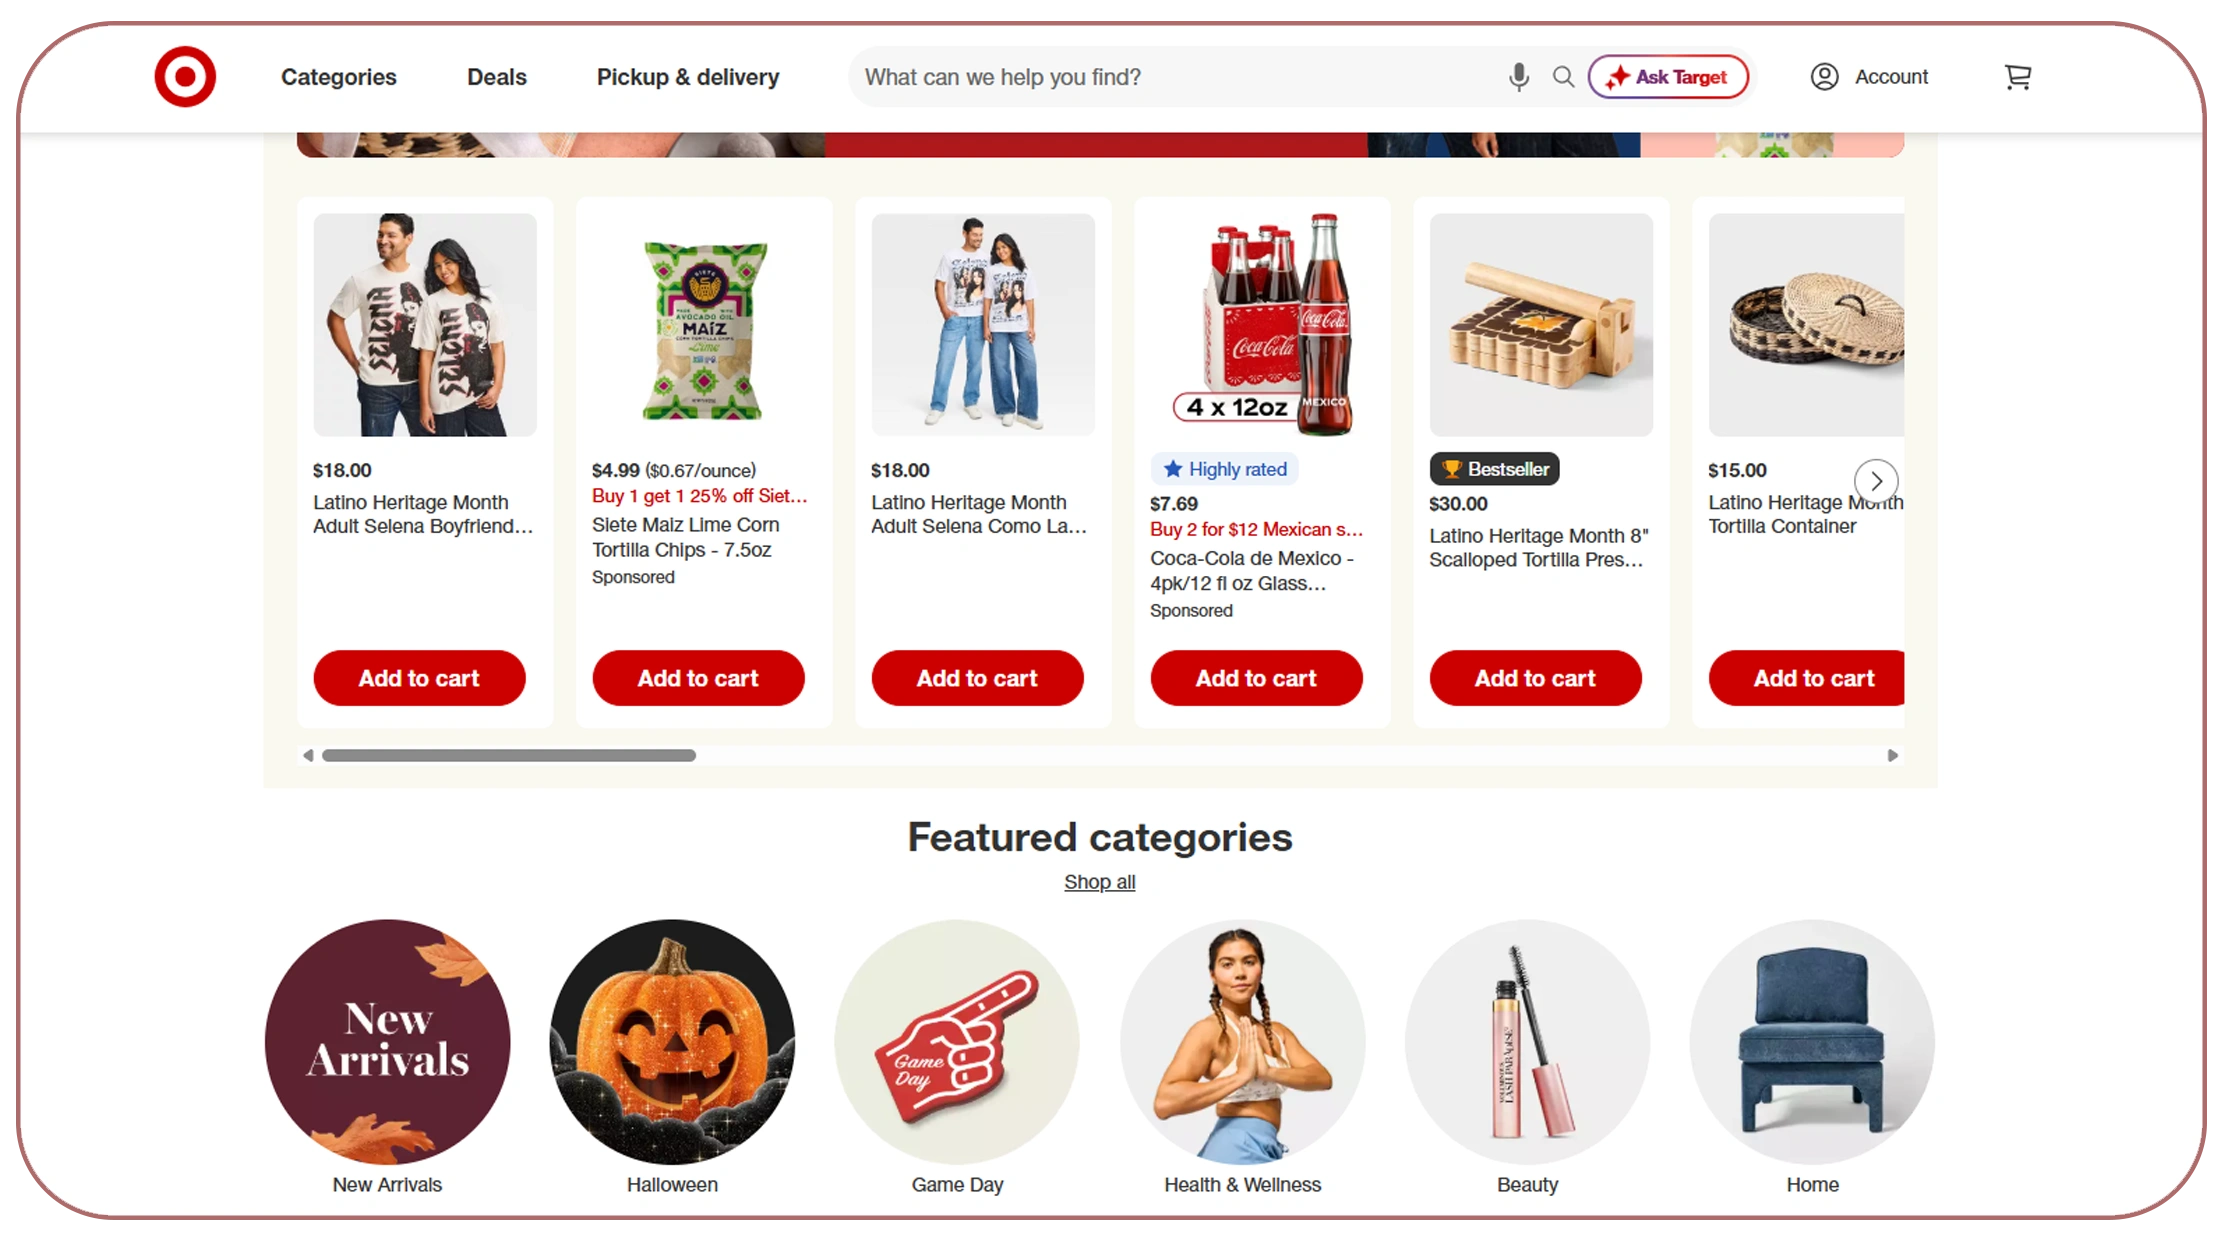
Target e-commerce data collection services can help businesses collect and organize product-level information into standardized records.
A useful retail dataset should not simply contain product names and prices. It should capture the attributes required for a specific business objective. For competitive pricing, price, discount, brand, category, and timestamp may be essential. For assortment intelligence, product hierarchy, availability, product type, and brand become equally important.
Example Data Fields
| Data Field | Business Application |
|---|---|
| Product Name | Product identification |
| Brand | Brand-level benchmarking |
| Category | Assortment analysis |
| Subcategory | Detailed category comparison |
| Price | Pricing intelligence |
| Discount | Promotion monitoring |
| Availability | Stock visibility |
| Product URL | Record verification |
| SKU/Product ID | Product-level tracking |
| Rating | Customer perception analysis |
| Review Count | Demand/engagement signal |
| Timestamp | Historical comparison |
| Image URL | Visual catalog analysis |
The major advantage is consistency. If the same schema is collected daily or weekly, businesses can compare observations without rebuilding the analysis every time.
What Changed From 2020 to 2026?
Target's financial history illustrates the scale of the retail environment. Net sales increased from $93.561 billion in 2020 to $106.005 billion in 2021 and $109.120 billion in 2022 before reaching $107.412 billion in 2023, $106.566 billion in 2024, and $104.780 billion in 2025.
| Year | Target Net Sales |
|---|---|
| 2020 | $93.561B |
| 2021 | $106.005B |
| 2022 | $109.120B |
| 2023 | $107.412B |
| 2024 | $106.566B |
| 2025 | $104.780B |
These figures are Target-wide financial results, not online product counts. They demonstrate the scale of the retailer that businesses may be analyzing.
From 2020 onward, digital shopping accelerated the importance of structured product intelligence. By 2022–2024, retailers increasingly needed information that could be compared across channels. By 2025–2026, historical product records, price observations, availability signals, and category-level monitoring can provide a more complete view than one-time snapshots.
The actionable insight is simple: businesses should design collection schemas around decisions, not merely around webpages. A pricing team needs a different data model from a category manager or a market research analyst.
How can businesses monitor prices and availability?
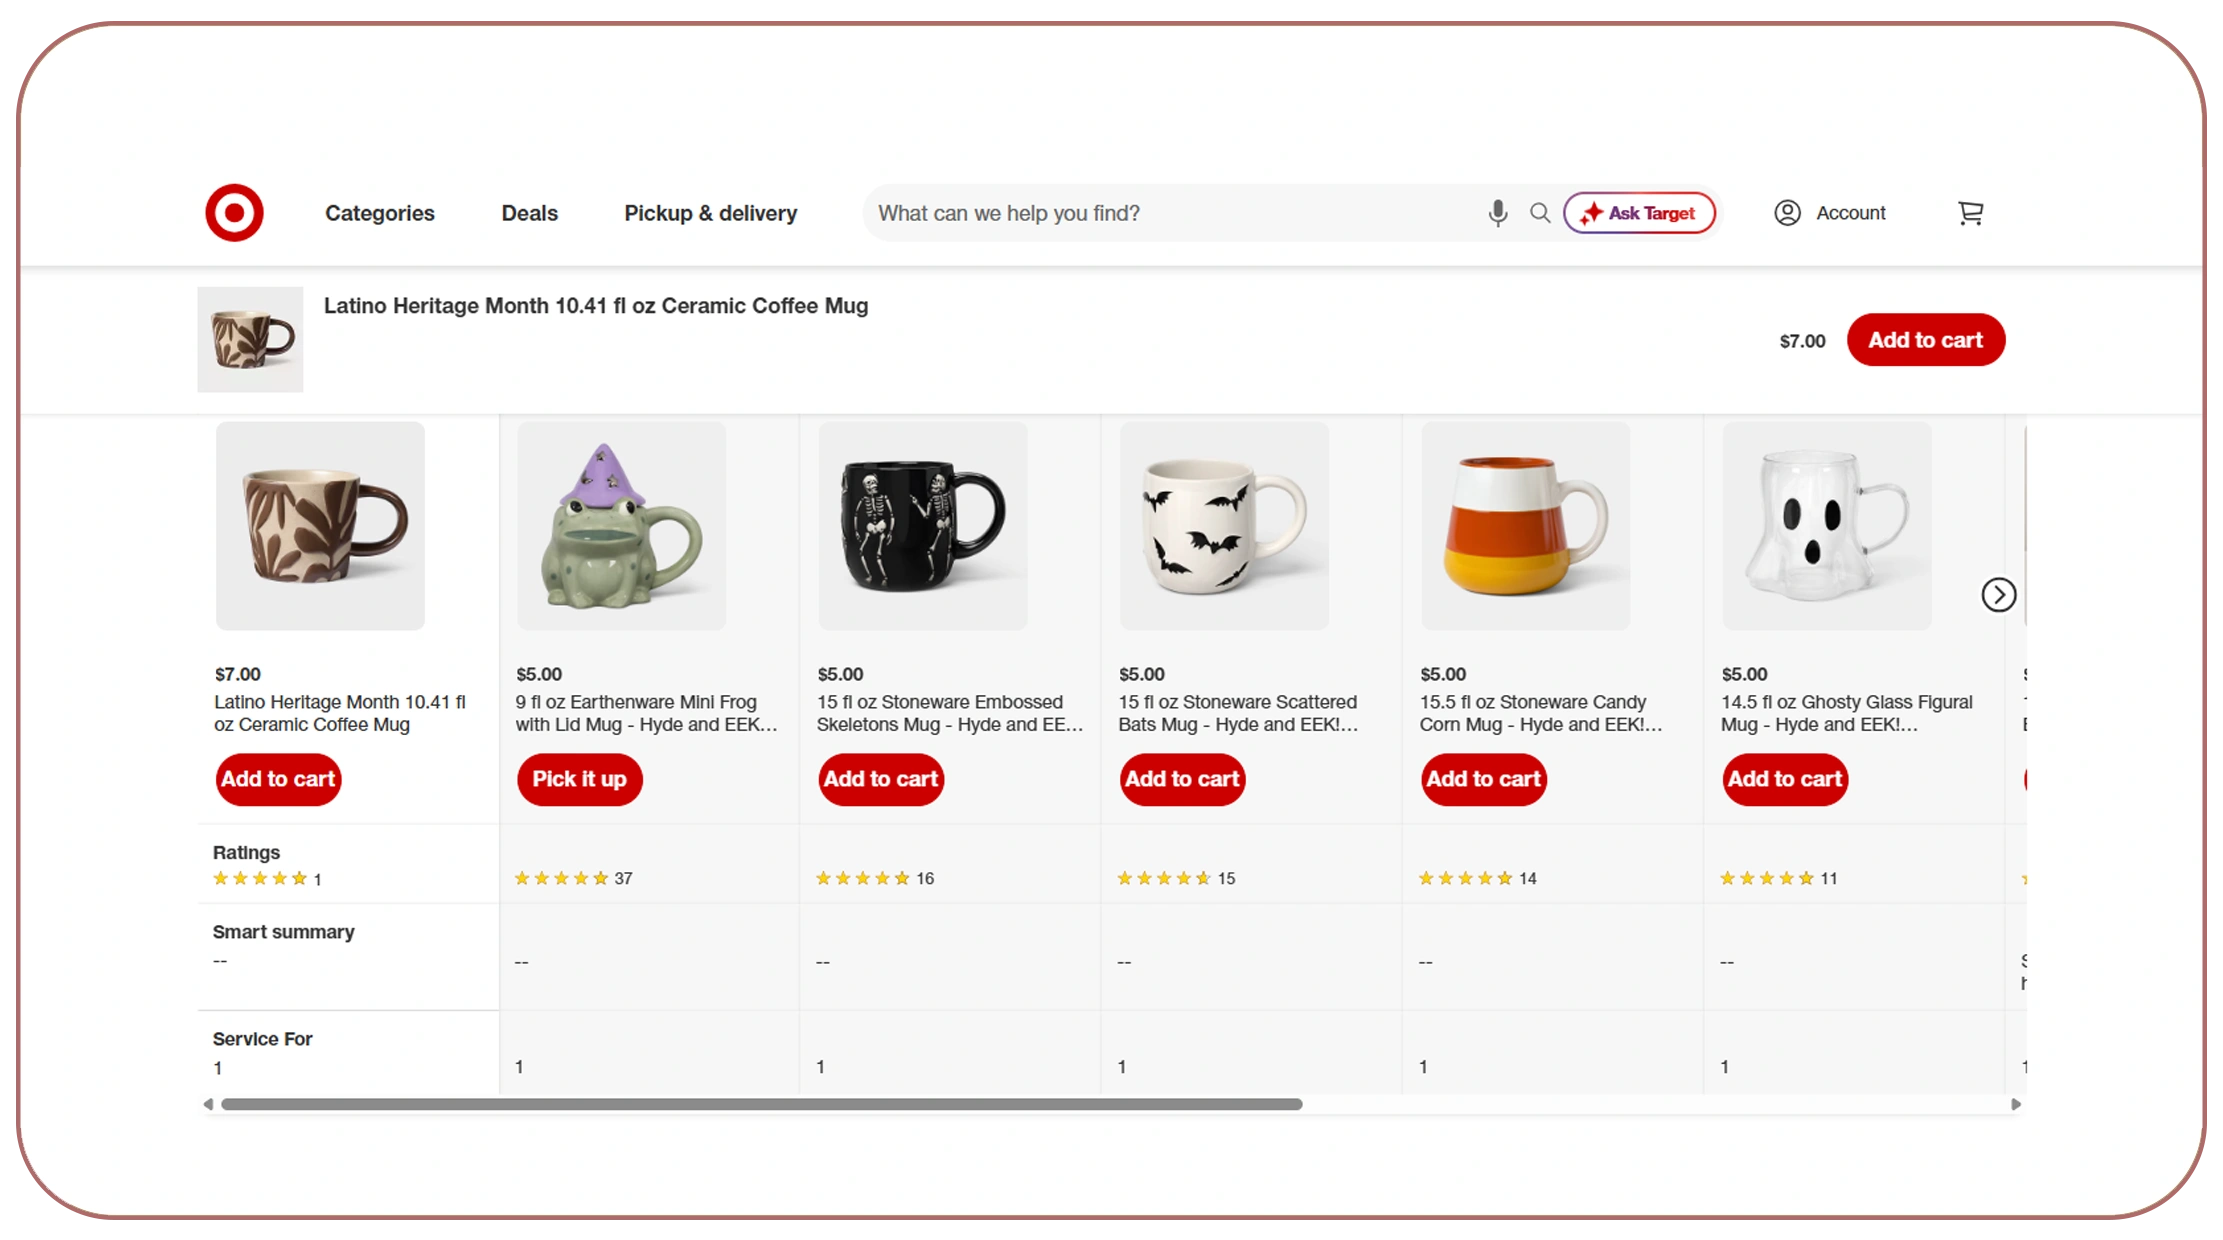
Extract Target Product Prices and Availability workflows can help businesses monitor two of the most important retail signals: what a product costs and whether customers can currently purchase it.
Price monitoring becomes more valuable when every observation includes a timestamp. A single price tells an analyst what the product costs at one moment. Repeated observations can show price changes, promotional periods, price stability, and category-level movements.
Availability should be handled similarly. A product marked unavailable today may become available tomorrow. Preserving those observations makes it possible to distinguish temporary availability changes from longer-term assortment decisions.
Useful Monitoring Metrics
| Metric | Calculation | Business Question |
|---|---|---|
| Average Price | Sum of prices ÷ products | What is the category price level? |
| Price Change % | Current vs. previous price | Which products changed price? |
| Availability Rate | Available products ÷ total products | How much assortment is accessible? |
| Out-of-Stock Rate | Unavailable products ÷ total products | Where are availability gaps? |
| Discount Rate | Discounted products ÷ total products | How promotional is the category? |
| New Product Rate | New products ÷ total products | How quickly is assortment changing? |
Target's 2025 reporting shows that digitally originated merchandise sales reached $21.1 billion, up from $20.5 billion in 2024 and $19.4 billion in 2023. Digital merchandise sales represented 20.6% of total merchandise sales in 2025.
2020–2026 Development
In 2020, businesses faced rapid changes in consumer shopping behavior and product availability. During 2021–2022, retailers experienced continued shifts in demand, assortment, and fulfillment. By 2023–2024, businesses had greater need for structured competitive pricing and digital assortment intelligence.
Target's 2022–2025 figures show the continued importance of digital merchandise sales. Digitally originated merchandise sales were $20.0 billion in 2022, $19.4 billion in 2023, $20.5 billion in 2024, and $21.1 billion in 2025.
For brands, the implication is that price and availability should be treated as time-series data. Historical records can help teams identify changes that are difficult to see through occasional manual checks.
A practical monitoring system can collect data daily, several times per week, or according to the business's analytical requirements. The right frequency depends on product volatility, category characteristics, and the purpose of the research.
How can structured retail data support market research?
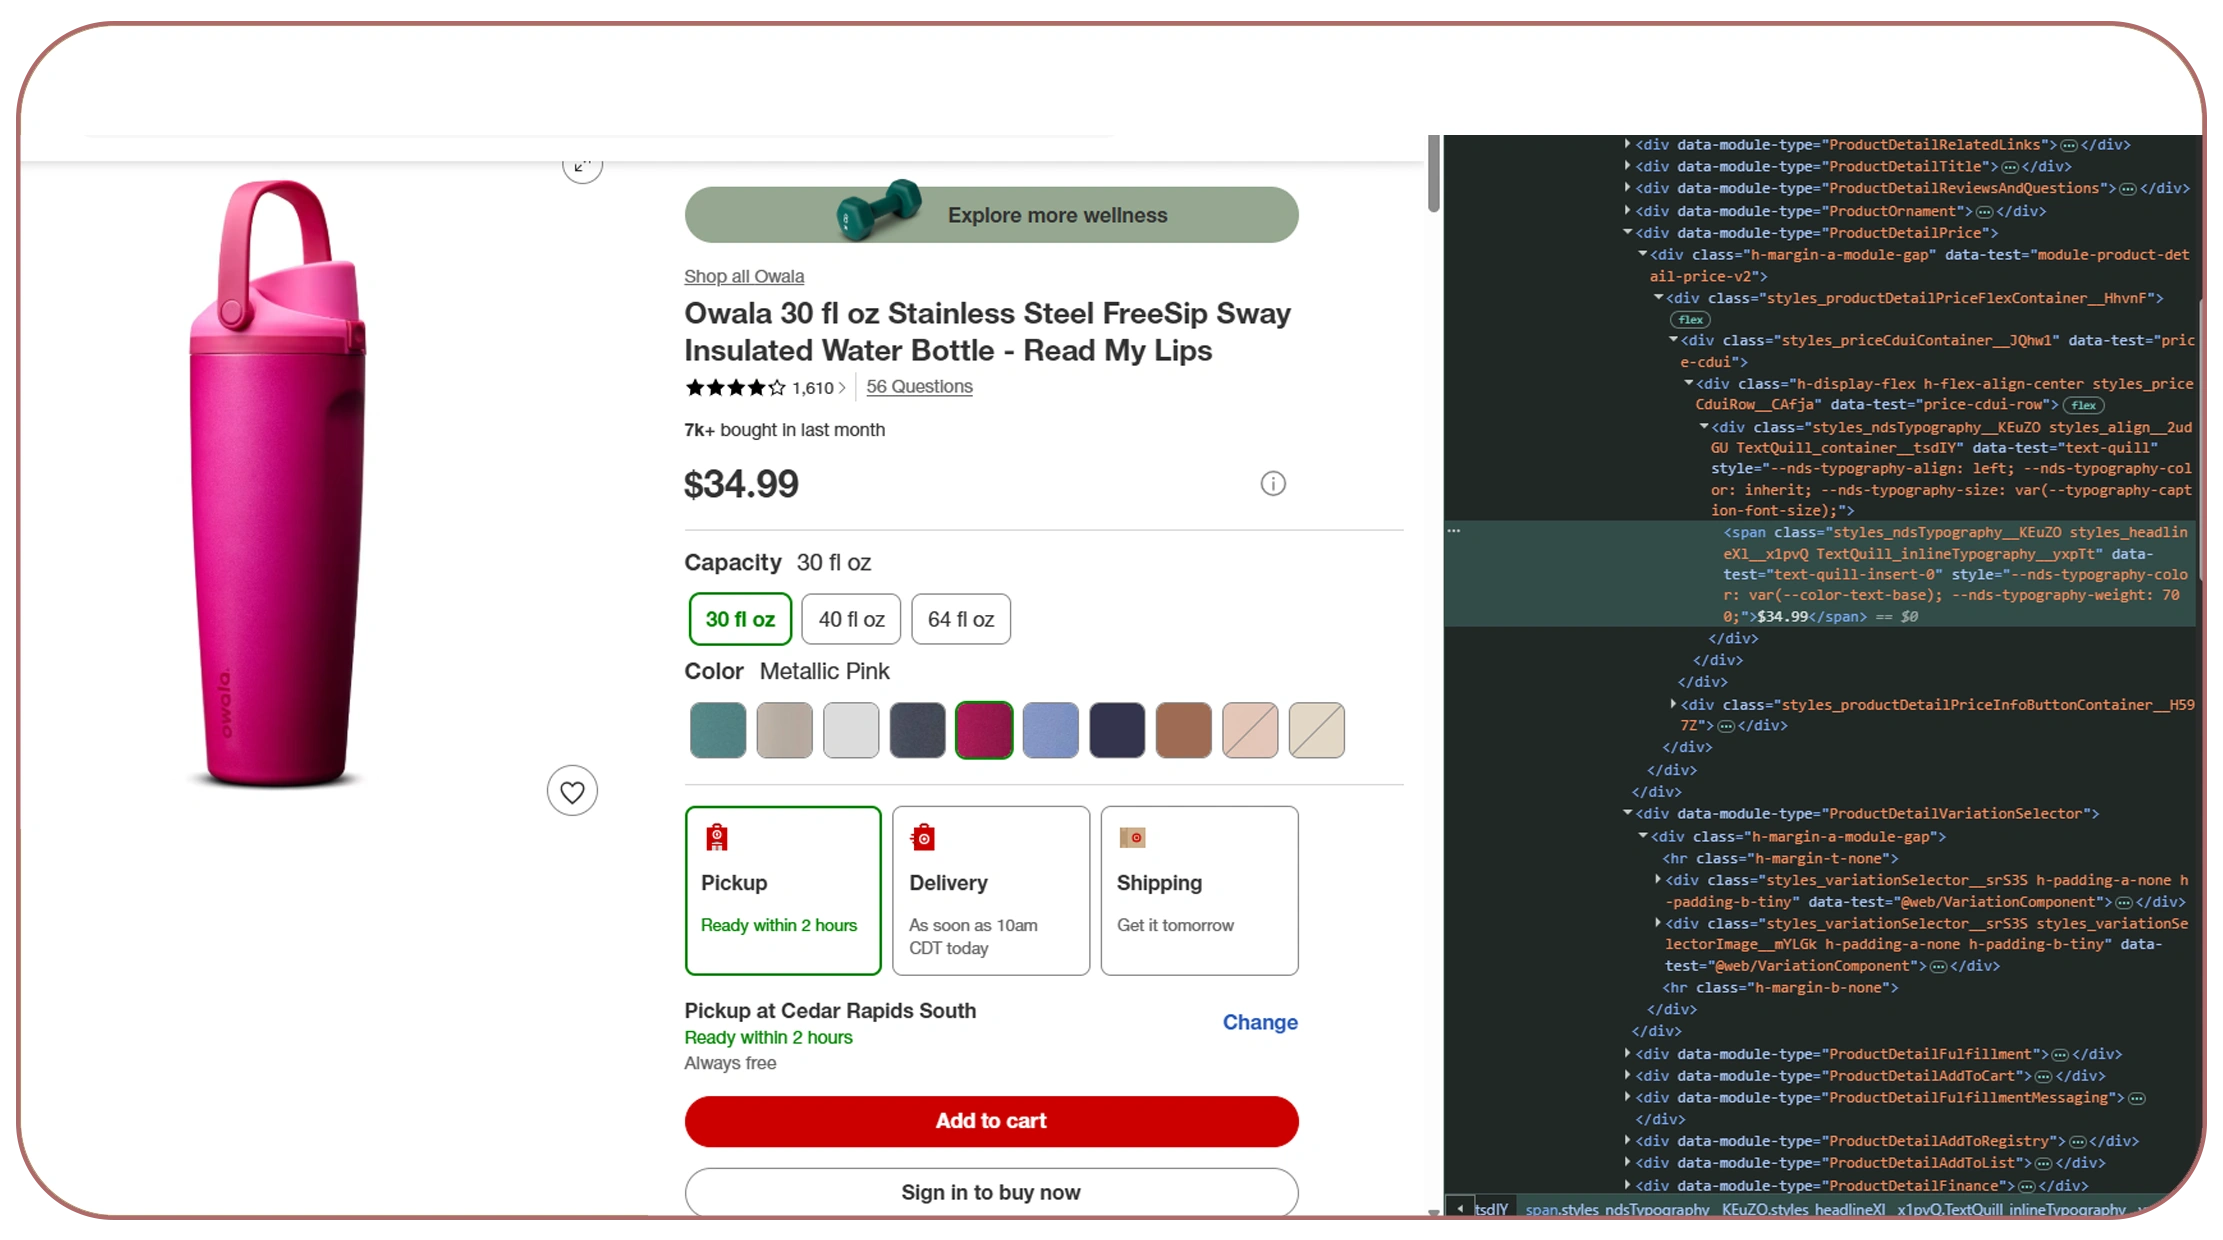
Target Data Extraction for E-commerce Market Research can help researchers convert product-level information into a broader competitive and category intelligence framework.
A market research team may want to understand category depth, brand presence, pricing structures, promotional intensity, availability, and assortment changes. Structured product records make these questions measurable.
For example, a consumer brand could monitor a specific product category and calculate:
- Number of competing brands
- Number of products per brand
- Average listed price
- Minimum and maximum price
- Promotion frequency
- Availability percentage
- New product frequency
- Product rating distribution
- Category-level assortment changes
Category Analysis Example
| Research Dimension | Example Insight |
|---|---|
| Brand Presence | Number of brands in a category |
| Product Depth | Products listed by each brand |
| Price Architecture | Distribution across price bands |
| Promotion Activity | Share of discounted products |
| Availability | Product accessibility over time |
| Assortment Change | New and removed products |
| Consumer Signals | Ratings and review counts |
| Regional Context | Market-specific assortment |
Target's 2025 merchandise sales were distributed across multiple major categories. Food and beverage represented $24.136 billion, household essentials $18.017 billion, hardlines $15.800 billion, home furnishings and décor $15.608 billion, apparel and accessories $15.737 billion, and beauty $13.214 billion.
These are sales figures rather than website assortment counts, so they should not be treated as a direct measure of online product volume. However, they illustrate the breadth of categories that can matter to retail research.
2020–2026 Perspective
From 2020 through 2026, market research has increasingly shifted from static reports toward continuously refreshed datasets. Historical observations allow analysts to identify patterns rather than relying on isolated observations.
A 2020 snapshot could show a category's assortment at one point in time. A 2026 monitoring system can preserve thousands of dated observations, enabling businesses to study product lifecycles, price changes, availability patterns, and assortment expansion or contraction.
This also improves AI-ready research. Structured fields are easier for analytics systems and language models to summarize than inconsistent spreadsheets containing mixed naming conventions and manually entered values.
The most useful datasets therefore combine breadth with consistency. Collecting more products is not enough if prices are stored inconsistently, categories change names, duplicate products appear, or timestamps are missing.
Need structured retail intelligence for pricing, assortment, and market research? Build a scalable data pipeline with Real Data API and turn changing e-commerce information into analysis-ready datasets!
Get Insights Now!What makes automated product extraction useful at scale?
Target e-commerce data extraction enables businesses to automate the collection of selected product attributes and deliver them into structured systems.
- Source and page discovery
- Product identification
- Attribute extraction
- Data normalization
- Duplicate detection
- Validation
- Timestamping
- Change detection
- Historical storage
- API or file delivery
This approach is especially useful for companies tracking large product catalogs. Manual collection can become difficult when product pages change frequently or when multiple categories must be monitored.
2020–2026 Evolution
Target's store footprint expanded during this period. The company reported 1,926 stores in 2021, 1,948 in 2022, 1,956 in 2023, 1,978 in 2024, and 1,995 in 2025.
| Year | Target Stores |
|---|---|
| 2021 | 1,926 |
| 2022 | 1,948 |
| 2023 | 1,956 |
| 2024 | 1,978 |
| 2025 | 1,995 |
This physical footprint matters because Target's digital and store operations are closely connected. In 2025, stores fulfilled 97.6% of merchandise sales, including digitally originated orders.
For data teams, this reinforces the importance of treating availability and fulfillment information as contextual signals rather than viewing the website as an isolated digital storefront.
In 2026, automated extraction can support more frequent monitoring while preserving historical records. Businesses can then connect product data with internal sales, category, advertising, or pricing systems to create richer analytical models.
How can a retailer-focused scraper support competitive analysis?
A Target.com Scraper can be configured around the fields and categories relevant to a company's research objectives.
The purpose of a scraper should not be simply to maximize the number of pages collected. A better approach defines the required schema first and then builds collection rules around those fields.
For example, a consumer electronics company may prioritize brand, model, specifications, price, discount, rating, review count, and availability. A grocery business may require pack size, unit price, brand, category, promotional price, and availability.
Example Monitoring Framework
| Business Need | Relevant Fields |
|---|---|
| Price Benchmarking | Price, discount, unit price |
| Assortment Monitoring | Product, category, brand |
| Availability Tracking | Stock status, location |
| Promotion Analysis | Regular price, sale price, promotion |
| Brand Intelligence | Brand, product count |
| Product Research | Specifications, attributes |
| Consumer Analysis | Rating, review count |
Target's reported merchandise mix also shows why category-specific collection can be valuable. In 2025, food and beverage was the largest of the six named merchandise categories by sales at $24.136 billion, followed by household essentials at $18.017 billion and hardlines at $15.800 billion. Again, these figures represent sales, not product counts.
From 2020–2026, competitive intelligence increasingly requires historical context. If a business only captures today's price, it cannot determine whether that price represents a permanent change, a temporary promotion, or a recurring seasonal pattern.
A recurring dataset can answer these questions by preserving each observation. This makes it possible to build dashboards showing price movement, assortment changes, availability rates, and brand-level comparisons.
How can API-based delivery improve retail data workflows?
A Target API workflow can help businesses integrate structured retail information into existing technology environments.
API-based delivery is particularly useful when data must flow into dashboards, databases, analytics platforms, pricing engines, or internal applications.
A typical architecture can look like:
Retail Source → Data Extraction → Validation → API → Database → Analytics → Business Decision
Benefits of API-Based Delivery
| Requirement | API Workflow Benefit |
|---|---|
| Frequent updates | Automated retrieval |
| Large datasets | Scalable delivery |
| Analytics | Direct system integration |
| Historical tracking | Timestamped records |
| Pricing workflows | Structured price fields |
| Availability monitoring | Repeatable refreshes |
| Custom research | Flexible schemas |
Target reported $21.1 billion in digitally originated merchandise sales in 2025, compared with $19.4 billion in 2023. Digitally originated comparable sales increased 3.1% in 2025, while total comparable sales declined 2.6%.
These figures are Target's company-level performance metrics and do not directly measure website traffic or product-level demand. They do, however, provide context for why digital retail data can be an important analytical input.
2020–2026 Development
Between 2020 and 2022, digital commerce became increasingly important to retail operations. During 2023–2025, retailers continued integrating stores, fulfillment, digital ordering, and data systems. Target's reporting explicitly describes its model as combining stores and digital channels, with stores fulfilling most merchandise sales.
For businesses building data infrastructure in 2026, API delivery can therefore provide a practical bridge between external retail information and internal decision systems.
The most effective setup combines reliable extraction with a clearly defined schema, validation rules, historical storage, and consistent delivery.
Why Choose Real Data API?
Target E-Commerce Dataset projects require more than basic webpage collection. Businesses need data that is structured, validated, refreshed, and suitable for downstream analysis.
Real Data API can support organizations that need scalable web data workflows for retail and e-commerce intelligence.
Key Capabilities
- Structured product data collection
- Price and availability monitoring
- Recurring extraction workflows
- Historical data storage
- Data normalization
- Duplicate detection
- Data validation
- Custom field extraction
- API-based delivery
- Analytics-ready datasets
- Competitive retail research
- Category-level monitoring
The workflow can be adapted to different buyer personas.
- For retailers: monitor competitors and category movements.
- For brands: track assortment, pricing, and availability.
- For marketplaces: benchmark product and seller information.
- For analysts: create historical datasets for market research.
- For data teams: integrate external retail information into existing analytics infrastructure.
The objective is to transform continuously changing retail pages into structured information that can be queried, compared, visualized, and analyzed.
Conclusion
A Target e-commerce dataset can help brands and retailers understand product assortments, price movements, availability changes, category structures, and broader retail market trends.
The most useful approach combines recurring collection, consistent schemas, historical timestamps, validation, and API-based delivery. Target's scale illustrates why this matters: the company reported $104.78 billion in 2025 net sales, $102.717 billion in merchandise sales, 1,995 stores, and $21.1 billion in digitally originated merchandise sales.
For businesses, the value is not simply in knowing what appears on an e-commerce website today. The greater opportunity is understanding how products, prices, availability, and assortments change over time.
Ready to turn retail product information into actionable intelligence? Contact Real Data API to build a scalable, structured data pipeline tailored to your pricing, availability, assortment, and market research needs!
FAQs
What is a Target e-commerce dataset used for?
A Target e-commerce dataset organizes product, pricing, availability, category, and related information into structured records for competitive analysis, assortment planning, and retail market research.
How does Target Product data scraping help brands?
Target Product data scraping helps brands monitor product listings, prices, discounts, availability, categories, ratings, and other accessible attributes consistently across selected retail categories.
Why use Target e-commerce data collection services?
Target e-commerce data collection services help businesses automate recurring product research, standardize records, preserve historical observations, and reduce the manual effort involved in retail monitoring.
What information can businesses Extract Target Product Prices and Availability?
Businesses can Extract Target Product Prices and Availability to monitor price movements, promotional activity, stock signals, assortment changes, and category-level retail conditions over time.
How does market research benefit from structured Target data?
Target Data Extraction for E-commerce Market Research can provide structured product and pricing observations for category benchmarking, competitor analysis, assortment research, trend analysis, and historical retail intelligence using Real Data API.
Latest posts
How Foodpanda Food Dataset Helps Businesses Track Restaurants, Menus, Prices, Ratings, and Food Delivery Trends?
How IKEA E-commerce Dataset Helps Businesses Solve Product, Pricing, Category, and Retail Trend Challenges?
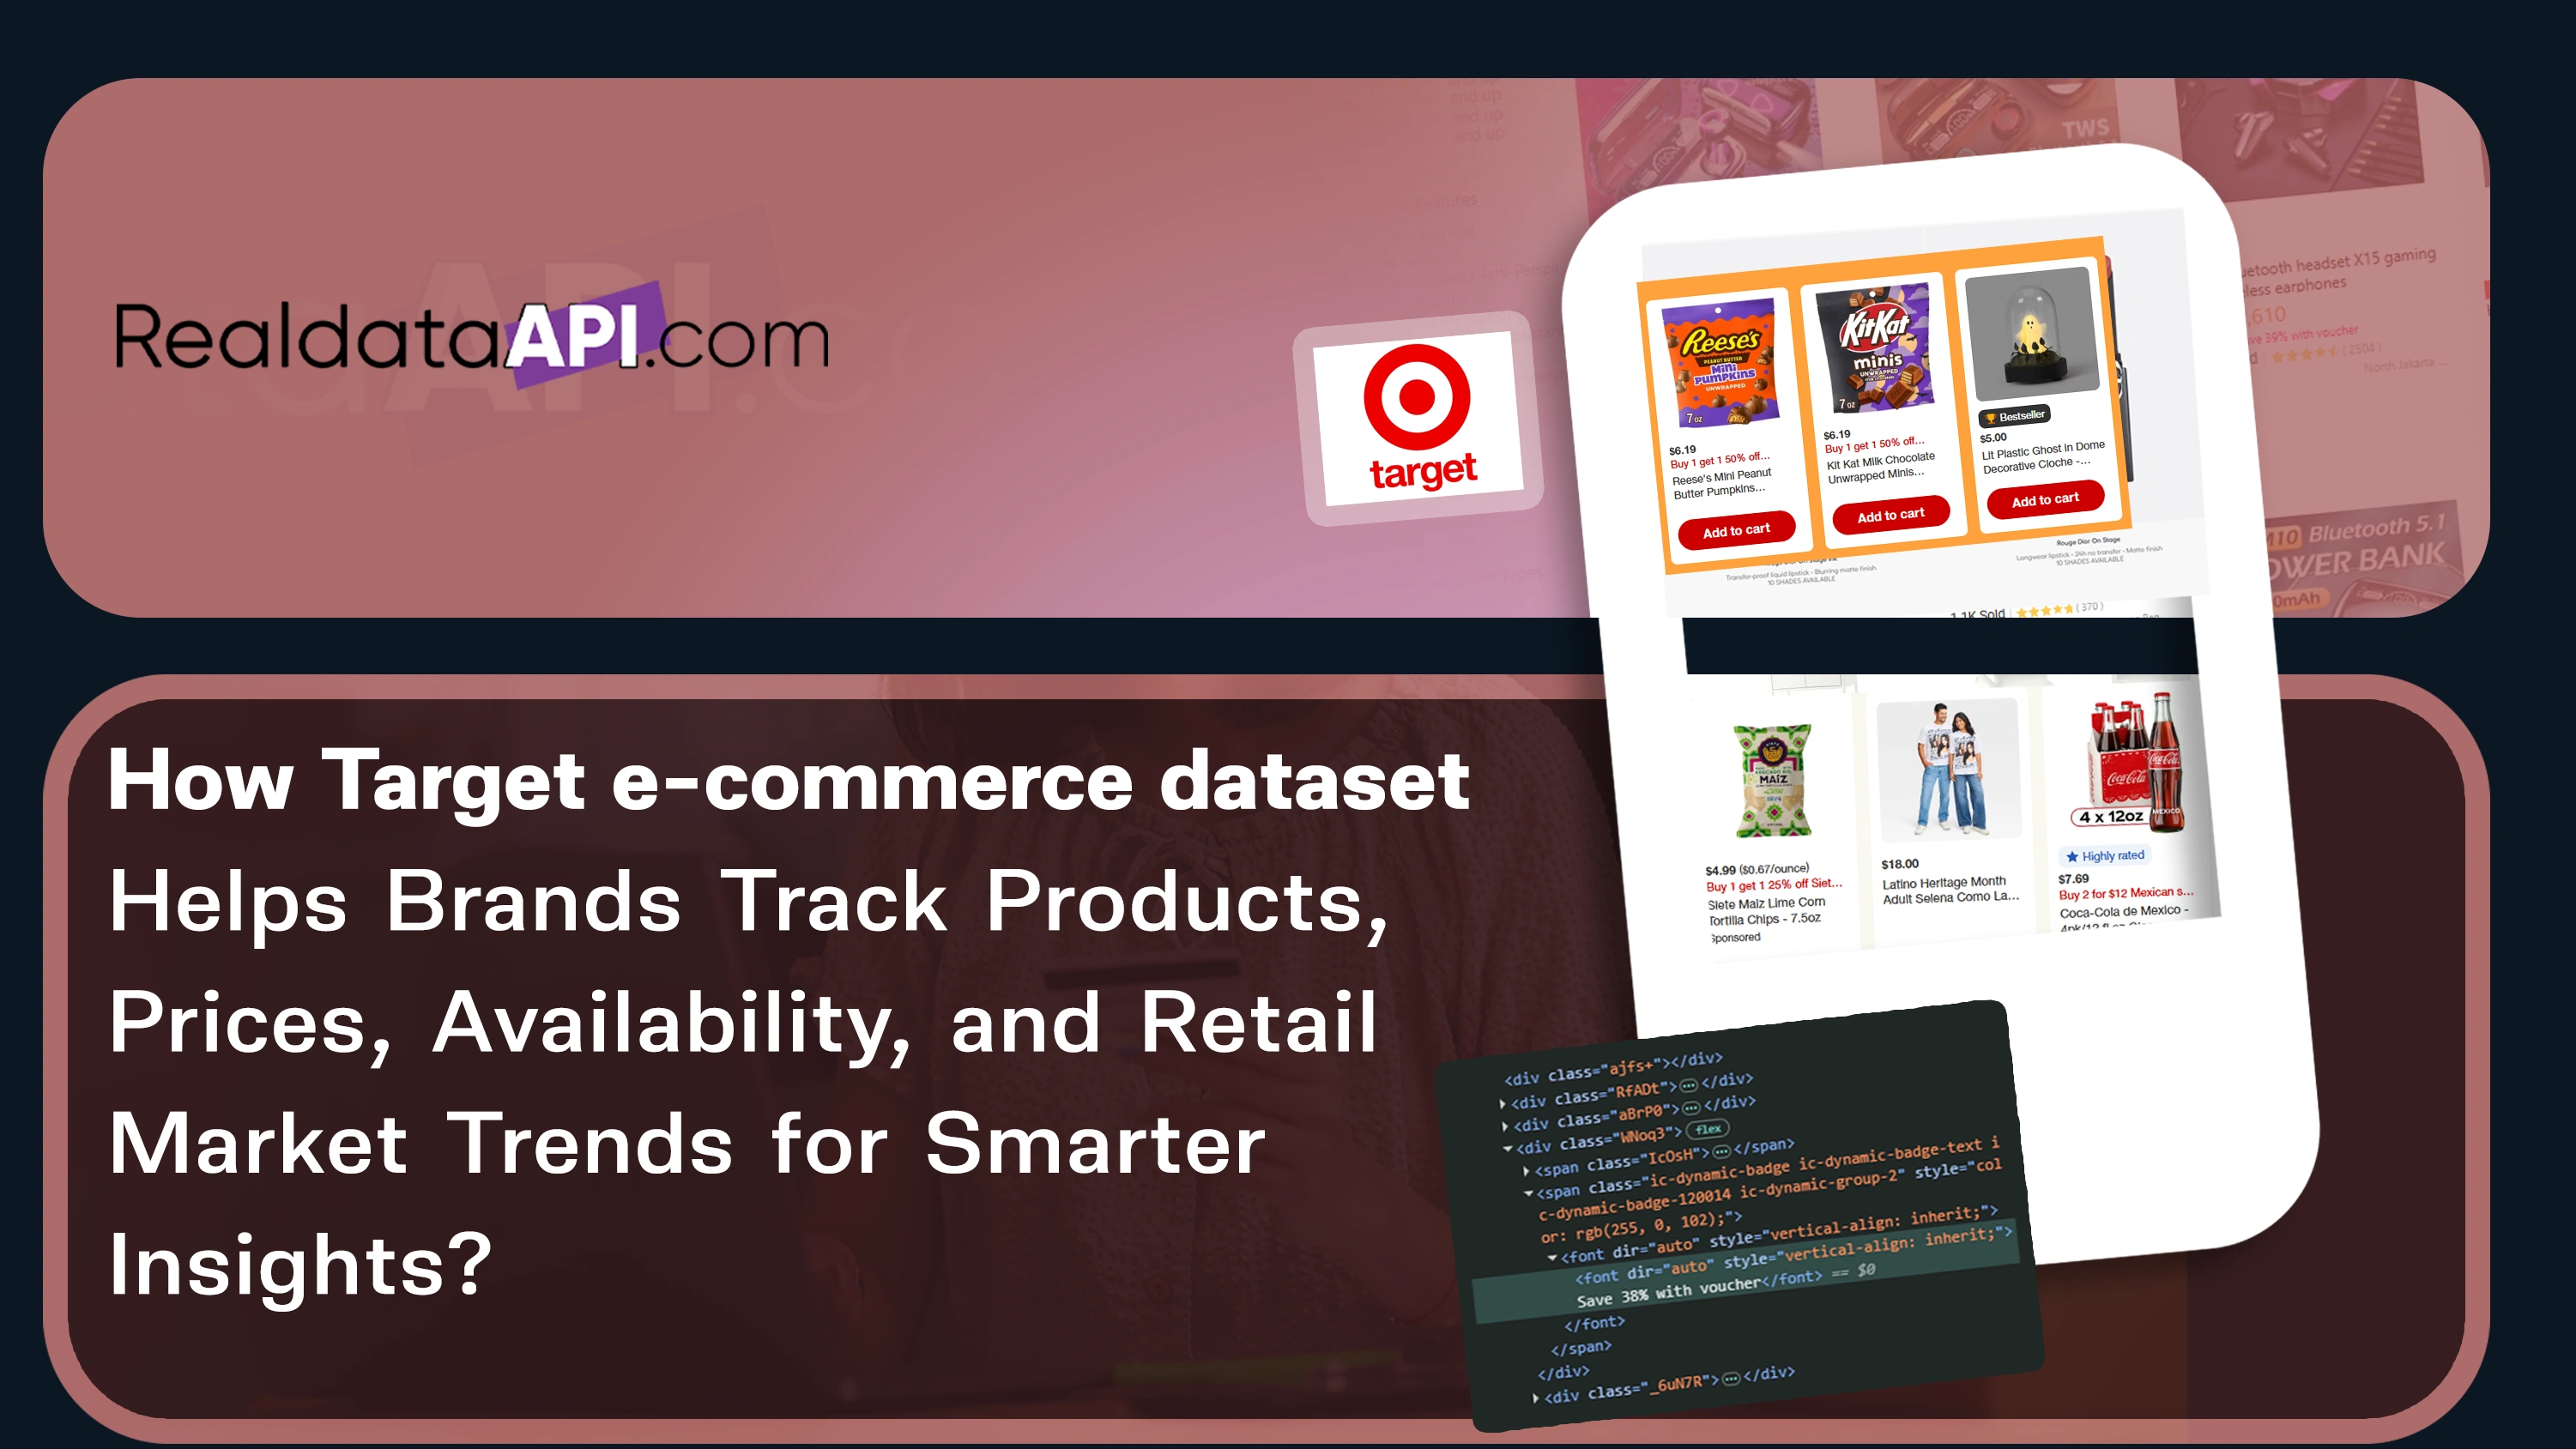
How Target e-commerce dataset Helps Brands Track Products, Prices, Availability, and Retail Market Trends for Smarter Insights?
How Dior fashion dataset Helps Brands Track Luxury Products, Prices, Collections, and Fashion Trends for Smarter Insights?






.png)



