TL;DR
Myntra fashion dataset gives fashion brands structured visibility into products, prices, discounts, brands, categories, ratings, and assortment changes. Myntra Product Data Scraping helps convert marketplace information into usable datasets for competitive benchmarking, assortment planning, and fashion trend analysis. Real-time and historical marketplace data can help retailers identify pricing movements, catalog gaps, competitor activity, and emerging opportunities.
Introduction
Fashion brands need more than catalog information to compete effectively online. They need structured visibility into products, pricing, discounts, brands, assortment, availability, and changing market patterns. A Myntra fashion dataset can bring these signals together, while Myntra Product Data Scraping automates product-level collection at scale.
Myntra operates a large fashion-focused digital marketplace covering apparel, footwear, beauty, accessories, and related categories. For brands, sellers, retailers, agencies, and market researchers, monitoring this digital shelf through Myntra Fashion Datasets can help answer practical questions: Which brands are gaining assortment visibility? Which categories are becoming more competitive? Where are prices changing? Which products are repeatedly discounted? How does a competitor's assortment compare with its own?
The value comes from converting continuously changing marketplace information into structured, historical, and analysis-ready data.
How can structured marketplace data improve fashion market research?
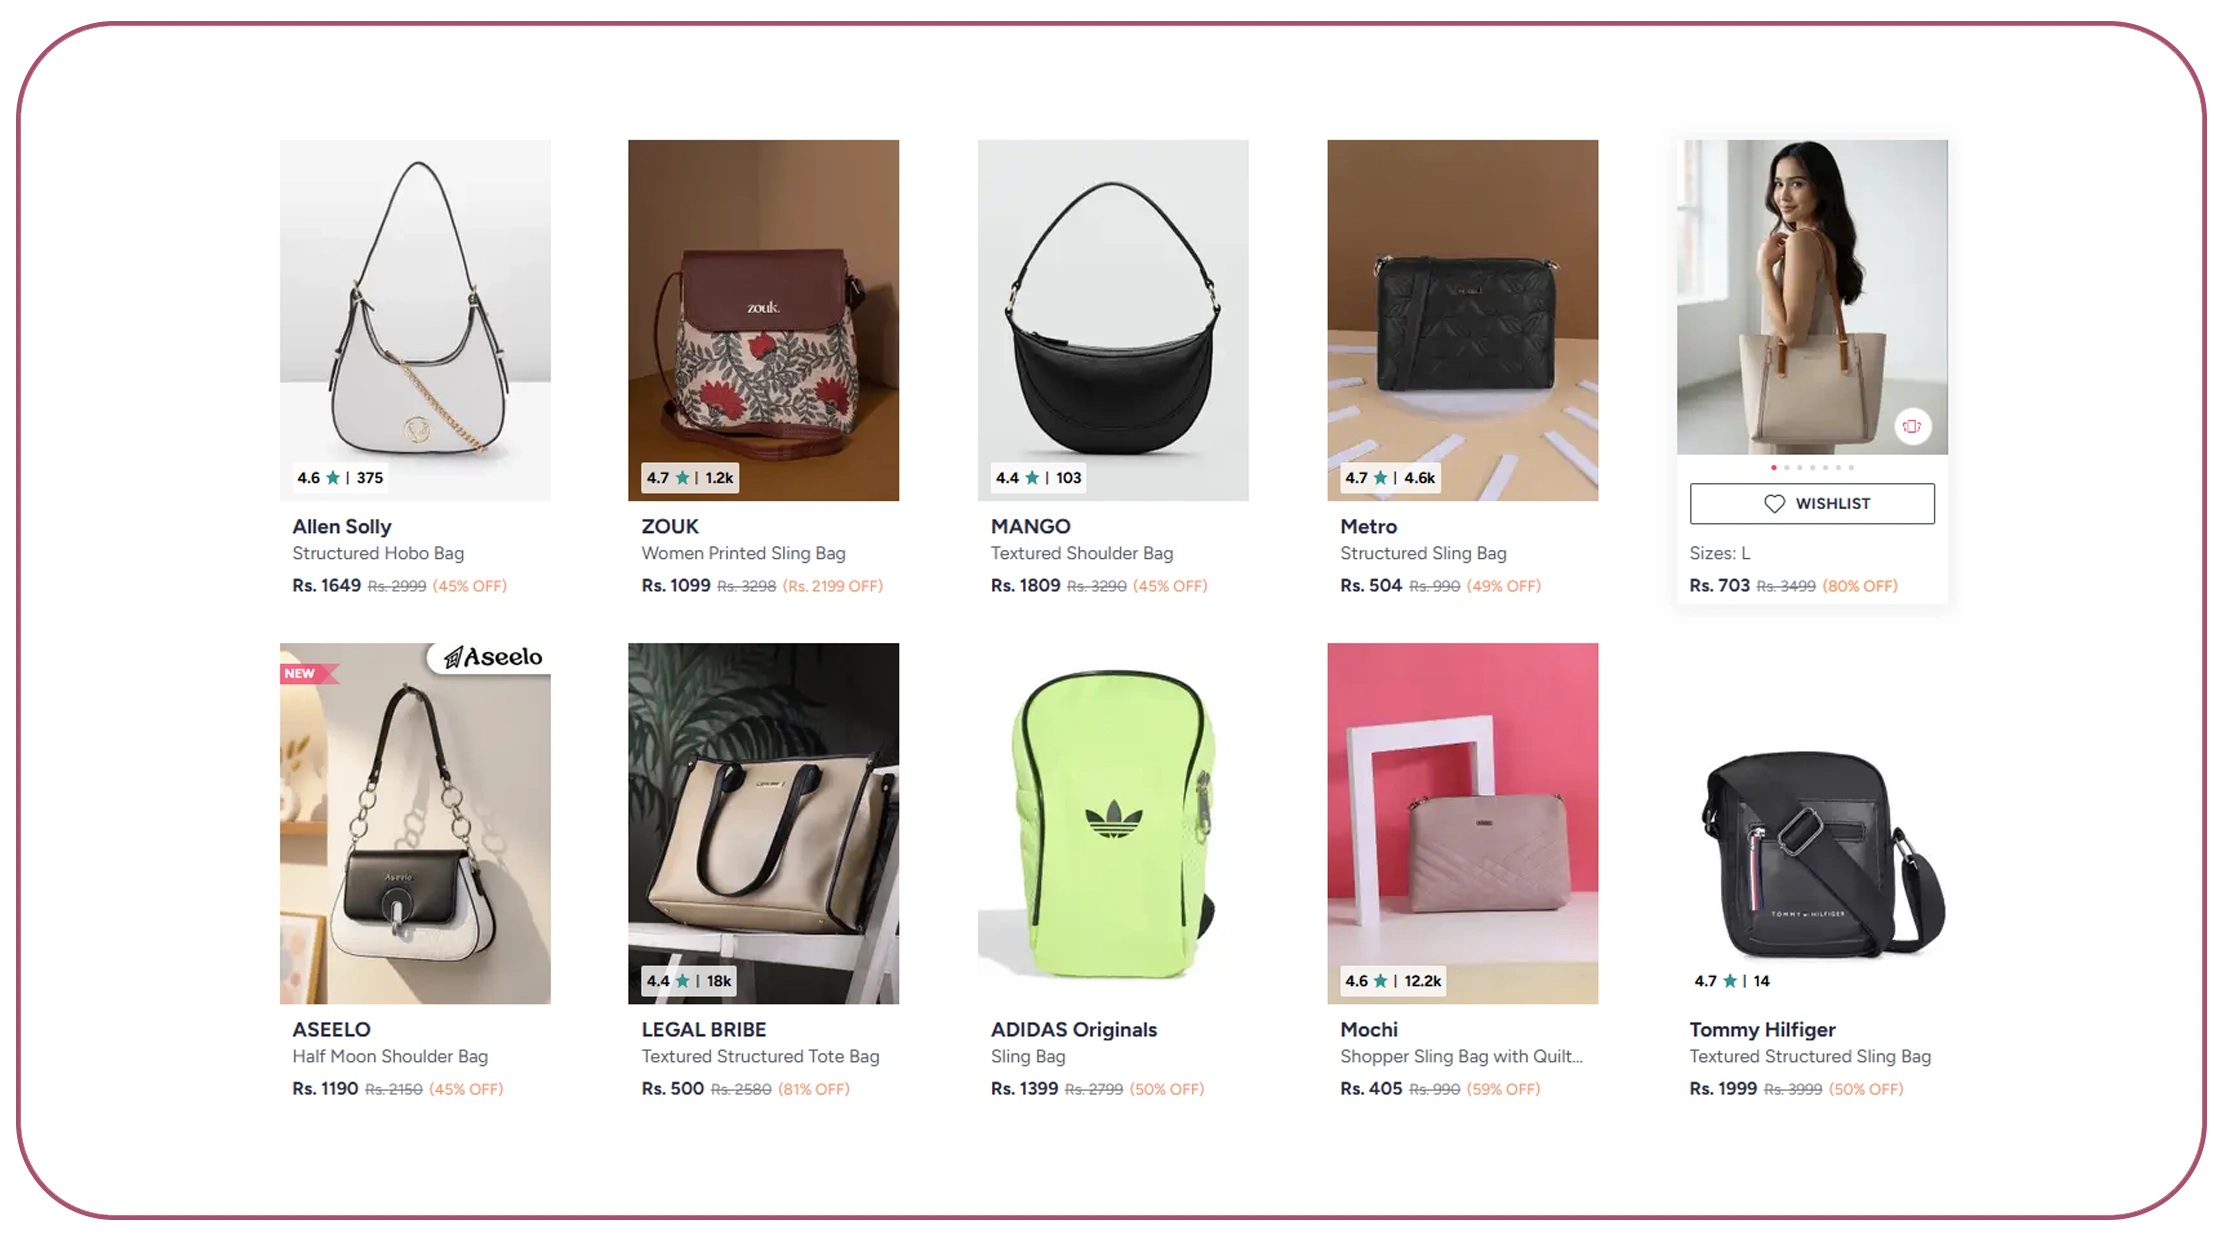
Myntra Data Extraction for Fashion Market Research can help businesses transform scattered product information into a consistent analytical dataset.
Fashion market research teams often work across hundreds of brands and thousands of SKUs. Manual research makes it difficult to maintain historical records, identify changes, and compare equivalent products.
Key data fields
| Data Field | Research Application |
|---|---|
| Product name | Catalog analysis |
| Brand | Brand benchmarking |
| Category | Category research |
| MRP | Price positioning |
| Selling price | Competitive pricing |
| Discount | Promotion analysis |
| Rating | Customer response |
| Review count | Engagement signal |
| Availability | Stock visibility |
| Product URL | Record verification |
| Images | Visual catalog analysis |
| Timestamp | Historical tracking |
The dataset becomes particularly useful when these fields are collected repeatedly rather than as a single snapshot.
For example, a fashion brand can compare its average selling price with comparable products from competing brands, monitor discount intensity by category, and identify whether competitors are expanding into specific product segments.
Example research framework
| Business Question | Data Required |
|---|---|
| Which brands dominate a category? | Brand + SKU count |
| How competitive is pricing? | MRP + selling price |
| Which products receive discounts? | Price history |
| Where is assortment expanding? | Historical SKU records |
| Which products attract engagement? | Ratings + reviews |
| Which products are unavailable? | Availability history |
2020–2026 evolution
Between 2020 and 2026, online fashion research became increasingly dependent on digital marketplace signals. The pandemic accelerated e-commerce adoption, while subsequent years brought greater competition across brands, marketplaces, D2C businesses, and omnichannel retailers. By the middle of the decade, fashion businesses increasingly needed SKU-level information rather than broad market estimates because price, assortment, promotion, and availability could change rapidly. The rise of automated analytics also changed how teams approached competitive intelligence. Instead of collecting occasional screenshots or manually recording selected products, businesses could build recurring datasets and compare historical observations. This created opportunities to identify assortment expansion, price movements, promotional cycles, and brand visibility at a much more granular level. From 2020 through 2026, the key shift has therefore been from static marketplace observation toward continuous digital shelf intelligence. For fashion brands, this means combining product, pricing, brand, availability, review, and category data into a consistent analytical framework that can support decisions across merchandising, pricing, marketing, and market research.
How does automated collection simplify large-scale fashion monitoring?
A Myntra fashion web data scraper can automate the repetitive work involved in collecting product information across categories and brands. When structured consistently, the resulting Myntra fashion dataset can support both current analysis and historical comparisons.
Manual collection creates several problems:
- Limited SKU coverage
- Inconsistent data formatting
- Difficult historical comparison
- Delayed price updates
- High operational effort
- Greater risk of transcription errors
Automated collection can instead follow predefined product, category, brand, or search-level requirements.
Data collection workflow
| Stage | Activity | Output |
|---|---|---|
| Discovery | Identify relevant pages/SKUs | Product universe |
| Collection | Capture available fields | Raw records |
| Parsing | Structure fields | Standardized data |
| Cleaning | Remove duplicates/errors | Clean dataset |
| Validation | Check field consistency | Validated records |
| Delivery | API/database/file | Usable output |
A fashion company might monitor 500 competing SKUs every day, while another organization could monitor entire categories at weekly intervals.
The appropriate frequency depends on the business objective. Pricing teams may require frequent observations, while long-term assortment research may work with less frequent collection.
What makes the dataset actionable?
The important element is consistency. Product names, categories, brands, prices, and other attributes should follow a standardized schema so analysts can compare records over time.
A normalized dataset can also connect marketplace observations with internal business data, allowing teams to examine competitor activity alongside their own sales, pricing, and inventory metrics.
2020–2026 evolution
From 2020 to 2026, the scale and complexity of online fashion catalogs increased the importance of automated data workflows. Fashion businesses moved from manually reviewing individual marketplace pages toward structured collection systems capable of handling larger SKU universes. This evolution was driven by shorter product cycles, frequent promotions, expanding brand portfolios, and increasingly dynamic digital storefronts. A product could change price, availability, images, ratings, or promotional status without changing its underlying URL, making historical snapshots valuable for analysis. Automated workflows also made it possible to establish consistent schemas across large catalogs. Instead of treating every marketplace observation as an isolated record, organizations could connect products with brands, categories, prices, discounts, and timestamps. Between 2020 and 2026, this transition supported a broader move toward digital shelf monitoring, where businesses continuously observe online marketplaces rather than conducting occasional manual checks. The resulting historical data can help merchandising and strategy teams distinguish temporary changes from persistent market movements and make their research processes more repeatable.
How can live marketplace signals strengthen competitive analysis?
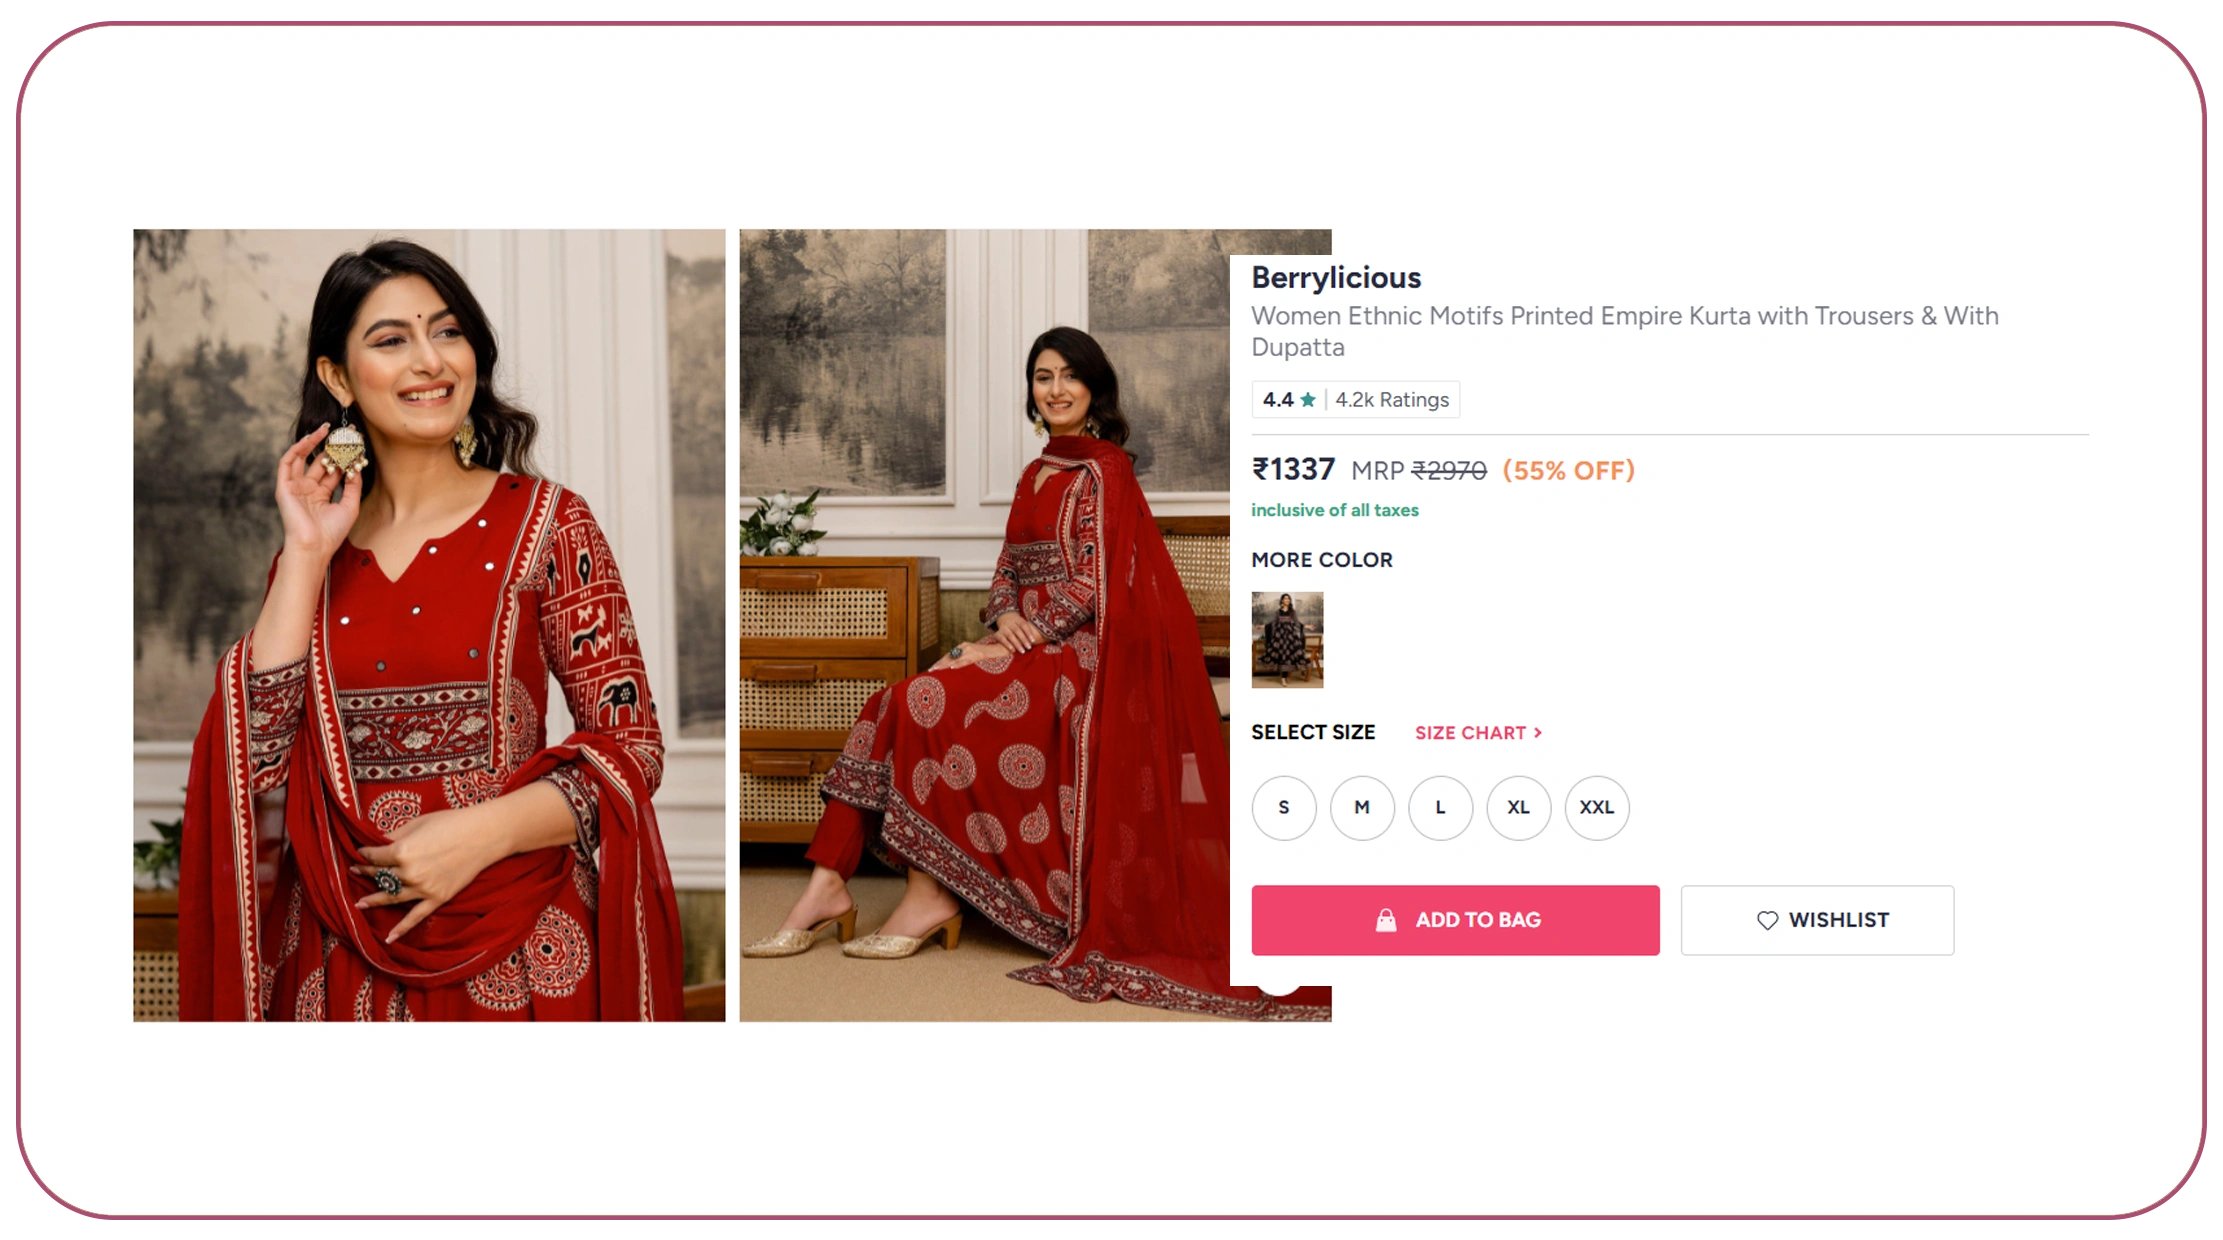
Real-Time Myntra Data Supports Competitive Analysis by giving businesses more frequent visibility into pricing, availability, assortment, and promotional activity.
Competitive intelligence becomes difficult when information is outdated. A competitor's price observed last month may no longer represent its current market position.
Competitive monitoring metrics
| Metric | Insight |
|---|---|
| Selling price | Current price position |
| Discount percentage | Promotion intensity |
| MRP | Reference pricing |
| Stock status | Product availability |
| SKU count | Assortment breadth |
| Brand count | Competitive density |
| Rating | Customer feedback signal |
| Review count | Engagement level |
| New products | Assortment expansion |
For instance, a fashion retailer can establish a list of competitor SKUs and compare their prices against equivalent products over recurring collection cycles.
The analysis can identify:
- Price increases and decreases
- New promotional patterns
- Products repeatedly going out of stock
- New competitor launches
- Changes in category assortment
- Brand-level expansion
- Product visibility changes
These observations can feed pricing, merchandising, and category-management workflows.
A practical competitive dataset
A useful competitive record could contain:
Brand → Product → Category → MRP → Selling Price → Discount → Rating → Reviews → Availability → Timestamp
With historical timestamps, analysts can calculate price changes, discount frequency, stock-out frequency, and assortment growth.
Want to turn marketplace observations into structured competitive intelligence? Connect your fashion data requirements with Real Data API and build a monitoring workflow around your target categories, brands, and SKUs.
Get Insights Now!2020–2026 evolution
Competitive analysis in digital fashion became more dynamic between 2020 and 2026. Earlier marketplace research often relied on periodic manual comparisons, but the growing frequency of promotions, catalog changes, and new product launches increased the value of recurring observations. A single competitor benchmark could no longer capture an entire pricing cycle. Historical data allowed analysts to distinguish regular promotional behavior from unusual price movements and identify recurring patterns by brand or category. The same principle applied to assortment. Tracking product additions and removals over time could reveal whether a competitor was broadening its presence in a particular segment. Ratings and review volumes added another layer by providing observable customer-engagement signals, although they should not be treated as direct measures of sales without supporting evidence. By 2026, competitive intelligence increasingly depended on combining current marketplace information with historical records. This created a more complete analytical picture spanning pricing, availability, assortment, product launches, promotions, and brand activity rather than relying on isolated observations.
How can API delivery improve fashion data workflows?
A Myntra API can support recurring access to structured product information and make it easier to integrate with internal analytics systems, dashboards, databases, and business applications.
For companies with established data infrastructure, API-based delivery can reduce the need for manual file handling.
The workflow can include:
- Product data collection
- Data normalization
- Validation
- Historical storage
- API delivery
- Dashboard integration
- Automated alerts
- Scheduled refreshes
A Myntra fashion dataset delivered through a structured pipeline can contain fields customized to the buyer's analytical requirements.
Example API-ready schema
| Field | Example |
|---|---|
| SKU | Product identifier |
| Brand | Fashion brand |
| Category | Men's Shirts |
| Product | Cotton Casual Shirt |
| MRP | ₹2,499 |
| Selling Price | ₹1,499 |
| Discount | 40% |
| Rating | 4.2 |
| Reviews | 1,250 |
| Availability | In stock |
| Timestamp | Collection date |
API delivery becomes particularly valuable when data must feed multiple systems simultaneously. A business intelligence team could use the feed for dashboards, while pricing analysts could use the same underlying records for benchmarking.
2020–2026 evolution
Between 2020 and 2026, data infrastructure became increasingly integrated into e-commerce decision-making. Fashion companies began connecting marketplace intelligence with pricing systems, business intelligence platforms, product information management tools, and internal databases. This increased the importance of structured delivery formats and machine-readable datasets. Rather than treating scraped information as a standalone spreadsheet, organizations could incorporate marketplace observations into recurring data pipelines. API-oriented delivery supports this model by allowing downstream systems to consume standardized records without repeated manual exports. The underlying requirement also became more sophisticated: businesses wanted historical data, consistent identifiers, normalized categories, and timestamps alongside current product information. From 2020 through 2026, this progression reflects a broader movement from data collection as an isolated research activity toward data integration as part of everyday commercial operations. For fashion companies, the practical benefit is that product and market intelligence can become accessible within existing analytics workflows instead of remaining in disconnected research files.
What can an automated collection system monitor?
A Myntra Scraper can be configured around the specific products, brands, categories, or attributes a business wants to monitor.
The goal should be selective and purposeful collection rather than indiscriminate data accumulation.
Potential monitoring areas
| Monitoring Area | Example Use |
|---|---|
| Products | Catalog tracking |
| Prices | Benchmarking |
| Discounts | Promotion monitoring |
| Brands | Competitor analysis |
| Categories | Assortment research |
| Ratings | Customer-signal tracking |
| Reviews | Feedback analysis |
| Availability | Stock monitoring |
| Images | Visual catalog comparison |
| URLs | Product identification |
A fashion brand could establish a competitor watchlist and track a defined group of products.
Another use case is category monitoring. A footwear company could monitor sneakers, running shoes, casual shoes, and sandals across multiple brands, then compare price bands and assortment depth.
Data quality matters
Automated collection should include validation rules such as:
- Duplicate detection
- Missing-value checks
- Price-format normalization
- Brand normalization
- Category mapping
- Timestamp validation
- Product-ID consistency
These checks help prevent unreliable records from entering downstream analytics.
2020–2026 evolution
The role of automated marketplace collection expanded as fashion catalogs became larger and more frequently updated between 2020 and 2026. Early data projects often focused on collecting product details for one-time research, while later workflows increasingly emphasized recurring monitoring and historical comparisons. This shift was important because fashion marketplaces operate with frequent price changes, promotions, launches, stock movements, and assortment adjustments. Automation reduced repetitive research effort while improving the consistency of collection schedules and data schemas. It also enabled businesses to define narrower monitoring objectives, such as tracking a competitor's top products or an entire category's price distribution. By 2026, the practical value of automated collection increasingly depended on what happened after data capture: normalization, validation, storage, enrichment, and integration determined whether the information could support business decisions. A well-designed workflow therefore treats collection as one component of a larger intelligence pipeline rather than as the final product.
How can historical marketplace records reveal fashion trends?
An Myntra API can support recurring access to structured product information, while a Myntra fashion dataset can provide the historical foundation needed for trend analysis.
Fashion trends are not limited to identifying which products are popular today. Analysts can examine how product categories, price points, brands, discounts, and assortment change over time.
Trend-analysis framework
| Trend Signal | Historical Analysis |
|---|---|
| SKU additions | Category expansion |
| SKU removals | Assortment contraction |
| Price movement | Pricing trends |
| Discount frequency | Promotional cycles |
| Brand presence | Competitive visibility |
| Category depth | Market development |
| Ratings | Customer response |
| Reviews | Engagement patterns |
For example, analysts could track the number of products within a category at monthly intervals and examine whether assortment is expanding or contracting.
Similarly, price histories can reveal whether a category is becoming more promotional or whether certain brands consistently maintain higher price points.
Trend analysis becomes stronger when multiple signals are combined.
2020–2026 evolution
From 2020 to 2026, fashion trend analysis increasingly moved toward measurable digital signals. Marketplace catalogs provided observable information about products, brands, categories, prices, discounts, and customer engagement, allowing researchers to supplement traditional surveys and reports with continuously updated digital observations. Historical snapshots became particularly useful for understanding seasonality, promotional periods, category expansion, and brand activity. Instead of asking only which products were visible at a given moment, analysts could investigate how the catalog changed over weeks, months, and years. This approach also supported more granular research into price bands and assortment structures. However, marketplace visibility remains an observable signal rather than a complete representation of the fashion market; products unavailable online, offline sales, private-label activity, and other channels may not appear in the dataset. The strongest research therefore combines marketplace data with relevant internal, consumer, and market-level sources. Between 2020 and 2026, this multi-source approach became increasingly relevant as fashion businesses sought faster, more evidence-based ways to understand a rapidly changing digital retail environment.
Why Choose Real Data API?
Fashion businesses need data that is structured around their actual commercial questions. Real Data API can support customized marketplace data workflows designed around product, pricing, brand, category, and competitive intelligence requirements.
Key capabilities
- Scalable product data collection
- Structured fashion datasets
- Price and discount monitoring
- Brand-level benchmarking
- Category-level research
- Historical data collection
- Automated data delivery
- API-ready outputs
- Data normalization
- Data validation
- Custom schedules
- Analytics-ready formats
The workflow can be designed for a defined SKU list, selected brands, specific categories, or broader marketplace research.
For teams managing large fashion catalogs, structured data can reduce manual research and create a repeatable foundation for competitive intelligence and market analysis.
Conclusion
A marketplace dataset becomes valuable when it connects product-level observations with meaningful business questions. Fashion brands can use structured product, price, brand, availability, rating, and assortment information to understand competitive activity and changing market conditions.
A well-designed data pipeline combines collection, validation, normalization, historical storage, and delivery. It can support merchandising teams comparing assortment, pricing teams monitoring competitors, researchers studying market trends, and strategy teams evaluating category opportunities.
The key is to move beyond isolated product checks and create a consistent evidence base that can be analyzed over time.
Myntra fashion dataset projects can be customized around the products, brands, categories, locations, attributes, frequency, and delivery format relevant to your business.
Contact Real Data API today to build a structured fashion data solution for product intelligence, competitive monitoring, pricing research, and market-trend analysis!
FAQs
What is a Myntra fashion dataset used for?
A Myntra fashion dataset can organize product names, brands, prices, discounts, categories, ratings, reviews, and availability for competitive research and assortment analysis.
How does Myntra Product Data Scraping help retailers?
Myntra Product Data Scraping automates product-level collection, helping retailers monitor pricing, assortment, discounts, availability, brands, and marketplace changes at scale.
What is Myntra Data Extraction for Fashion Market Research?
Myntra Data Extraction for Fashion Market Research converts marketplace observations into structured records that researchers can analyze across categories, brands, prices, and product trends.
Why use a Myntra fashion web data scraper?
A Myntra fashion web data scraper can automate recurring collection across selected categories or products, reducing manual research effort and creating consistent historical marketplace records.
How does Real Data API support fashion data projects?
Real Data API can support customized data collection and structured delivery for fashion intelligence workflows, including pricing, product, assortment, competitive, and historical analysis.
Latest posts
How Myntra Fashion Dataset Solves Fashion Intelligence Challenges Across Products, Prices, Brands, and Fashion Market Trends?
How Hyatt Travel Dataset Helps Businesses Track Hotels, Room Prices, Amenities, Locations, and Travel Trends?

How Louis Vuitton Fashion Dataset Enables Better Analysis of Luxury Products, Prices, Brands, and Fashion Trends?
How Blinkit Grocery Dataset Enables Smarter Analysis of Products, Prices, Availability, and Quick-Commerce Trends?






.png)



