Introduction
Consumer demand is becoming increasingly local. A restaurant that performs exceptionally well in one neighborhood may struggle in another because customers differ in spending power, cuisine preferences, delivery expectations, promotions, and peak ordering times. For businesses operating across multiple cities or districts, broad market research often fails to capture these differences. This is where Meituan data scraping to track hyperlocal consumer demand can provide a more granular view of local marketplace behavior.
Meituan is one of China's major local commerce platforms, connecting consumers with restaurants, food delivery providers, retailers, and other local services. Its marketplace environment contains valuable signals around restaurant availability, menu offerings, prices, ratings, reviews, promotions, locations, and consumer preferences.
Businesses can also integrate structured workflows around the Meituan API to organize marketplace information into datasets for competitive research, pricing analysis, demand forecasting, restaurant intelligence, and location-level decision-making.
The scale of the platform demonstrates why such data can be valuable. Meituan reported 177 billion instant-delivery orders in 2022, rising to 219 billion in 2023. In 2024, the company reported that annual transaction users exceeded 770 million, while 2025 annual transaction users exceeded 800 million.
For businesses, the opportunity is not simply to collect more information. It is to transform local marketplace signals into actionable intelligence that reveals what customers want, where demand is increasing, how competitors are responding, and which locations offer the strongest opportunities.
Building a Detailed View of Restaurant Supply

Restaurant intelligence starts with understanding what customers can actually purchase in each location. Extract Meituan restaurant and menu data enables businesses to organize information such as restaurant names, cuisines, addresses, menu items, prices, ratings, reviews, discounts, delivery information, operating hours, and availability.
This information becomes especially useful when analyzed at neighborhood or city level. A business can compare the average price of similar meals, identify cuisines with high representation, detect new restaurant openings, and monitor menu changes over time. For example, if a district experiences a rapid increase in affordable Korean, Japanese, or healthy-food restaurants, the pattern may indicate a change in local consumer preferences.
Historical comparison is equally important. A dataset collected repeatedly from 2020 through 2026 can show how restaurant supply evolved and whether pricing or menu diversity changed alongside demand. Rather than examining isolated restaurant pages, businesses can create structured datasets for thousands of listings.
| Year | Useful marketplace indicator | Business interpretation |
|---|---|---|
| 2020 | Restaurant availability and menu pricing | Establish baseline supply |
| 2021 | Menu and promotion changes | Identify post-disruption adjustments |
| 2022 | 177B instant-delivery orders | Expanding delivery ecosystem |
| 2023 | 219B instant-delivery orders | Higher transaction intensity |
| 2024 | 770M+ annual transaction users | Larger consumer marketplace |
| 2025 | 800M+ annual transaction users | Continued platform scale |
| 2026 | Q1 operating indicators | Monitor current market direction |
Meituan reported 177 billion instant-delivery orders in 2022 and 219 billion in 2023, while annual transaction users surpassed 770 million in 2024 and 800 million in 2025.
For restaurant groups, food manufacturers, investors, and market researchers, this structured approach makes it easier to identify underserved locations, benchmark competitors, and understand how local restaurant ecosystems are changing.
Turning Location Signals Into Competitive Intelligence
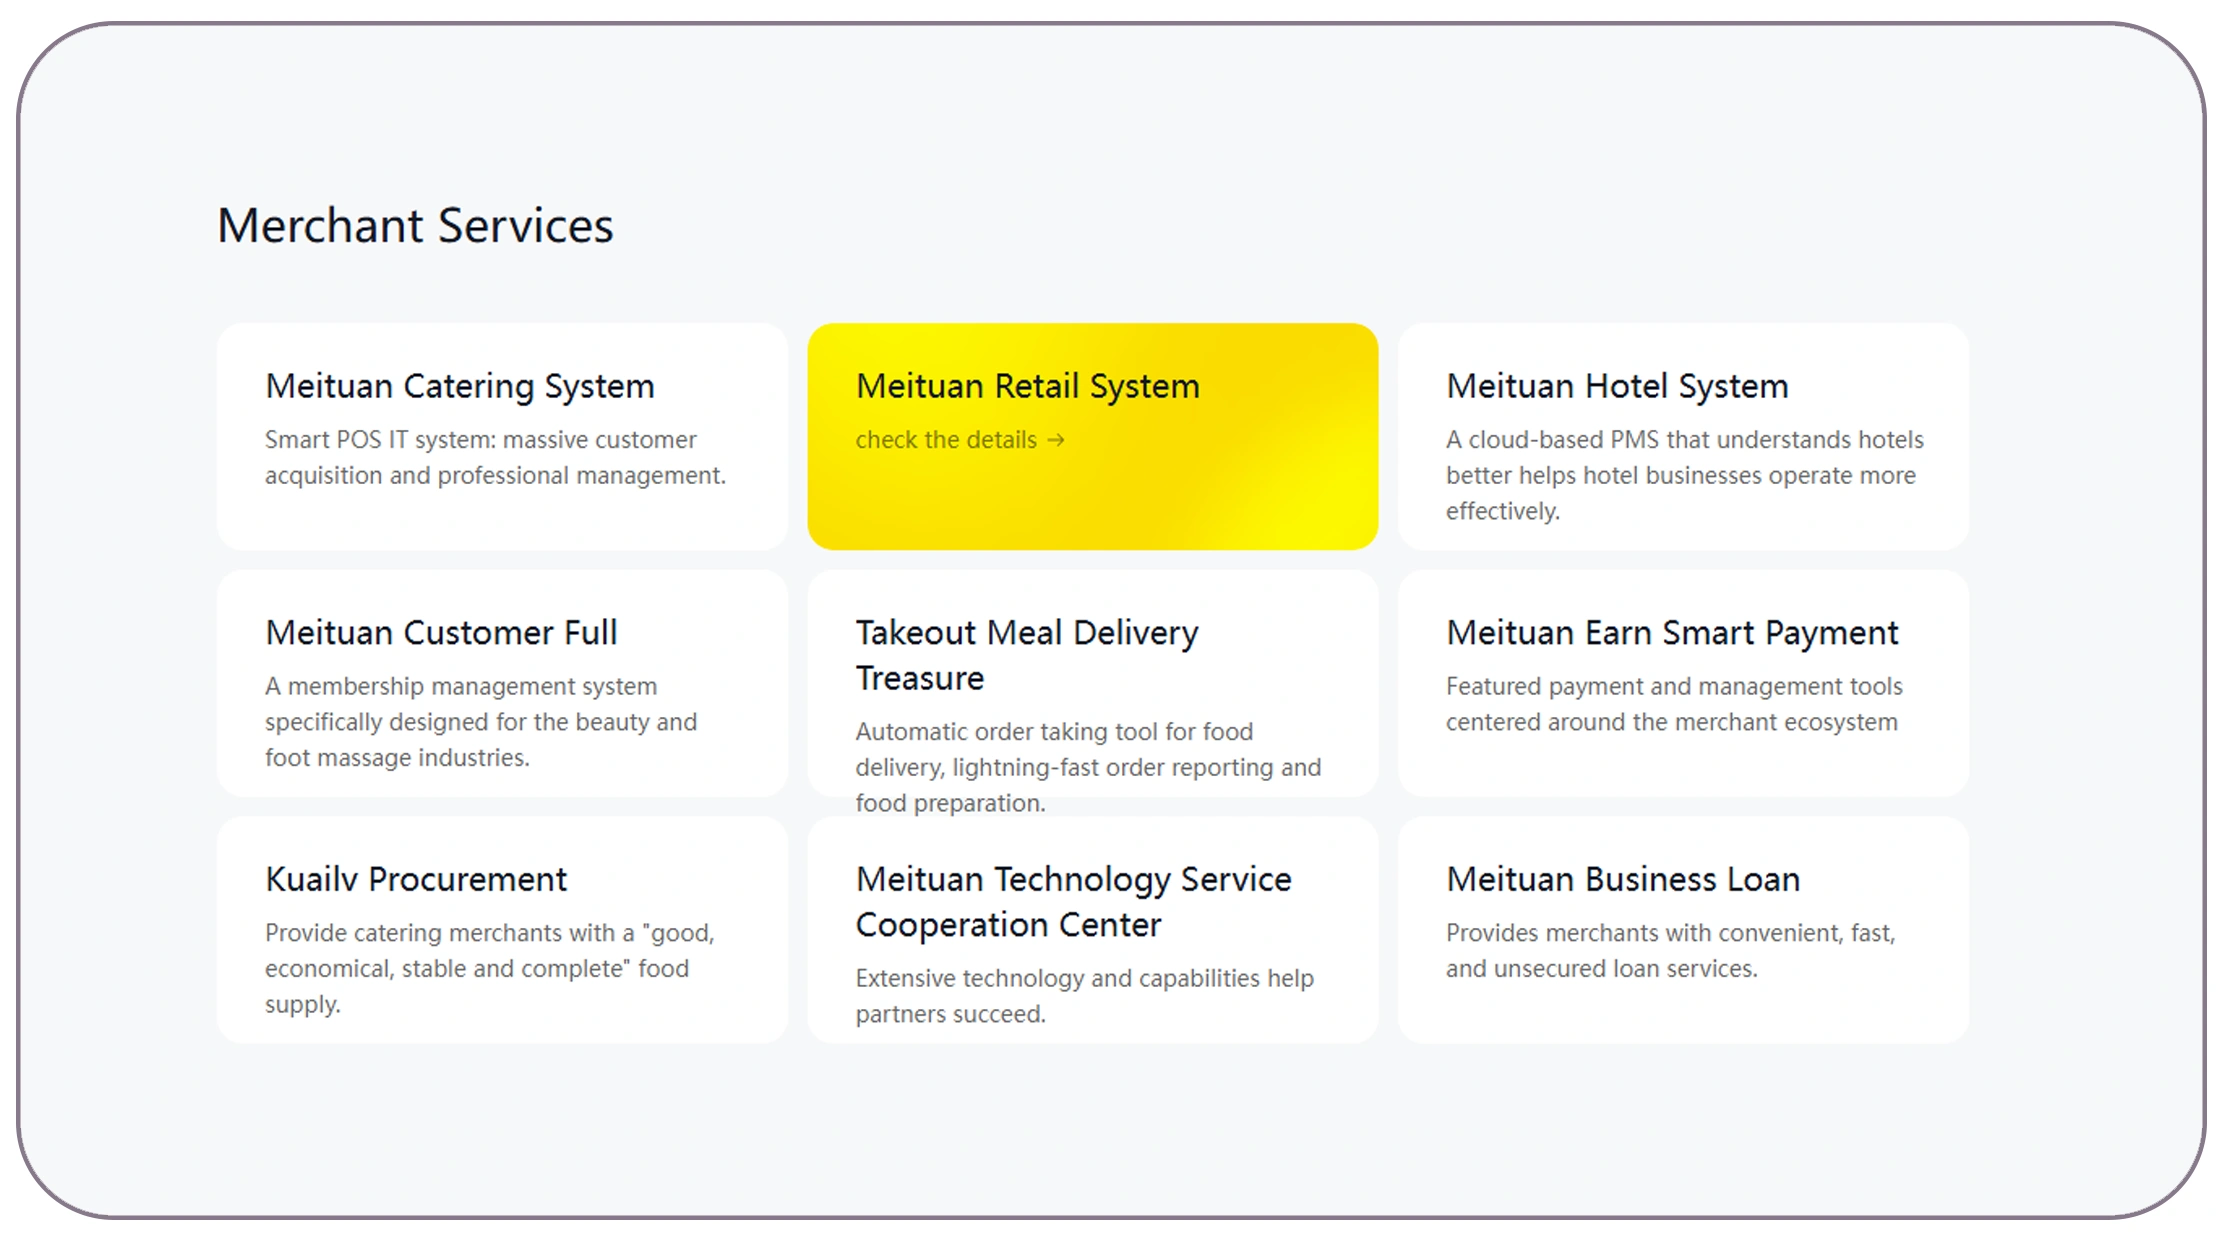
Local markets rarely move uniformly. Consumer demand can change significantly between districts because of demographics, offices, universities, residential developments, tourism, weather, events, and income levels. Real-time hyperlocal market data intelligence from Meituan helps businesses observe these differences instead of depending entirely on citywide averages.
A hyperlocal intelligence system can combine restaurant counts, cuisine categories, menu prices, promotional activity, ratings, reviews, and location information. Businesses can then create neighborhood-level dashboards that reveal changes in competitive density and consumer-facing offers.
For example, suppose a company plans to launch a premium healthy-food concept. City-level restaurant counts may suggest that competition is high. However, neighborhood-level data could reveal that several districts have strong demand signals but relatively few premium competitors. This creates a more precise expansion strategy.
The same data can support pricing intelligence. A brand can monitor competing restaurants selling comparable meals and calculate changes in median prices, discount levels, delivery charges, and promotional frequency.
| Period | Key Meituan scale signal | Intelligence opportunity |
|---|---|---|
| 2020 | Baseline digital local-commerce behavior | Establish historical benchmarks |
| 2021 | Increasing marketplace activity | Track recovery and supply changes |
| 2022 | 177B instant-delivery orders | Analyze delivery-driven demand |
| 2023 | 219B instant-delivery orders | Expand competitive monitoring |
| 2024 | 770M+ annual transaction users | Strengthen consumer segmentation |
| 2025 | 800M+ annual transaction users | Monitor broader local demand |
| 2026 Q1 | Current-quarter business indicators | Detect emerging changes |
Meituan's 2024 results reported more than 770 million annual transaction users and 14.5 million annual active merchants. The company also reported that its on-demand delivery daily order peak reached 98 million orders during the 2024 Liqiu period.
This scale makes location-level analysis particularly valuable. Instead of asking whether demand is increasing nationally, businesses can ask which districts are changing, which categories are growing, and which competitors are capturing that demand.
Tracking Shifts in Food Delivery Behavior

Food delivery markets change quickly. New restaurants appear, menus are revised, discounts change, and consumer preferences shift according to season, income, events, and convenience. Web scraping food delivery trends with Meituan allows businesses to create a historical record of these changes and identify patterns that may otherwise be missed.
One of the most useful approaches is repeated data collection. Instead of capturing marketplace information once, businesses can collect it daily, weekly, or monthly. Each snapshot can contain restaurant ranking, cuisine, menu items, prices, ratings, review counts, promotions, and availability.
Over time, these snapshots can become a demand-intelligence dataset. Analysts can identify restaurants gaining visibility, categories experiencing increased competition, and menu items whose prices are changing faster than the market average.
The growth of Meituan's delivery ecosystem provides context for this analysis. Instant-delivery orders increased from 177 billion in 2022 to 219 billion in 2023. Meituan also reported that 2024 daily peak instant-delivery orders reached 98 million.
| Year | Reported scale indicator | What analysts can study |
|---|---|---|
| 2020 | Historical baseline | Restaurant and menu behavior |
| 2021 | Historical baseline | Supply and pricing changes |
| 2022 | 177B instant-delivery orders | Delivery demand patterns |
| 2023 | 219B instant-delivery orders | Category and frequency trends |
| 2024 | 98M peak daily instant-delivery orders | Peak-demand behavior |
| 2025 | 800M+ annual transaction users | Consumer-market expansion |
| 2026 Q1 | 910B RMB quarterly revenue | Current platform trajectory |
Meituan reported 910 billion RMB in revenue for Q1 2026, up 5.6% year over year, with core local commerce revenue of 641 billion RMB.
For businesses, the important insight is that delivery data should not be treated simply as a list of restaurants. When collected consistently, it can become a time-series source for understanding local demand, competitive movement, pricing behavior, and consumer-facing trends.
Automating Large-Scale Marketplace Monitoring
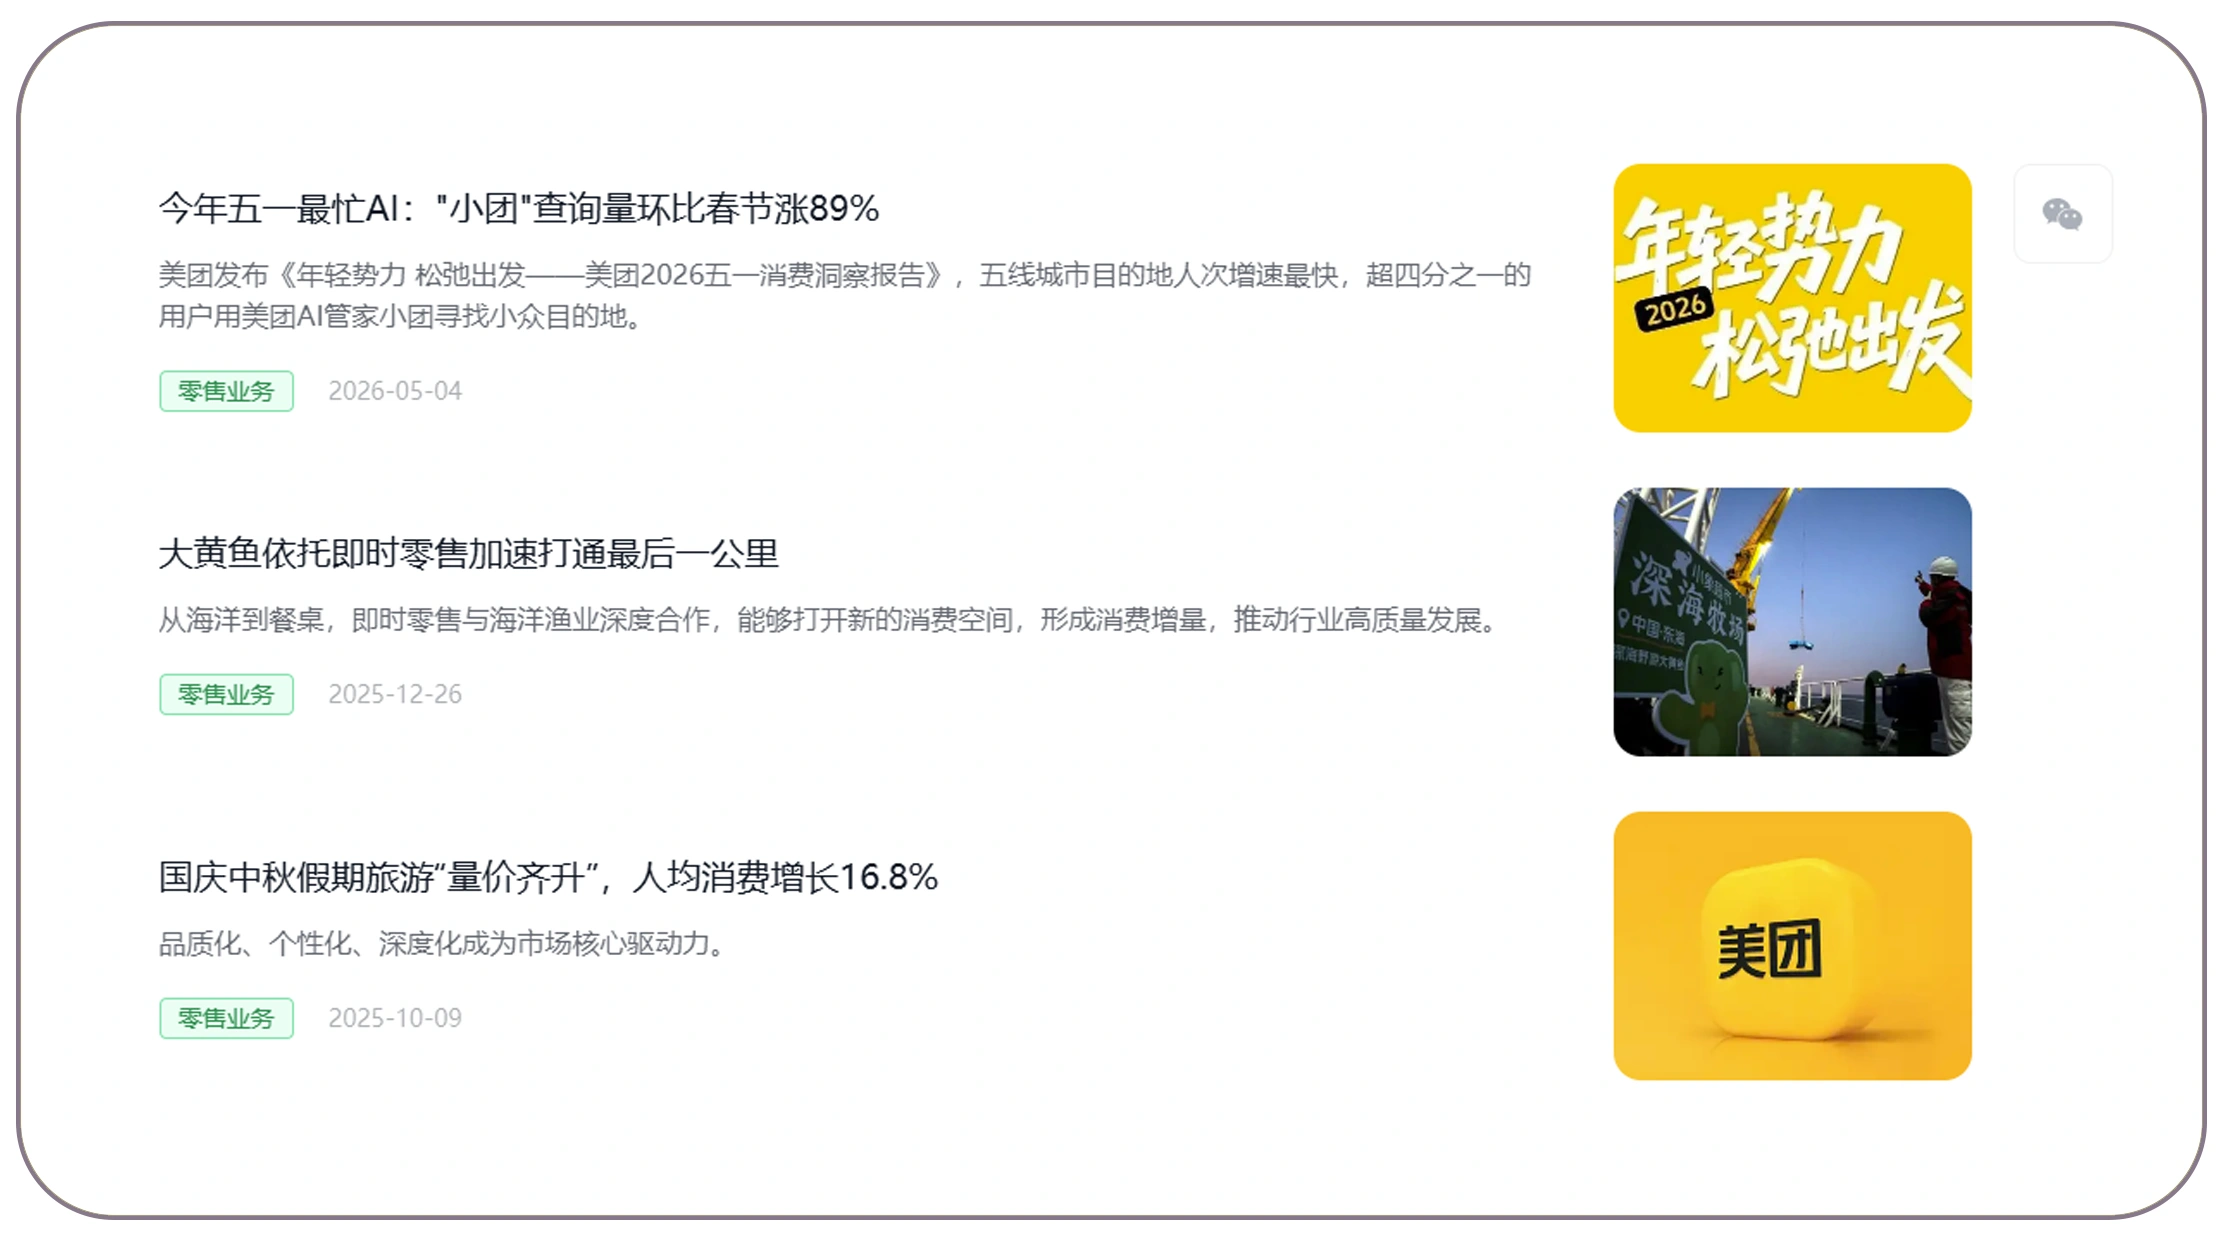
Manual data collection becomes difficult when a business needs to monitor hundreds or thousands of restaurants across multiple cities. A Meituan Scraper can automate repetitive collection processes and transform marketplace information into structured records.
A scalable workflow can capture restaurant identifiers, names, categories, locations, menu items, prices, ratings, review counts, promotions, operating status, and other publicly available fields. The resulting records can then be stored in databases, spreadsheets, cloud storage, or analytics platforms.
Automation also improves monitoring frequency. A company tracking competitor prices may require daily snapshots, while a market research team may only need weekly or monthly collections. The frequency can be adjusted according to the business objective.
A useful monitoring architecture can divide the process into four stages:
collection, validation, normalization, and analysis. Collection gathers the available marketplace information. Validation removes incomplete or duplicate records. Normalization standardizes restaurant names, categories, currencies, and location fields. Analysis converts the cleaned dataset into business metrics.
| Year | Monitoring priority | Example output |
|---|---|---|
| 2020 | Historical reconstruction | Baseline restaurant dataset |
| 2021 | Competitive changes | Restaurant and price comparison |
| 2022 | Delivery expansion | Category and location trends |
| 2023 | Marketplace growth | Competitive density analysis |
| 2024 | User and merchant scale | Broader market segmentation |
| 2025 | Consumer-market scale | Hyperlocal demand monitoring |
| 2026 | Current signals | Near-real-time dashboards |
Meituan's reported scale has continued to expand: annual transaction users exceeded 770 million in 2024 and 800 million in 2025. In 2025, the company also reported more than 260 billion RMB in annual R&D investment, representing a 23% increase.
Automated collection therefore becomes especially useful for companies that need repeatable competitive intelligence rather than one-time research. With consistent snapshots, analysts can compare today's marketplace against historical conditions and identify meaningful changes.
Creating a Scalable Data Pipeline for Food Intelligence
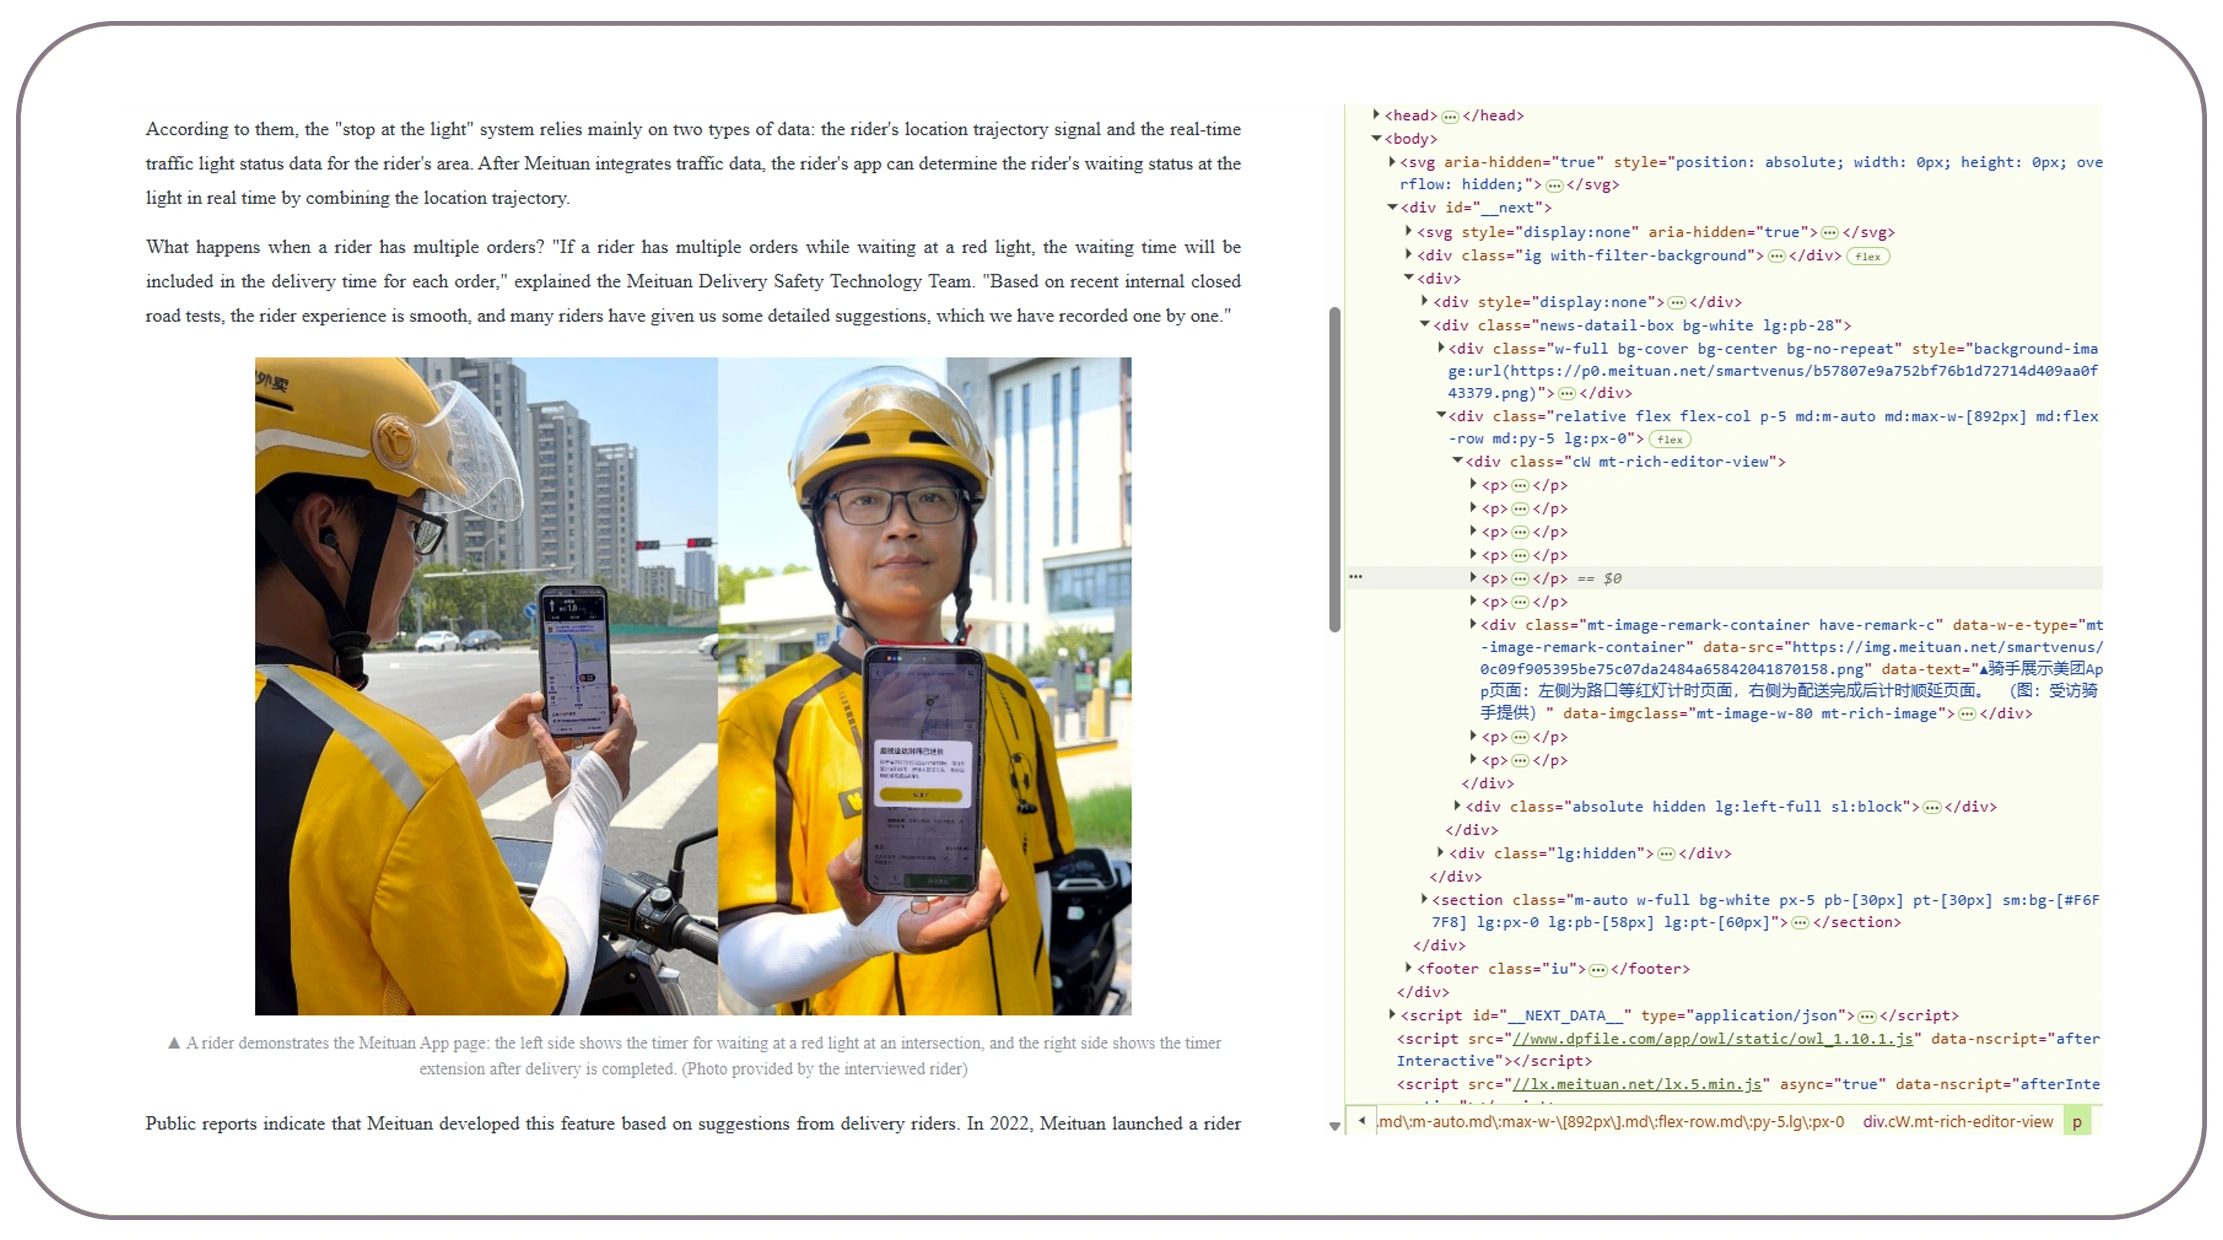
A Food Data Scraping API can make marketplace intelligence easier to integrate into existing analytics workflows. Instead of manually downloading datasets, businesses can connect structured food-market information with dashboards, data warehouses, pricing systems, business intelligence tools, or internal applications.
The value comes from combining multiple fields. Restaurant names alone have limited analytical value. Restaurant names combined with cuisine, menu items, price, rating, review count, location, promotion, and availability can provide a much stronger foundation for competitive analysis.
Businesses can use the pipeline to create metrics such as average menu price, cuisine concentration, promotional intensity, restaurant density, price movement, rating distribution, and new-listing growth.
A 2020-2026 dataset can also support historical benchmarking. Analysts can compare how restaurant categories changed over time, identify locations where competition accelerated, and evaluate whether pricing movements correlate with changing marketplace activity.
| Year | Data-pipeline focus | Potential KPI |
|---|---|---|
| 2020 | Historical data capture | Baseline price |
| 2021 | Market normalization | Restaurant count |
| 2022 | Delivery expansion | Order-related demand signals |
| 2023 | Increased activity | Category growth |
| 2024 | Broader consumer base | User-market segmentation |
| 2025 | Large-scale marketplace | Competitive intensity |
| 2026 Q1 | Current monitoring | Recent price and supply changes |
Meituan's 2025 results reported more than 800 million annual transaction users, while its 2026 Q1 results showed revenue of 910 billion RMB and core local commerce revenue of 641 billion RMB.
For data teams, API-based delivery can also improve consistency. Instead of maintaining separate scraping scripts for individual analytical projects, structured outputs can feed multiple downstream systems. This makes it easier to update datasets, automate reporting, and support different teams with the same underlying marketplace intelligence.
Building Historical Models for Demand Forecasting

A Food Dataset becomes considerably more valuable when it contains historical observations rather than a single snapshot. Time-series data allows businesses to identify trends, compare periods, detect anomalies, and develop models for future demand.
For example, an analyst could track the average price of a specific cuisine across selected districts from 2020 through 2026. A separate model could measure the number of competing restaurants, menu diversity, average ratings, review growth, and promotional frequency. These variables can then be compared to identify areas where market conditions are changing.
Historical data can also support location expansion. A company considering a new restaurant can examine competitor density, price levels, cuisine popularity, and changes in marketplace supply. Locations with increasing demand indicators and limited competition may deserve closer evaluation.
| Year | Historical intelligence objective | Example analysis |
|---|---|---|
| 2020 | Establish baseline | Price and restaurant availability |
| 2021 | Compare recovery | Supply and menu changes |
| 2022 | Measure delivery expansion | Demand and category activity |
| 2023 | Detect accelerating trends | Competition and pricing |
| 2024 | Analyze broader adoption | Consumer and merchant growth |
| 2025 | Measure marketplace maturity | Hyperlocal segmentation |
| 2026 | Update forecasting models | Current-quarter signals |
The broader marketplace trajectory supports the need for historical modeling. Meituan reported 219 billion instant-delivery orders in 2023, more than 770 million annual transaction users in 2024, and more than 800 million annual transaction users in 2025.
For analysts, the objective is not simply to predict how many orders a restaurant may receive. Historical marketplace data can help identify where demand is moving, which categories are becoming crowded, how prices are evolving, and where new opportunities may emerge.
Why Choose Real Data API?
Real Data API can help businesses turn marketplace information into structured, analysis-ready datasets for competitive intelligence and market research. The focus is on making large-scale data collection easier to integrate into business workflows while supporting repeatable collection and analysis.
For companies focused on Meituan data scraping to track hyperlocal consumer demand, a structured data pipeline can reduce the effort involved in collecting, cleaning, and organizing marketplace information. Instead of relying on disconnected manual research, businesses can build datasets that support recurring analysis.
A practical workflow can cover restaurant discovery, menu and pricing collection, location-level comparison, data normalization, historical storage, and delivery into analytics environments. This allows teams to focus more on interpreting market signals and less on repetitive data preparation.
Real Data API can be particularly useful for organizations conducting restaurant competitor research, location intelligence, pricing analysis, food-market research, consumer trend analysis, and demand forecasting. By transforming marketplace observations into structured datasets, businesses can build repeatable intelligence processes that scale across cities and categories.
Conclusion
Hyperlocal consumer behavior can change much faster than traditional market reports can capture. Restaurant openings, menu changes, pricing adjustments, promotions, ratings, reviews, and category shifts can create meaningful differences between neighborhoods within the same city.
That makes marketplace data a valuable resource for companies seeking more precise consumer intelligence. From restaurant benchmarking and pricing analysis to location selection and demand forecasting, structured Meituan information can help businesses understand where demand is increasing and how competitors are responding.
Meituan data scraping to track hyperlocal consumer demand provides a practical approach for transforming marketplace signals into structured intelligence. When collected consistently, this information can reveal local patterns that broad market averages often hide.
Connect with Real Data API to build scalable restaurant, pricing, competitor, and consumer-demand datasets for smarter market decisions!
Latest posts
Extract Flipkart Product Review Data For Brand Analysis - How To Track Customer Sentiment, Ratings, And Product Performance?

How To Track Prices, Products, And Consumer Demand When Scrape China's Social Commerce Market Using Pinduoduo Data?
How to Track Ratings, Prices, and Consumer Preferences When Scrape CellarTracker wine data to identify wine trends?

How to Scrape DAZN streaming data for sports viewing trends to Identify Popular Sports, Events, and Viewer Preferences?







.png)



