Introduction
The fastest way to understand wine market movements is to combine ratings, reviews, prices, popularity, regions, vintages, and consumer behavior in one structured dataset. Scrape CellarTracker wine data to identify wine trends can help wine retailers, distributors, brands, and researchers turn marketplace information into actionable insights.
A practical 2026 planning example shows why historical data matters. If a business monitors 10,000 wine listings monthly, even a small change in average price or rating can reveal meaningful market movement.
| Year | Illustrative Wine Listings Tracked | Monthly Records | Primary Insight |
|---|---|---|---|
| 2020 | 2,000 | 10,000 | Basic popularity |
| 2021 | 3,000 | 18,000 | Rating changes |
| 2022 | 4,500 | 30,000 | Price movements |
| 2023 | 6,000 | 45,000 | Consumer preferences |
| 2024 | 8,000 | 65,000 | Regional trends |
| 2025 | 10,000 | 90,000 | Competitive analysis |
| 2026 | 15,000 | 140,000 | Automated wine intelligence |
These figures are hypothetical planning examples, not reported CellarTracker statistics.
Wine businesses often struggle with fragmented information. Ratings sit separately from prices. Reviews provide consumer opinions. Vintage and region information add further context.
Automated data collection can bring these signals together.
A CellarTracker API workflow can also help businesses integrate structured wine information into internal dashboards, analytics systems, research databases, or market intelligence applications, depending on the available data-access method and permissions.
The target audience for this approach includes wine retailers, distributors, importers, producers, hospitality businesses, market researchers, and technology teams that need better visibility into wine demand.
The core goal is simple: collect relevant data consistently, organize it into a historical dataset, and use it to identify meaningful changes in wine preferences and pricing.
How Can Wine Data Improve Market Research?
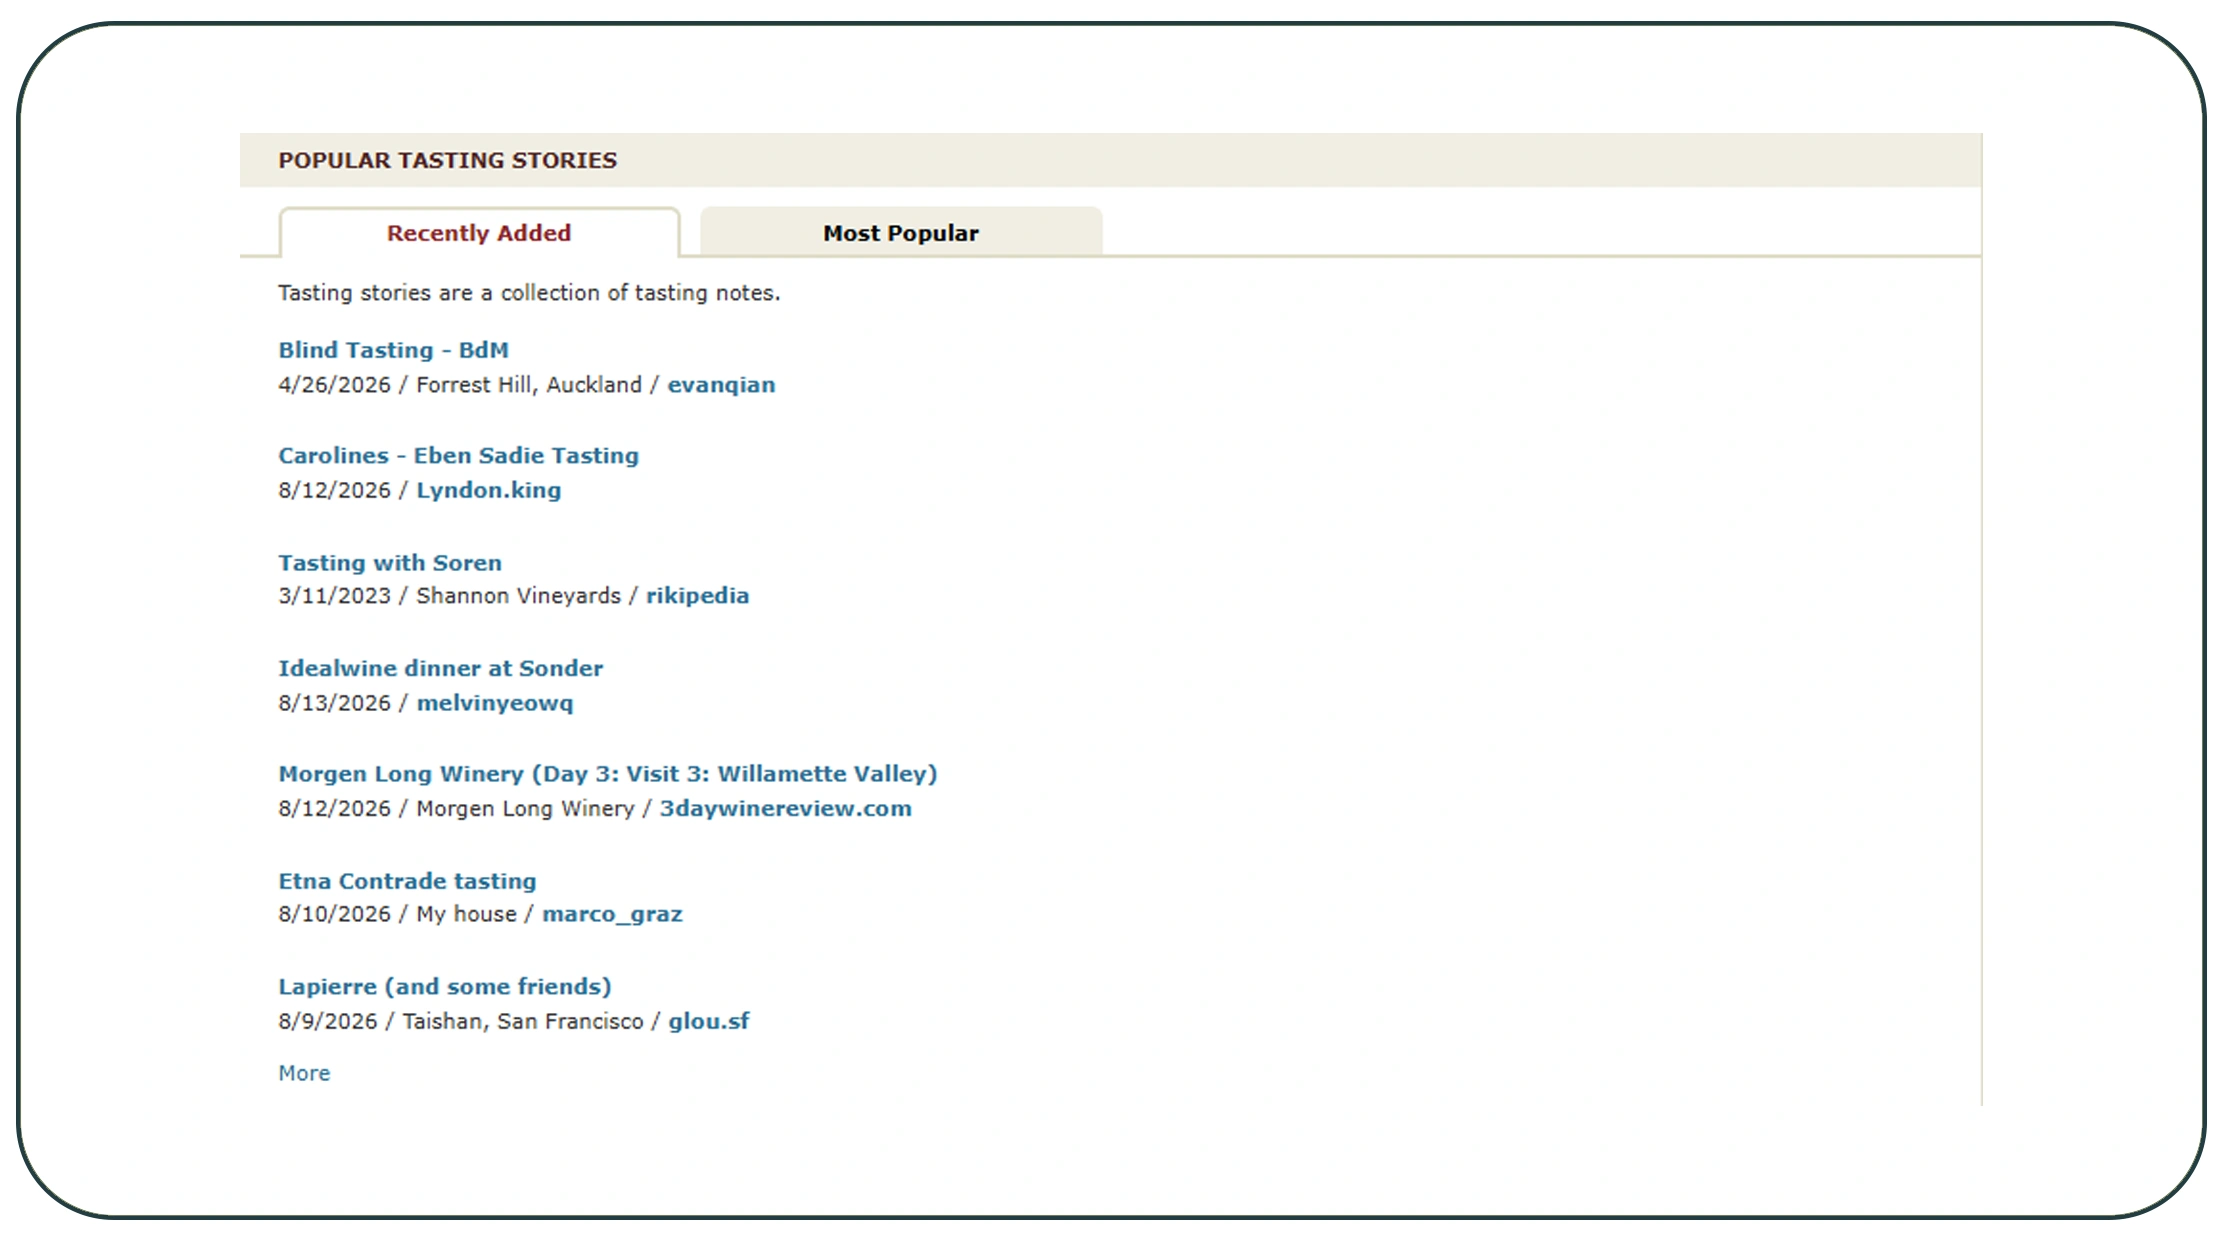
CellarTracker data scraping for wine market research can help businesses move beyond occasional manual research. Instead of checking individual wine listings, teams can create a broader dataset for comparison and analysis.
Wine market research often requires several variables. A retailer may want to know which regions are gaining attention. A distributor may want to identify wines with strong ratings but limited availability. A pricing team may want to compare similar wines across price ranges.
Automated collection can bring these variables together.
Useful fields can include:
- Wine name.
- Producer.
- Vintage.
- Region.
- Country.
- Varietal.
- Rating.
- Review count.
- Review text.
- Price.
- Availability.
- Popularity indicators.
- Product URL.
- Collection timestamp.
Historical tracking adds another layer of value. A single snapshot shows the current situation. Repeated observations show movement.
For example, a wine with a stable rating but rising review activity may indicate increasing consumer interest. A wine with a strong rating and falling price may present a different market opportunity.
| Year | Illustrative Wines Monitored | Rating Records | Price Records |
|---|---|---|---|
| 2020 | 2,000 | 8,000 | 6,000 |
| 2021 | 2,800 | 12,000 | 9,000 |
| 2022 | 3,800 | 18,000 | 14,000 |
| 2023 | 5,000 | 25,000 | 20,000 |
| 2024 | 7,000 | 36,000 | 30,000 |
| 2025 | 10,000 | 50,000 | 42,000 |
| 2026 | 15,000 | 75,000 | 65,000 |
The figures above are illustrative.
A structured dataset can support several research questions.
Which regions are becoming more popular? Which producers receive the most reviews? Which wines maintain strong ratings over time? Which price segments attract more attention?
Businesses can then segment results by region, varietal, vintage, producer, or price range.
This approach saves research time. It also creates a repeatable process.
Instead of conducting the same manual search every month, analysts can refresh the dataset and compare new observations against historical records.
That makes wine market research more measurable and easier to scale.
How Can Popularity Data Reveal Emerging Wine Preferences?
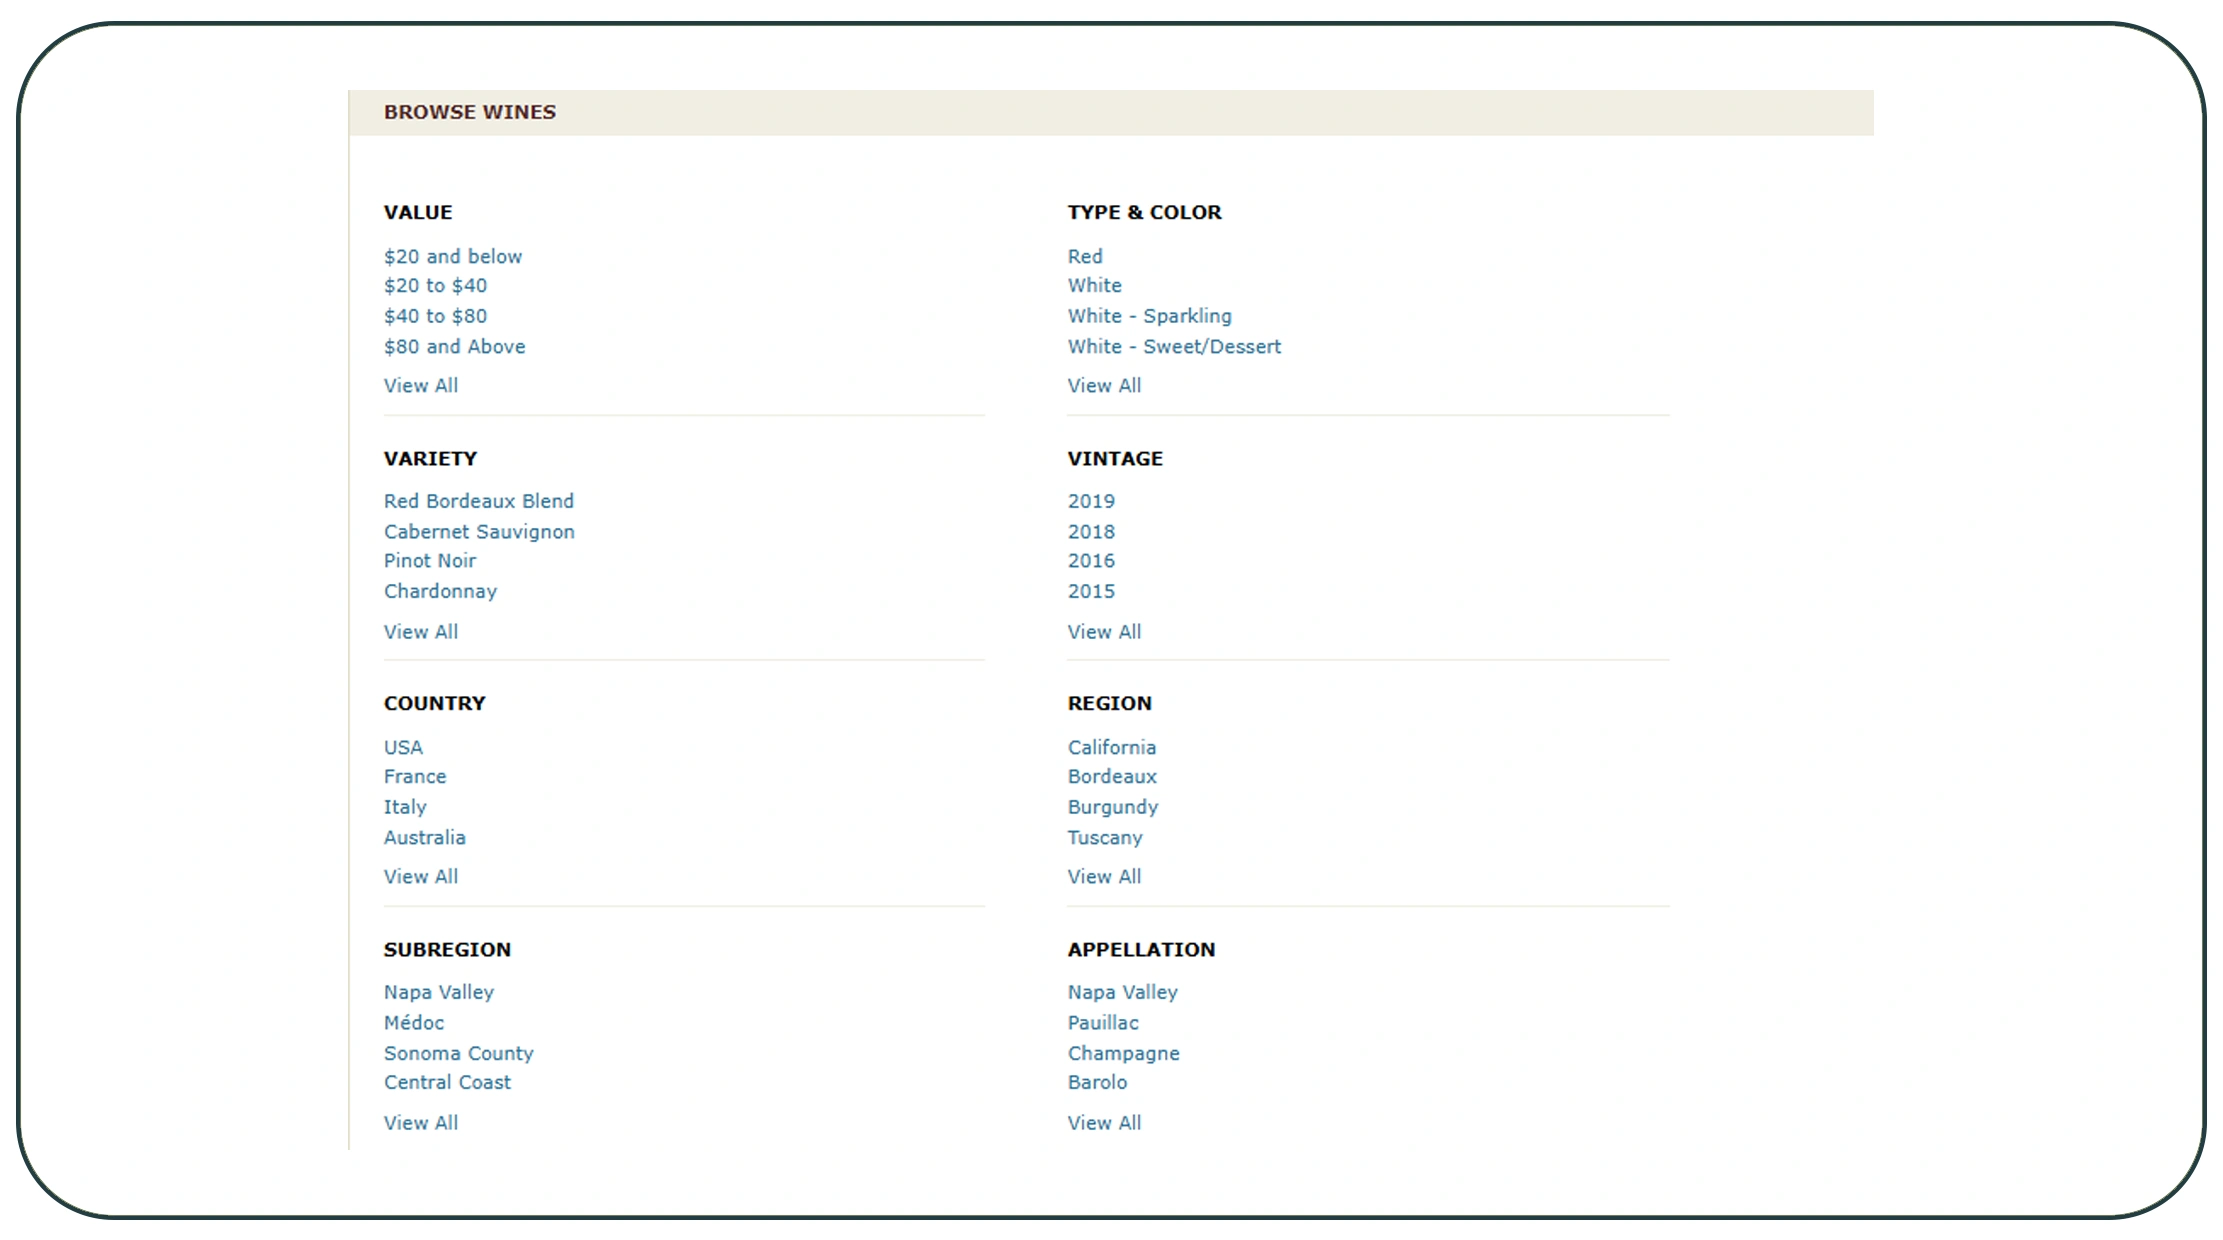
CellarTracker Data Extraction using wine popularity trends can help businesses understand what consumers are paying attention to over time.
Popularity is useful because ratings alone do not always explain market interest. A wine can have a high rating but limited consumer activity. Another wine may have a slightly lower rating but attract a growing number of reviews.
Businesses can combine several signals.
Review volume can indicate attention. Rating changes can indicate satisfaction. Price movements can indicate market positioning. Vintage information can show how interest shifts between releases.
A simple trend score can combine these variables.
For example:
Trend Score = Review Growth + Rating Stability + Popularity Growth + Price Movement
The formula is an illustrative framework. Businesses can adjust the weighting based on their objectives.
| Year | Illustrative Review Growth | Rating Stability | Popularity Signal |
|---|---|---|---|
| 2020 | 5% | Stable | Low |
| 2021 | 8% | Stable | Moderate |
| 2022 | 12% | Improving | Moderate |
| 2023 | 18% | Stable | High |
| 2024 | 24% | Improving | High |
| 2025 | 31% | Stable | Very High |
| 2026 | 38% | Improving | Very High |
These values are hypothetical examples.
The real advantage comes from comparing multiple time periods.
Suppose a wine receives 200 new reviews in one year and 400 in the next. That doubling in activity may indicate rising attention. Analysts can then check whether price, rating, region, or vintage changed during the same period.
Popularity analysis can also identify emerging categories.
A retailer may discover that wines from a specific region are gaining review activity faster than established categories. A distributor can use this information when evaluating future inventory.
The same process can identify declining interest.
If review activity drops across several periods, businesses can investigate whether price, availability, ratings, or competing products explain the change.
Trend analysis should therefore focus on direction rather than one isolated number.
Historical data makes these comparisons possible.
How Can Ratings and Reviews Support Consumer Analysis?
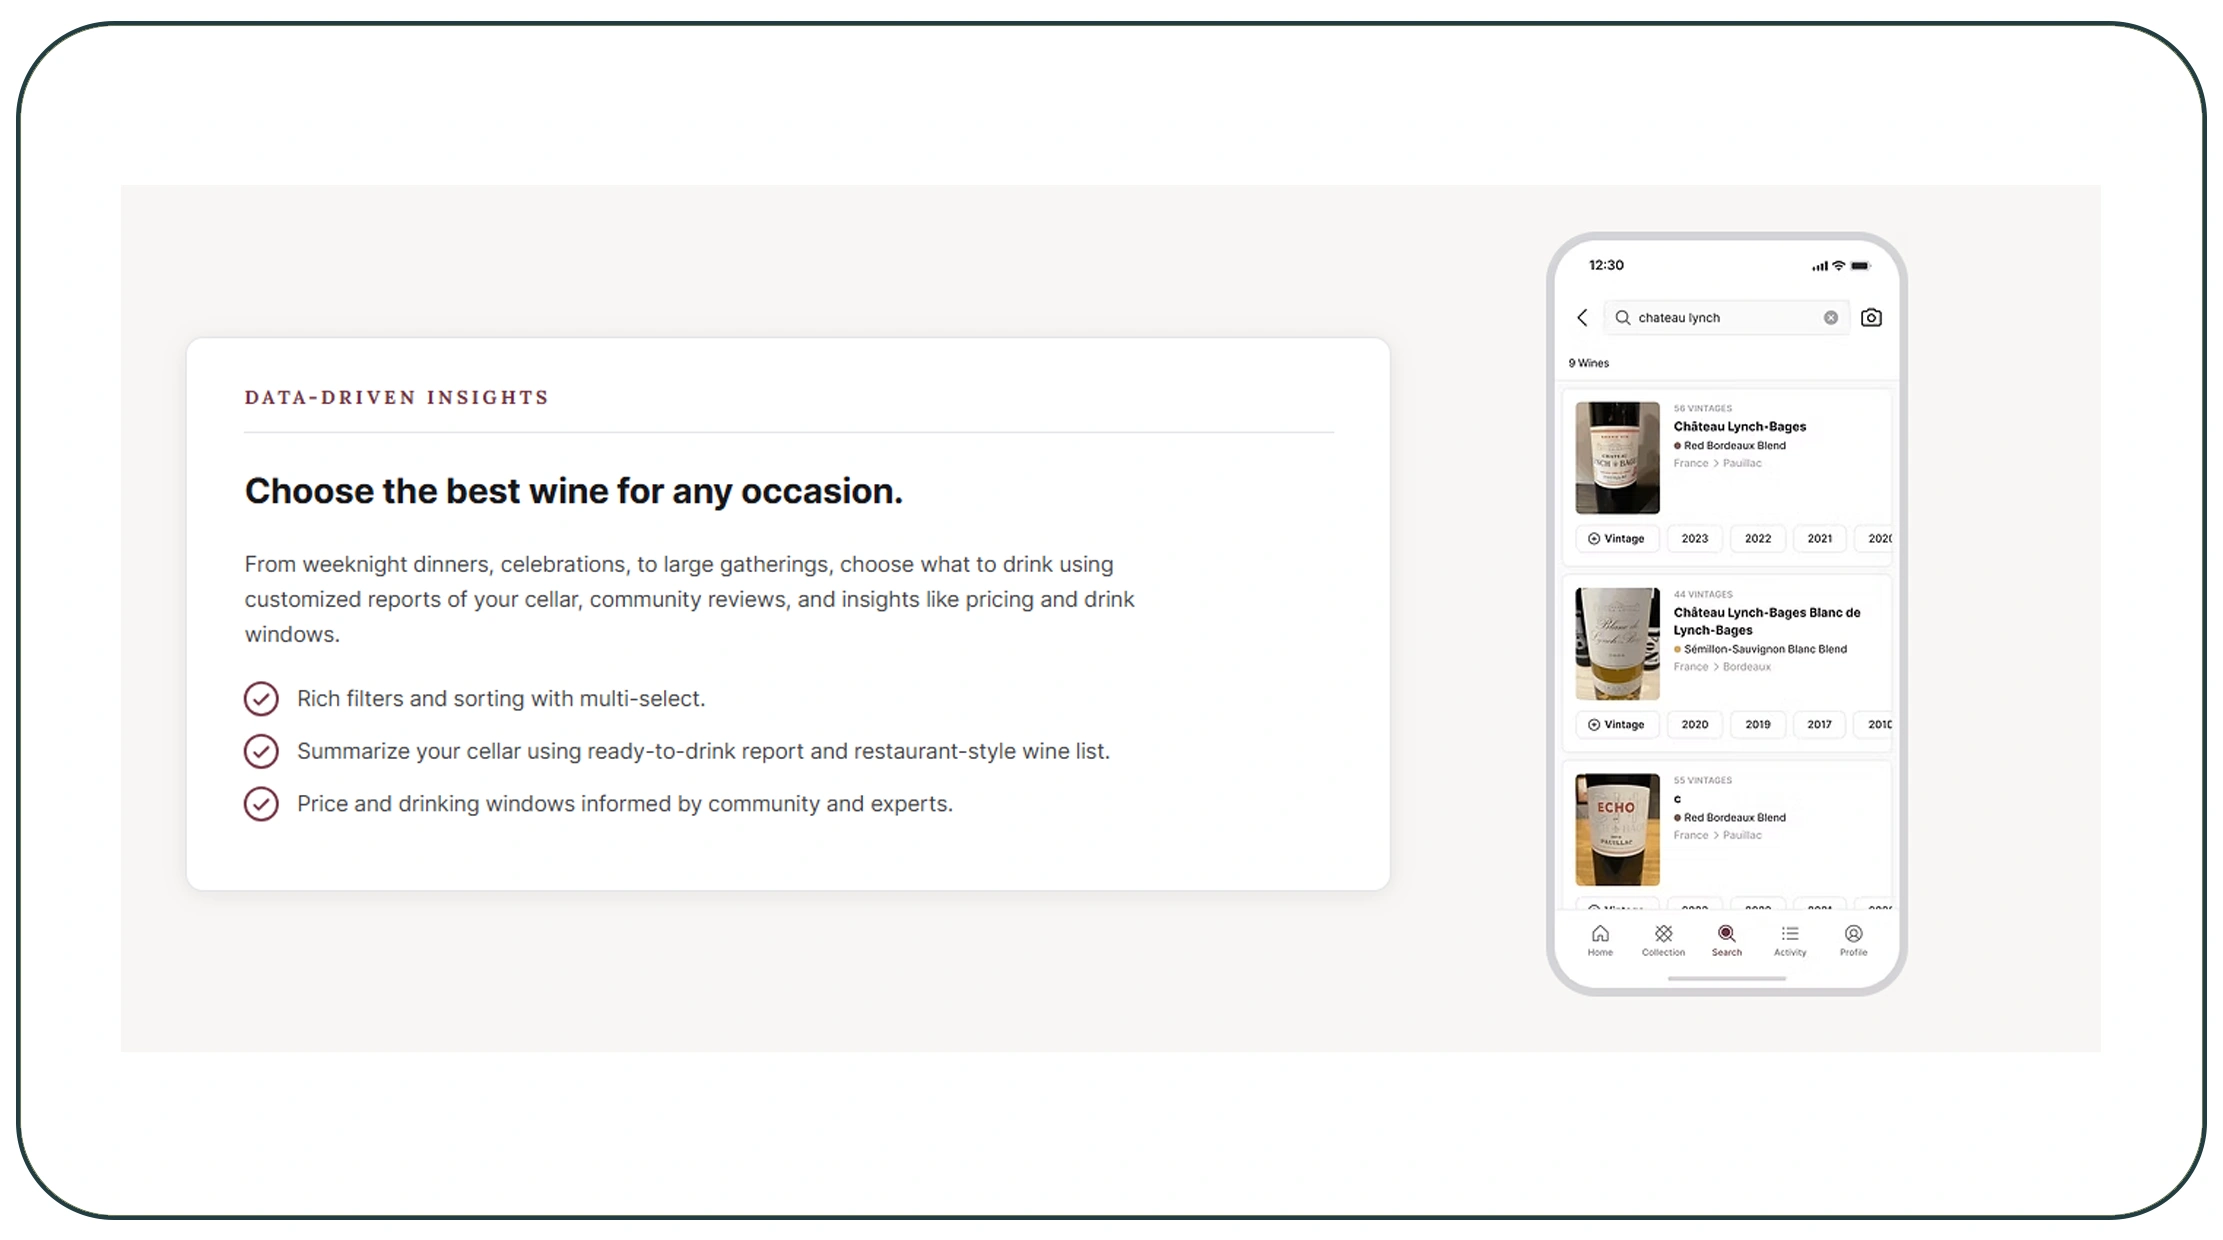
Web Scraping CellarTracker wine ratings and reviews can provide valuable signals about consumer preferences when collected and analyzed responsibly.
Ratings provide a simple numerical signal. Reviews provide context.
A rating may show that consumers like a wine. Review text can explain why.
Review analysis can identify recurring themes such as:
- Taste.
- Aroma.
- Value.
- Aging potential.
- Food pairing.
- Region.
- Vintage quality.
- Packaging.
- Price perception.
Businesses can classify review language into broader themes.
For example, analysts may find that consumers frequently mention "value" for wines within a specific price range. Another group may focus more heavily on vintage or region.
| Year | Illustrative Reviews Analyzed | Common Analysis Focus |
|---|---|---|
| 2020 | 10K | Overall ratings |
| 2021 | 18K | Rating distribution |
| 2022 | 30K | Review themes |
| 2023 | 45K | Consumer sentiment |
| 2024 | 70K | Value perception |
| 2025 | 100K | Regional preferences |
| 2026 | 150K | Multi-factor trend analysis |
These numbers are hypothetical.
A structured review dataset can support sentiment analysis. Positive, neutral, and negative comments can be grouped.
However, businesses should avoid treating sentiment as a perfect measure of consumer demand. Reviews represent the behavior of reviewers. They may not represent the entire wine-buying population.
That distinction matters.
Ratings can also be segmented by vintage, producer, region, or varietal.
For example, a producer may have a strong average rating across its portfolio but weaker ratings for a specific vintage. That difference can guide inventory or promotional decisions.
Review frequency can provide another signal.
A sudden increase in reviews may indicate greater visibility. When combined with price data, businesses can investigate whether promotional activity or market positioning contributed to the change.
This creates a richer view of consumer preferences than rating averages alone.
The goal is not simply to collect more reviews. The goal is to transform review information into structured signals that support better decisions.
What Can a Structured Wine Dataset Reveal About the Market?
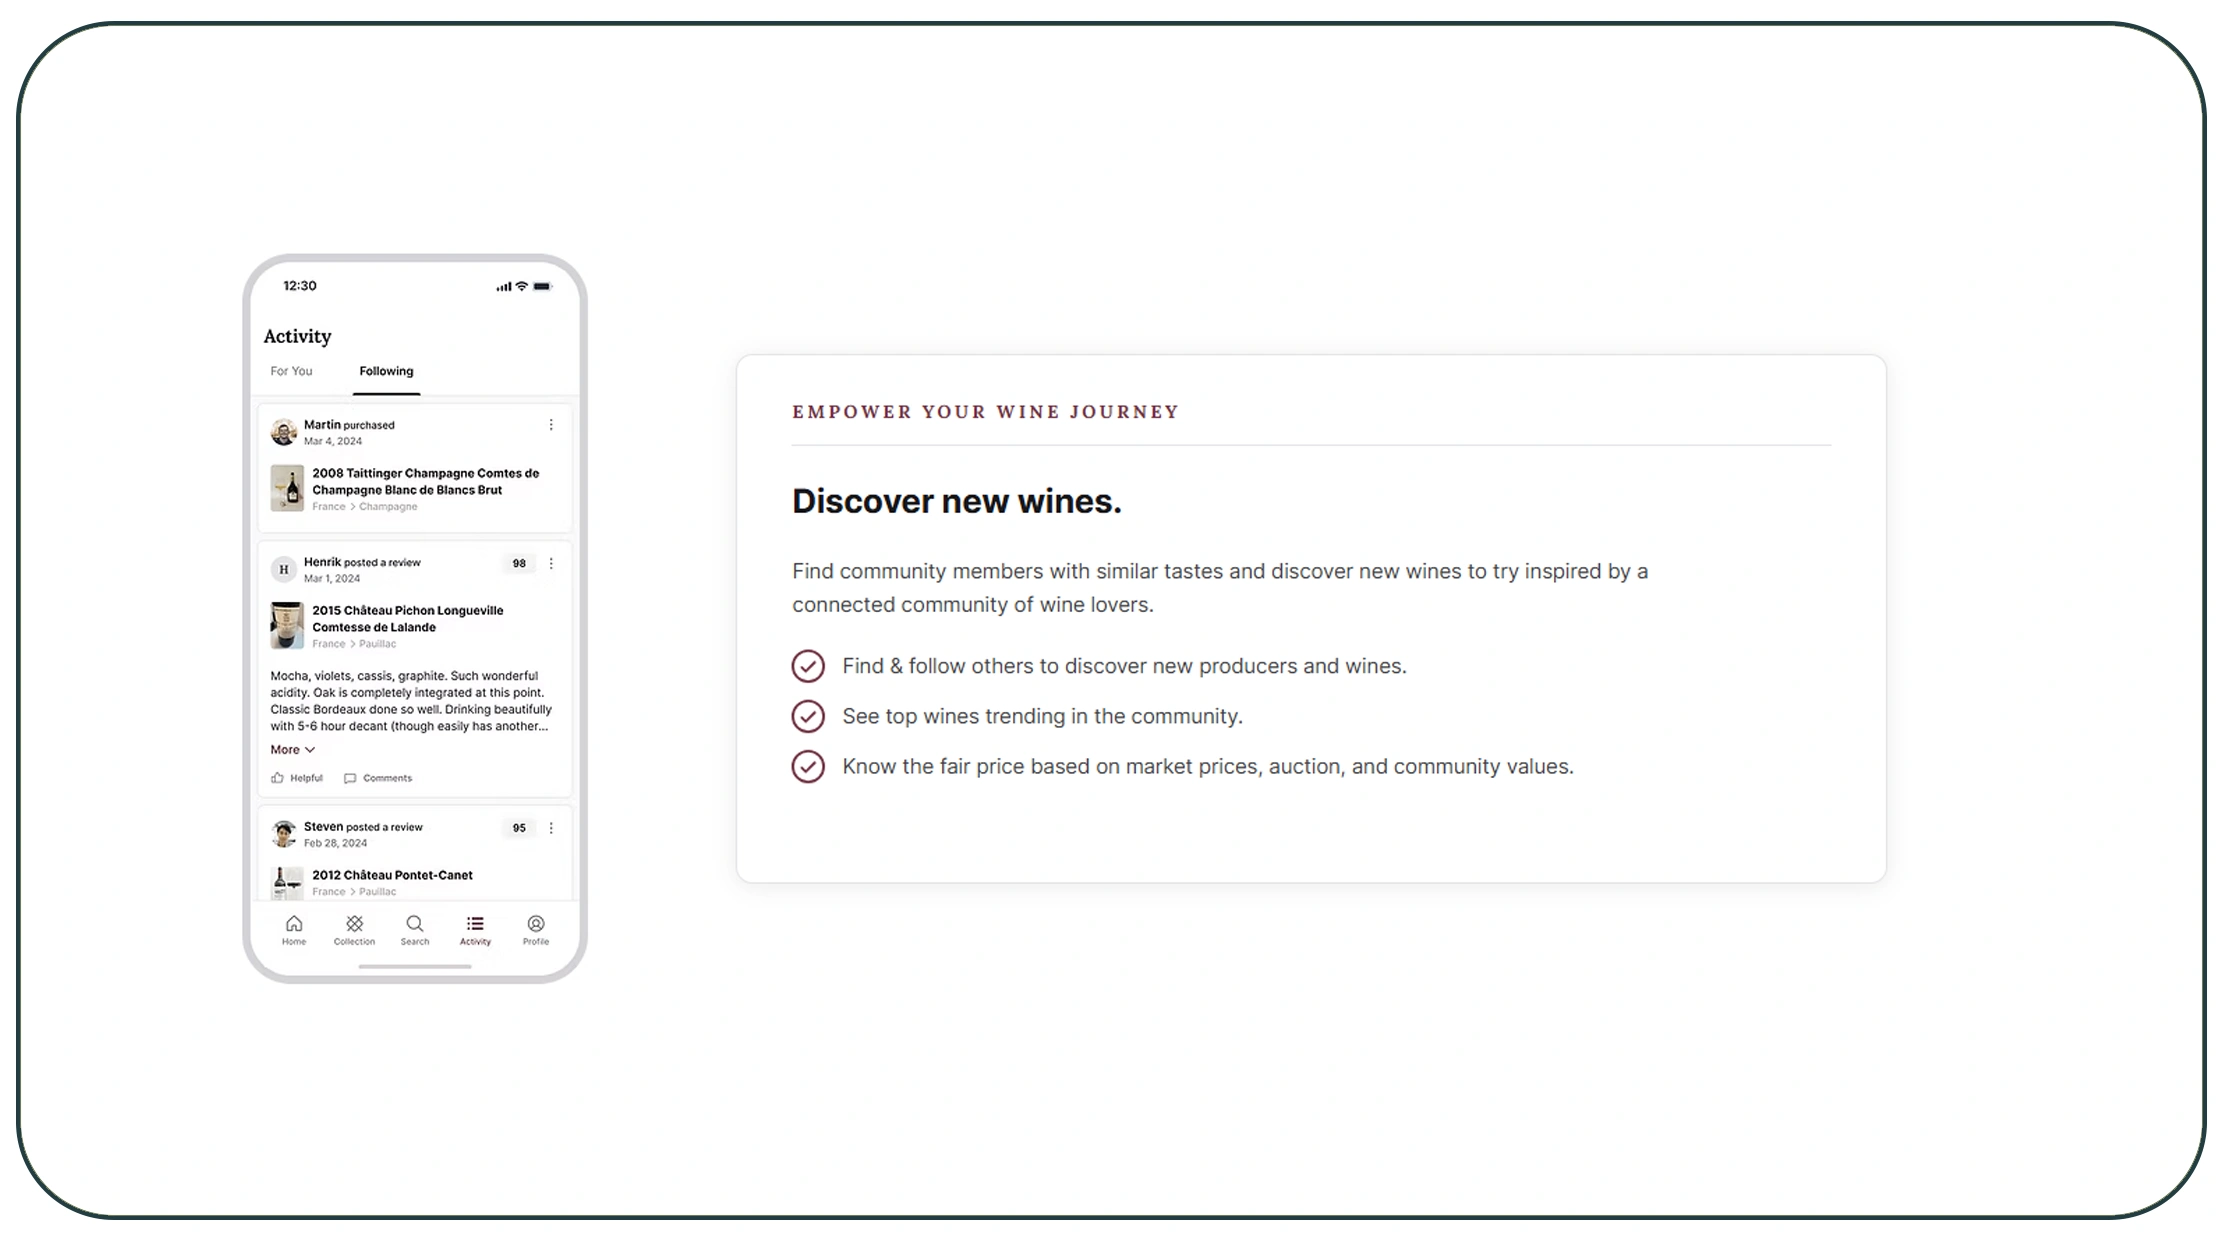
A CellarTracker Liquor Dataset can organize wine-related information into a consistent structure for research, analytics, and business intelligence. When businesses Scrape CellarTracker wine data to identify wine trends, they can build historical records instead of relying on individual observations.
A useful dataset can connect wine identity with market signals.
For example, one record might contain the producer, wine name, vintage, region, rating, review count, price, and collection date.
This makes analysis easier.
Businesses can group products by region and calculate average ratings. They can compare price ranges. They can identify producers with increasing review activity.
Historical snapshots can also reveal changes.
| Year | Illustrative Dataset Size | Main Analytical Opportunity |
|---|---|---|
| 2020 | 100K records | Product classification |
| 2021 | 180K records | Rating comparison |
| 2022 | 300K records | Price segmentation |
| 2023 | 500K records | Regional analysis |
| 2024 | 800K records | Popularity tracking |
| 2025 | 1.2M records | Trend modeling |
| 2026 | 2M+ records | Automated intelligence |
These figures are hypothetical.
A structured dataset can support dashboards and reports.
For example, a dashboard might show average price by region. Another report might rank wines by review growth. A third analysis might identify highly rated wines within specific price bands.
Data normalization also matters.
Wine names can appear in different formats. Producers may use different naming conventions. Vintages require consistent handling.
A standardized schema helps analysts compare like-for-like records.
Businesses can also store collection timestamps. This allows them to distinguish current information from historical observations.
That is especially useful when tracking price changes.
For example, an analyst can calculate:
Price Change % = ((Current Price − Previous Price) / Previous Price) × 100
This simple metric can highlight significant movements.
A historical wine dataset therefore becomes more than a list of products. It becomes a research asset.
How Can an API Make Wine Data Collection More Scalable?
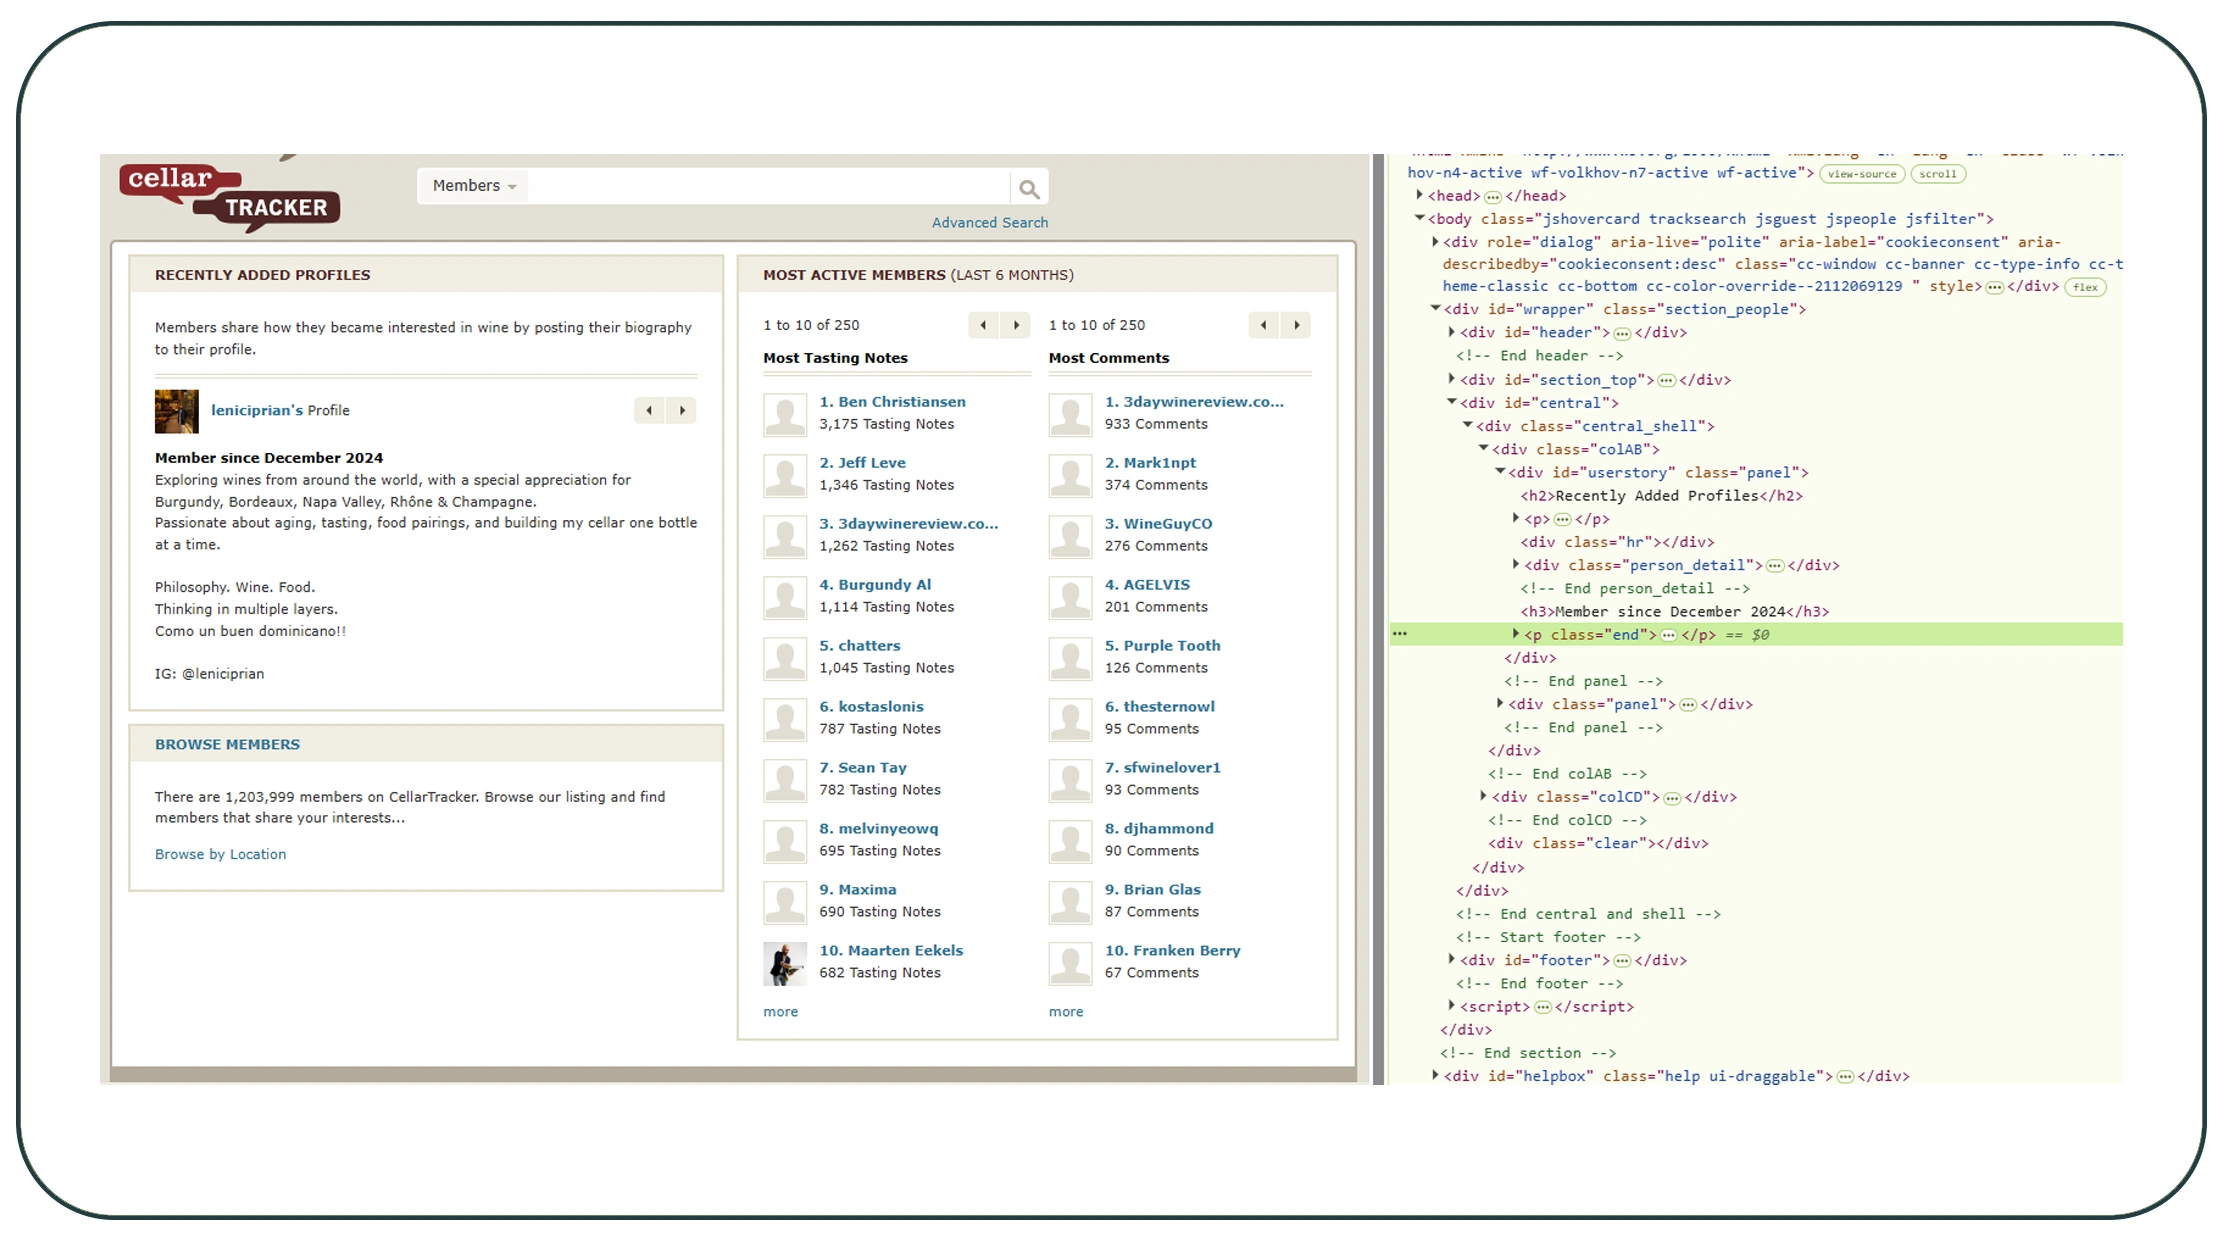
A Liquor Data Scraping API can help businesses connect wine data with their existing technology stack.
APIs are useful because applications can request structured data without manually downloading and processing individual pages.
A retailer might connect wine data to an internal analytics platform. A market research company could feed data into a reporting system. A technology company could use structured information in a consumer-facing application.
The value comes from automation.
A typical workflow can follow these steps:
- Define target wine categories.
- Identify required data fields.
- Collect and normalize records.
- Store historical observations.
- Schedule updates.
- Deliver structured results through an API or supported format.
- Analyze trends through dashboards or applications.
| Year | Illustrative API Records | Update Model |
|---|---|---|
| 2020 | 50K | Manual |
| 2021 | 100K | Scheduled |
| 2022 | 250K | Automated |
| 2023 | 500K | Daily |
| 2024 | 1M | Frequent |
| 2025 | 2M | High-volume |
| 2026 | 5M+ | Scalable automated workflows |
These figures are illustrative.
An API-based workflow can also reduce repetitive data handling.
Instead of exporting files and manually uploading them into internal systems, applications can consume structured responses based on defined requirements.
Businesses should still evaluate data quality, coverage, update frequency, reliability, and permitted usage before selecting an API-based solution.
Scalability also requires planning.
If a business tracks 1,000 wines today but expects to monitor 100,000 later, the data architecture should support that growth.
Caching can also reduce unnecessary requests. Historical data can remain stored while only new or changed information gets processed.
This can improve both efficiency and cost management.
For businesses building wine intelligence products, an API can become the connection between data collection and business applications.
How Can Historical Data Improve Wine Trend Forecasting?

A second Liquor Dataset can be especially valuable when businesses use historical records to identify patterns across regions, vintages, producers, ratings, and prices. With consistent collection, businesses can Scrape CellarTracker wine data to identify wine trends across multiple time periods rather than relying on a single snapshot.
Historical analysis supports forecasting.
It can reveal whether interest in a category is growing steadily or only experiencing a temporary spike.
For example, analysts can compare review growth over several years. They can also compare price movements with rating changes.
| Year | Illustrative Average Price Index | Review Growth Index | Trend Interpretation |
|---|---|---|---|
| 2020 | 100 | 100 | Baseline |
| 2021 | 103 | 108 | Moderate growth |
| 2022 | 107 | 118 | Rising interest |
| 2023 | 112 | 132 | Stronger demand signal |
| 2024 | 117 | 150 | High attention |
| 2025 | 121 | 172 | Rapid growth |
| 2026 | 126 | 195 | Strong trend |
The indexes above are hypothetical.
Businesses can create their own indexes based on their datasets.
For example, a popularity index might combine review count, review growth, rating, and product coverage.
Trend forecasting should not rely on one metric.
A wine with increasing reviews but declining ratings may require a different interpretation from a wine with both rising reviews and improving ratings.
Price adds another dimension.
If consumer attention increases while prices remain stable, a business may see an opportunity for assortment expansion. If attention rises alongside sharp price increases, the market may require closer monitoring.
Seasonality should also be considered.
Wine demand can change around holidays, celebrations, gifting periods, and regional events. Comparing the same months across multiple years can reveal recurring patterns.
This is why historical datasets are valuable.
They help separate short-term noise from longer-term movement.
For wine retailers and distributors, that can support better assortment planning, pricing decisions, promotional strategies, and market research.
Why Choose Real Data API?
Businesses need reliable data workflows when they want to turn online information into measurable insights. Scrape CellarTracker wine data to identify wine trends can support market research, price analysis, product discovery, and consumer preference analysis when the data is collected consistently and used appropriately.
Real Data API focuses on structured data collection for businesses that need scalable access to online information.
A strong workflow can help teams:
- Automate recurring data collection.
- Build historical datasets.
- Track product attributes.
- Analyze price changes.
- Monitor ratings and reviews.
- Support dashboards and analytics.
- Integrate data into business applications.
The goal is to reduce manual research and make data easier to use.
Businesses can then focus on interpreting trends rather than repeatedly collecting information.
Conclusion
Wine businesses need more than isolated ratings or product lists. They need historical information that connects prices, reviews, ratings, popularity, regions, producers, and vintages.
Scrape CellarTracker wine data to identify wine trends can help businesses build that broader view. A structured workflow can support market research, competitive analysis, consumer preference studies, assortment planning, and pricing intelligence.
The most effective strategy starts with a clear business question. Then define the required fields, collection frequency, historical range, and analytical goals.
Businesses should also validate data quality and follow applicable terms, permissions, and legal requirements.
Contact Real Data API today to discuss your wine data requirements and build a scalable data collection solution for smarter wine market research and trend analysis!
#CellarTracker #WineData #WineTrends #WebScraping #DataScraping #WineAnalytics #MarketResearch #WineBusiness #PriceIntelligence #DataAnalyticsLatest posts
Extract Flipkart Product Review Data For Brand Analysis - How To Track Customer Sentiment, Ratings, And Product Performance?
How To Track Prices, Products, And Consumer Demand When Scrape China's Social Commerce Market Using Pinduoduo Data?
How to Track Ratings, Prices, and Consumer Preferences When Scrape CellarTracker wine data to identify wine trends?

How to Scrape DAZN streaming data for sports viewing trends to Identify Popular Sports, Events, and Viewer Preferences?







.png)



