
Introduction
Businesses can track prices, products, promotions, sellers, and consumer demand by collecting structured marketplace data and comparing it over time. Scrape China's social commerce market using Pinduoduo data helps brands, retailers, sellers, and researchers build a clearer view of product performance and competitive activity.
China's social commerce market changes quickly. Product prices can shift because of promotions, seller competition, seasonal demand, and changing consumer preferences. Manual tracking makes it difficult to monitor thousands of products consistently.
A Pinduoduo API workflow can help businesses connect structured marketplace information with dashboards, databases, analytics platforms, and internal applications, subject to available access methods and applicable platform terms.
What does the data show?
The table below provides an illustrative planning scenario showing how a growing product-monitoring program could expand from 2020 to 2026.
| Year | Illustrative Products Tracked | Monthly Price Records | Primary Business Goal |
|---|---|---|---|
| 2020 | 1,000 | 5,000 | Basic product research |
| 2021 | 2,000 | 12,000 | Price comparison |
| 2022 | 4,000 | 25,000 | Competitor monitoring |
| 2023 | 7,500 | 50,000 | Promotion analysis |
| 2024 | 12,000 | 90,000 | Demand analysis |
| 2025 | 20,000 | 160,000 | Market intelligence |
| 2026 | 35,000 | 300,000+ | Automated commerce intelligence |
These figures are hypothetical examples for illustrating data-monitoring growth. Actual volumes depend on product coverage, collection frequency, attributes, and business requirements.
The target audience includes e-commerce brands, retailers, distributors, marketplace sellers, pricing teams, market researchers, and technology companies.
The main problem is simple: How can businesses turn constantly changing marketplace information into reliable insights without relying on manual tracking?
The answer is structured, historical, and automated data collection.
How Can Businesses Track Pinduoduo Prices More Effectively?
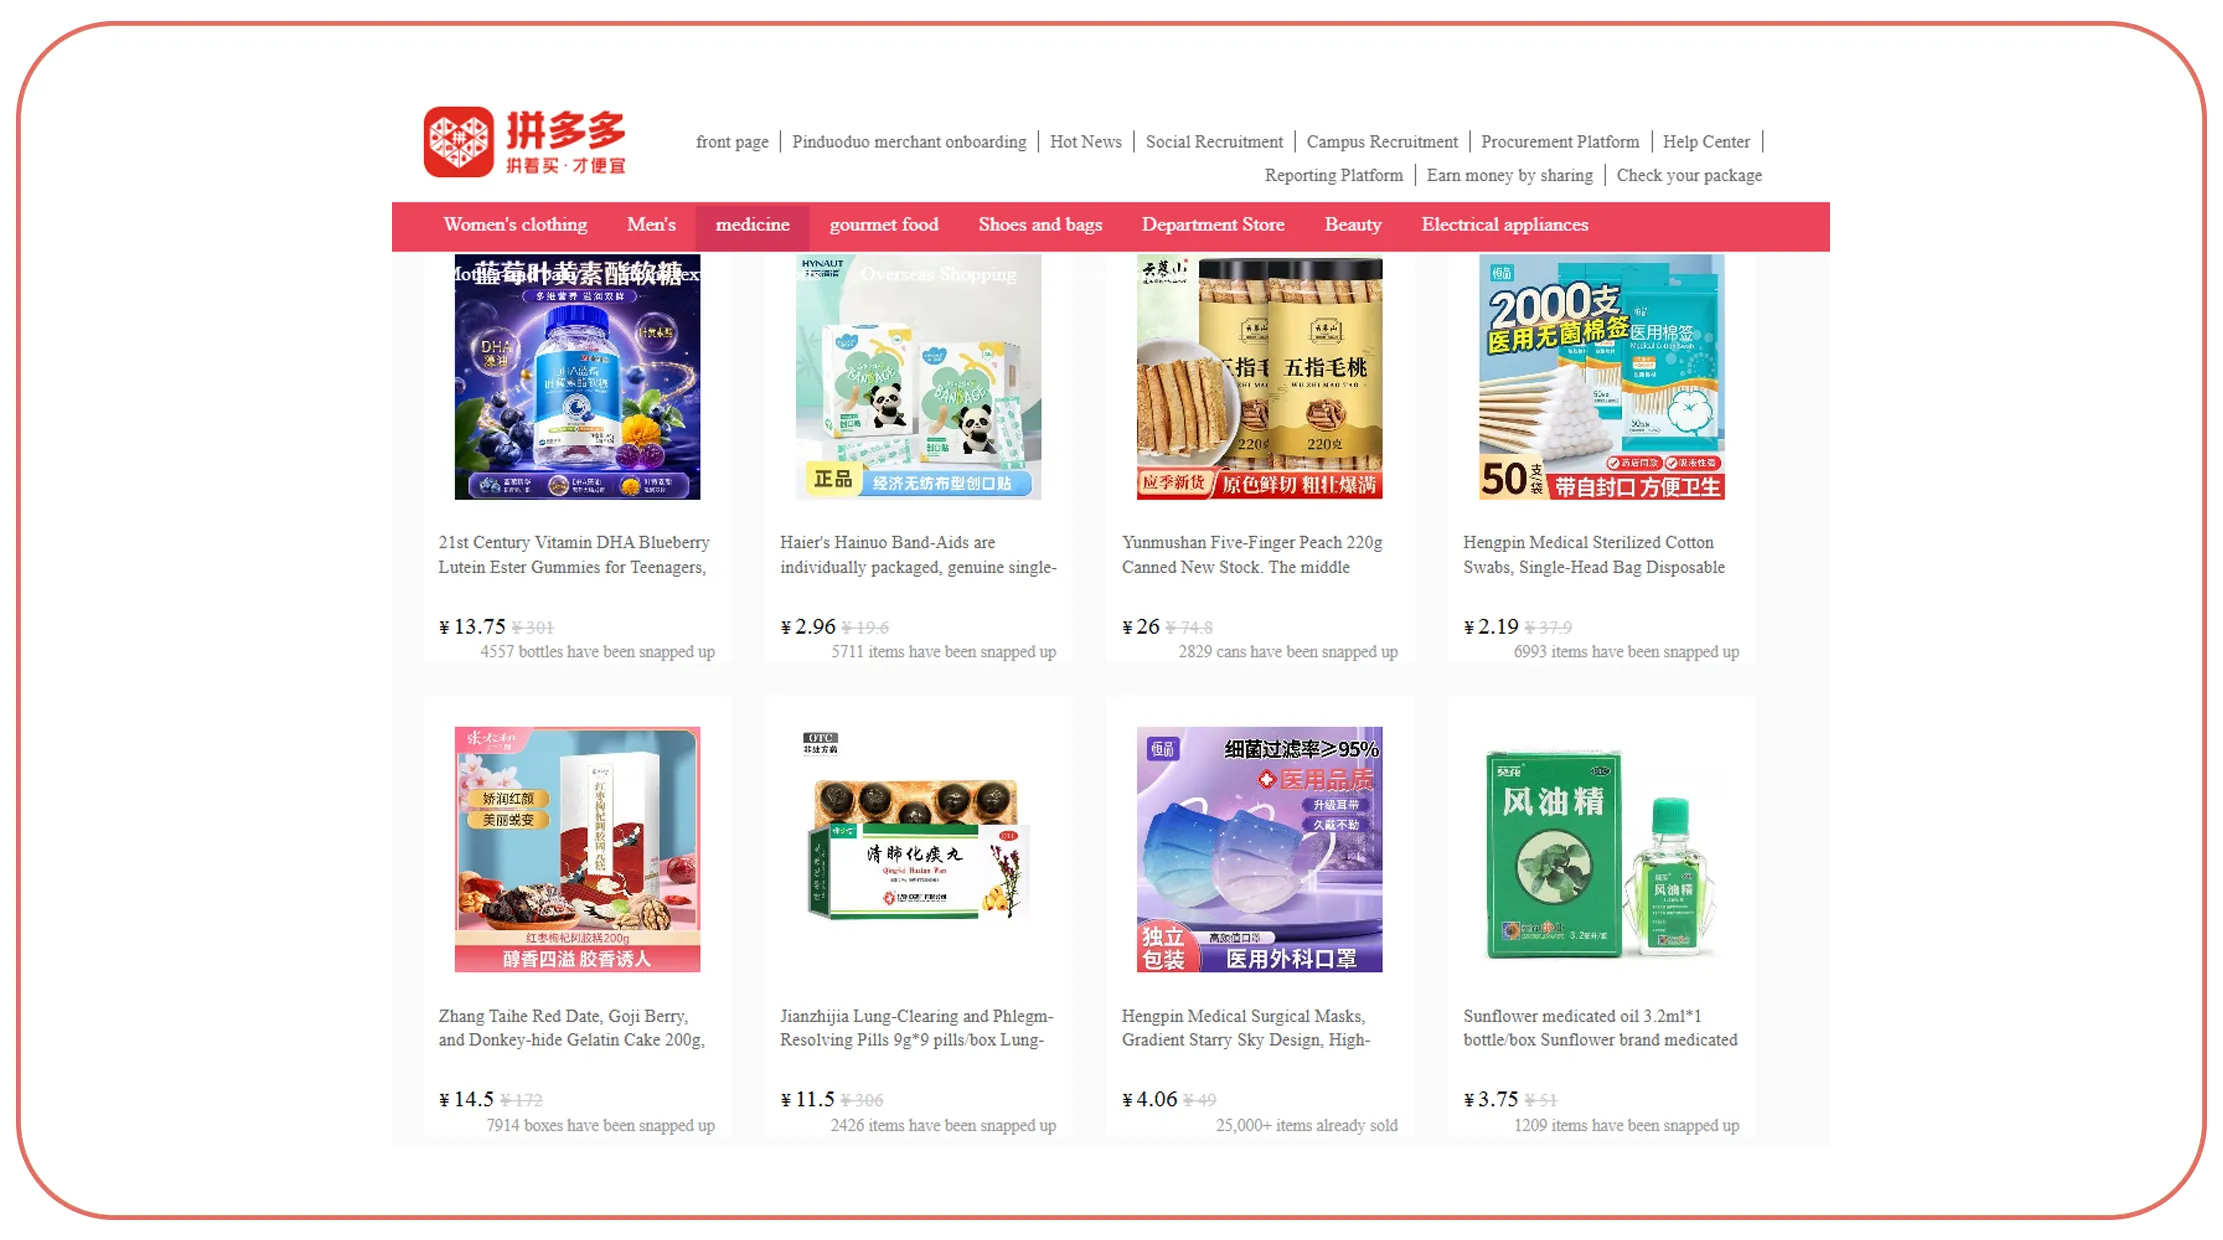
Monitor Pinduoduo product prices in real time workflows can help businesses identify price changes faster and understand competitive movements.
Price monitoring does not only mean recording the current selling price. A useful dataset can capture the original price, current price, discount, seller, product title, availability, timestamp, and other relevant attributes.
This creates a historical record.
For example, a retailer can compare today's product price with the price recorded seven days ago. A pricing analyst can identify products with frequent changes. A brand can monitor competitors across a selected product category.
The process can follow four basic steps:
- Select products and categories.
- Collect product and pricing information.
- Store timestamped observations.
- Compare current and historical records.
Historical tracking is important because one price snapshot cannot show a trend.
| Year | Illustrative Price Observations | Monitoring Focus |
|---|---|---|
| 2020 | 60K | Basic price tracking |
| 2021 | 120K | Competitor comparison |
| 2022 | 250K | Discount monitoring |
| 2023 | 500K | Price movement |
| 2024 | 900K | Category analysis |
| 2025 | 1.6M | Frequent monitoring |
| 2026 | 3M+ | Automated price intelligence |
These figures are illustrative.
Businesses can also create price-change alerts.
For example, a system could flag products when prices change by more than 10%. Another rule could identify products that receive repeated discounts.
This helps pricing teams focus on meaningful changes rather than reviewing every product manually.
Real-time or high-frequency monitoring should be reserved for use cases that need fresh data. Not every product requires continuous updates.
A practical strategy is to use different frequencies:
- High-priority products: frequent monitoring.
- Standard products: daily monitoring.
- Low-priority products: weekly monitoring.
This approach can control infrastructure requirements while keeping important pricing information fresh.
How Can Seller and Product Data Reveal Competitive Opportunities?
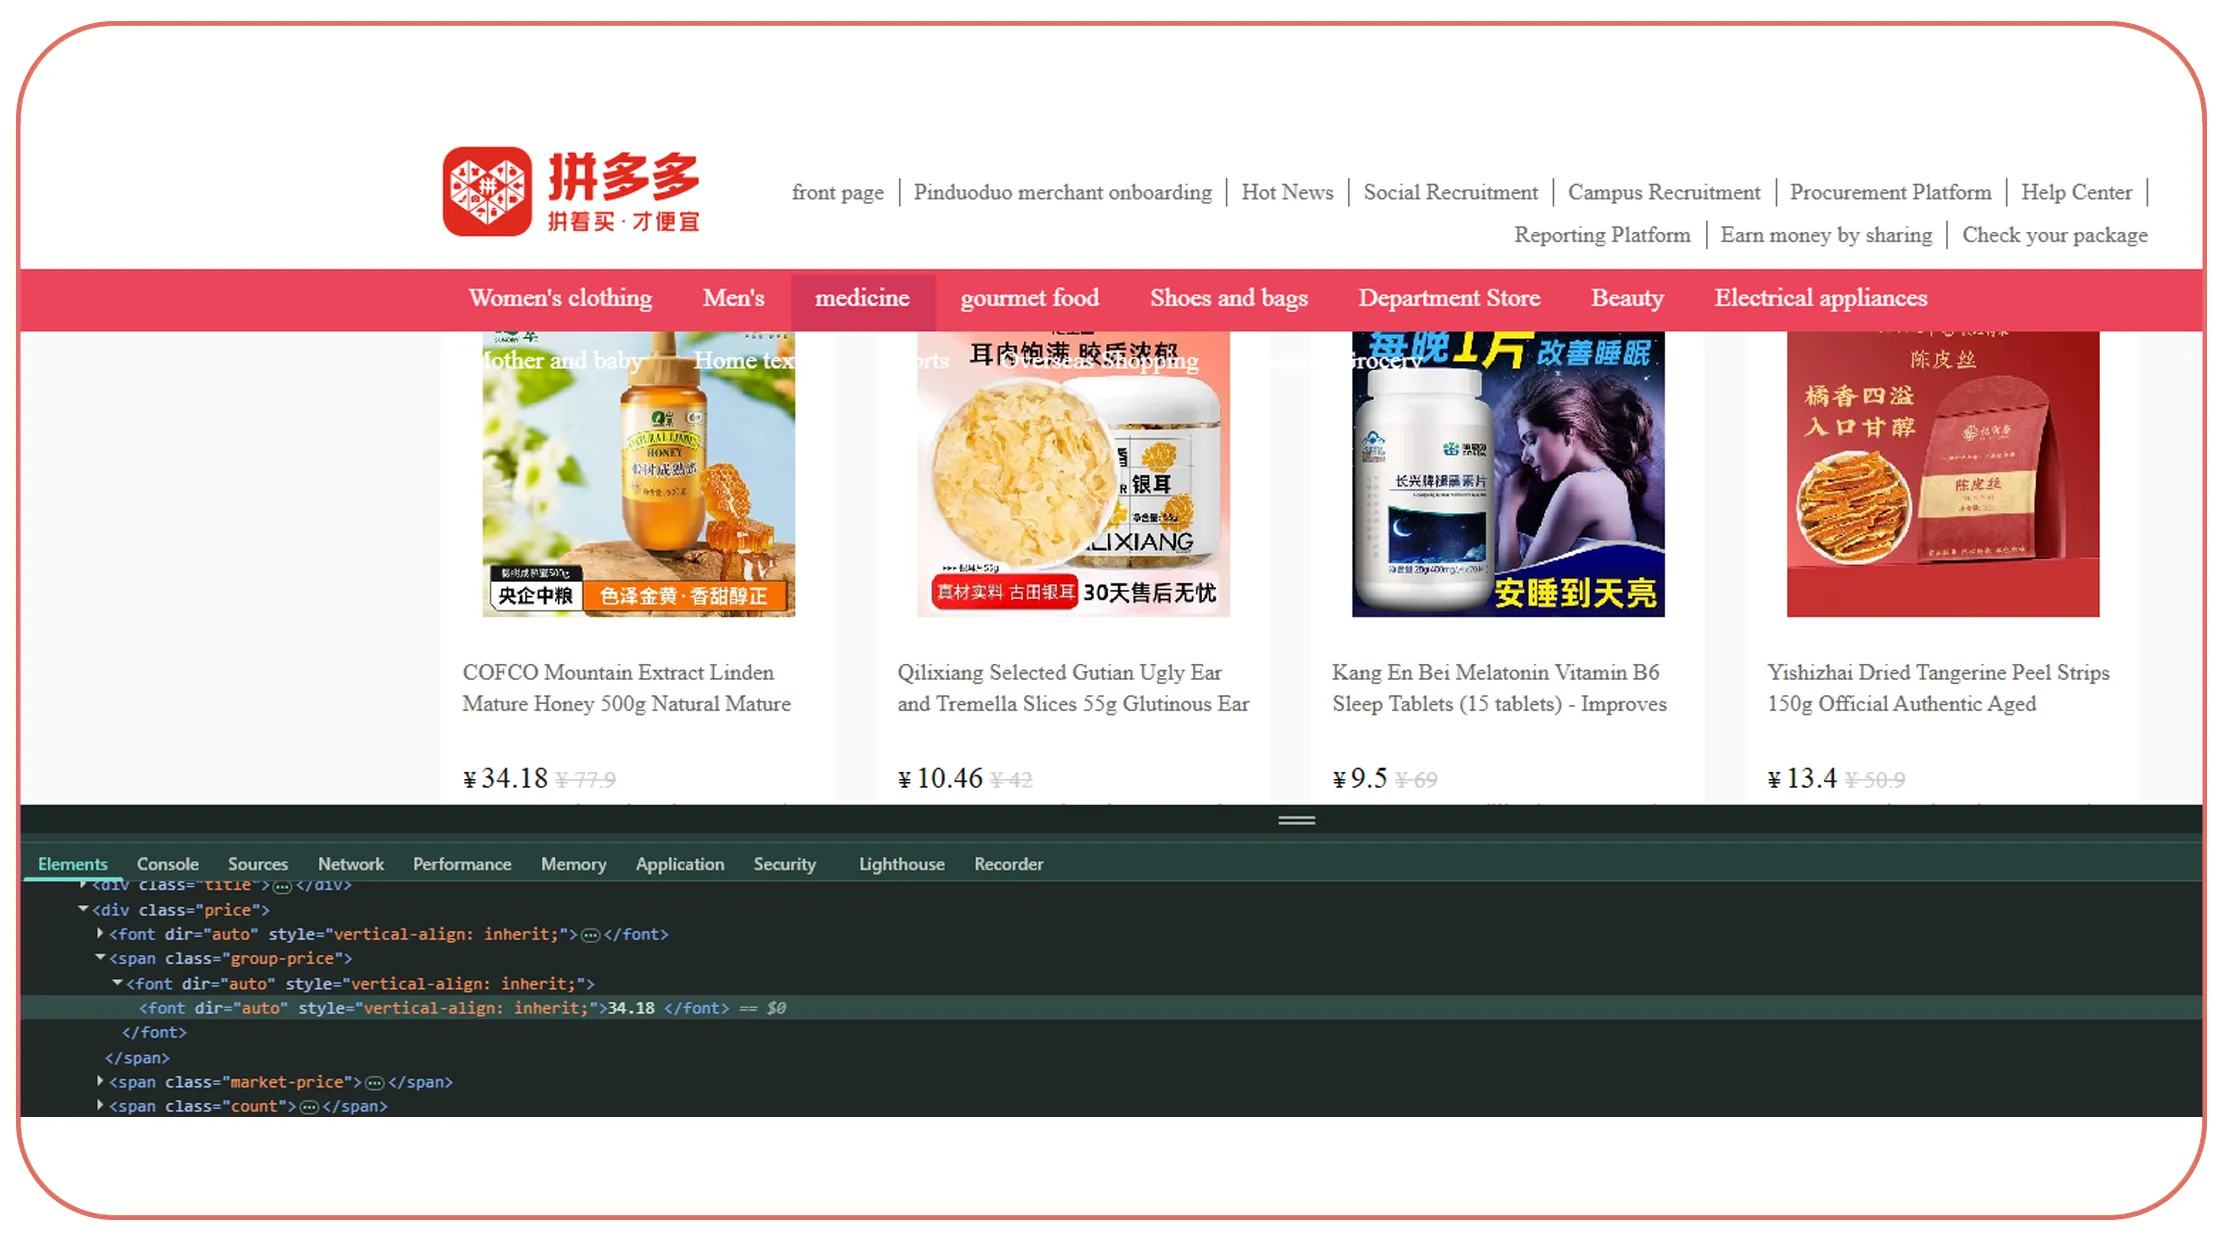
A Pinduoduo seller and product data scraper can help businesses understand more than price differences.
Seller information can reveal the competitive structure of a product category. Product information can show assortment breadth. Combined data can help businesses understand how sellers position similar products.
Useful fields may include:
- Product name.
- Product category.
- Seller name.
- Product price.
- Discount.
- Rating.
- Review count.
- Product URL.
- Availability.
- Product specifications.
- Promotional information.
- Collection timestamp.
Businesses can then compare sellers across categories.
For example, analysts can identify sellers with large product assortments. They can compare average prices across sellers. They can also examine which products receive higher customer engagement.
| Year | Illustrative Sellers Tracked | Product Records | Main Analysis |
|---|---|---|---|
| 2020 | 500 | 10K | Seller discovery |
| 2021 | 900 | 20K | Product comparison |
| 2022 | 1,500 | 40K | Assortment analysis |
| 2023 | 2,500 | 70K | Competitive tracking |
| 2024 | 4,000 | 120K | Seller benchmarking |
| 2025 | 6,000 | 200K | Market intelligence |
| 2026 | 10,000+ | 350K+ | Automated analysis |
These are hypothetical planning values.
Product-level data can also help identify assortment gaps.
Suppose a brand monitors a category and finds that several competitors offer products within a price range that the brand does not cover. That information may support product development or assortment decisions.
Seller data can also help identify changes in competition.
A new seller entering a category may introduce lower prices or additional product variations. A previously active seller may reduce its assortment.
These changes become easier to detect when data is collected regularly.
Businesses should focus on the attributes that support their specific business question. Collecting unnecessary fields can increase processing and storage requirements.
A focused dataset is often more useful than a large but unstructured one.
How Can Promotion Data Help Explain Sudden Price Changes?
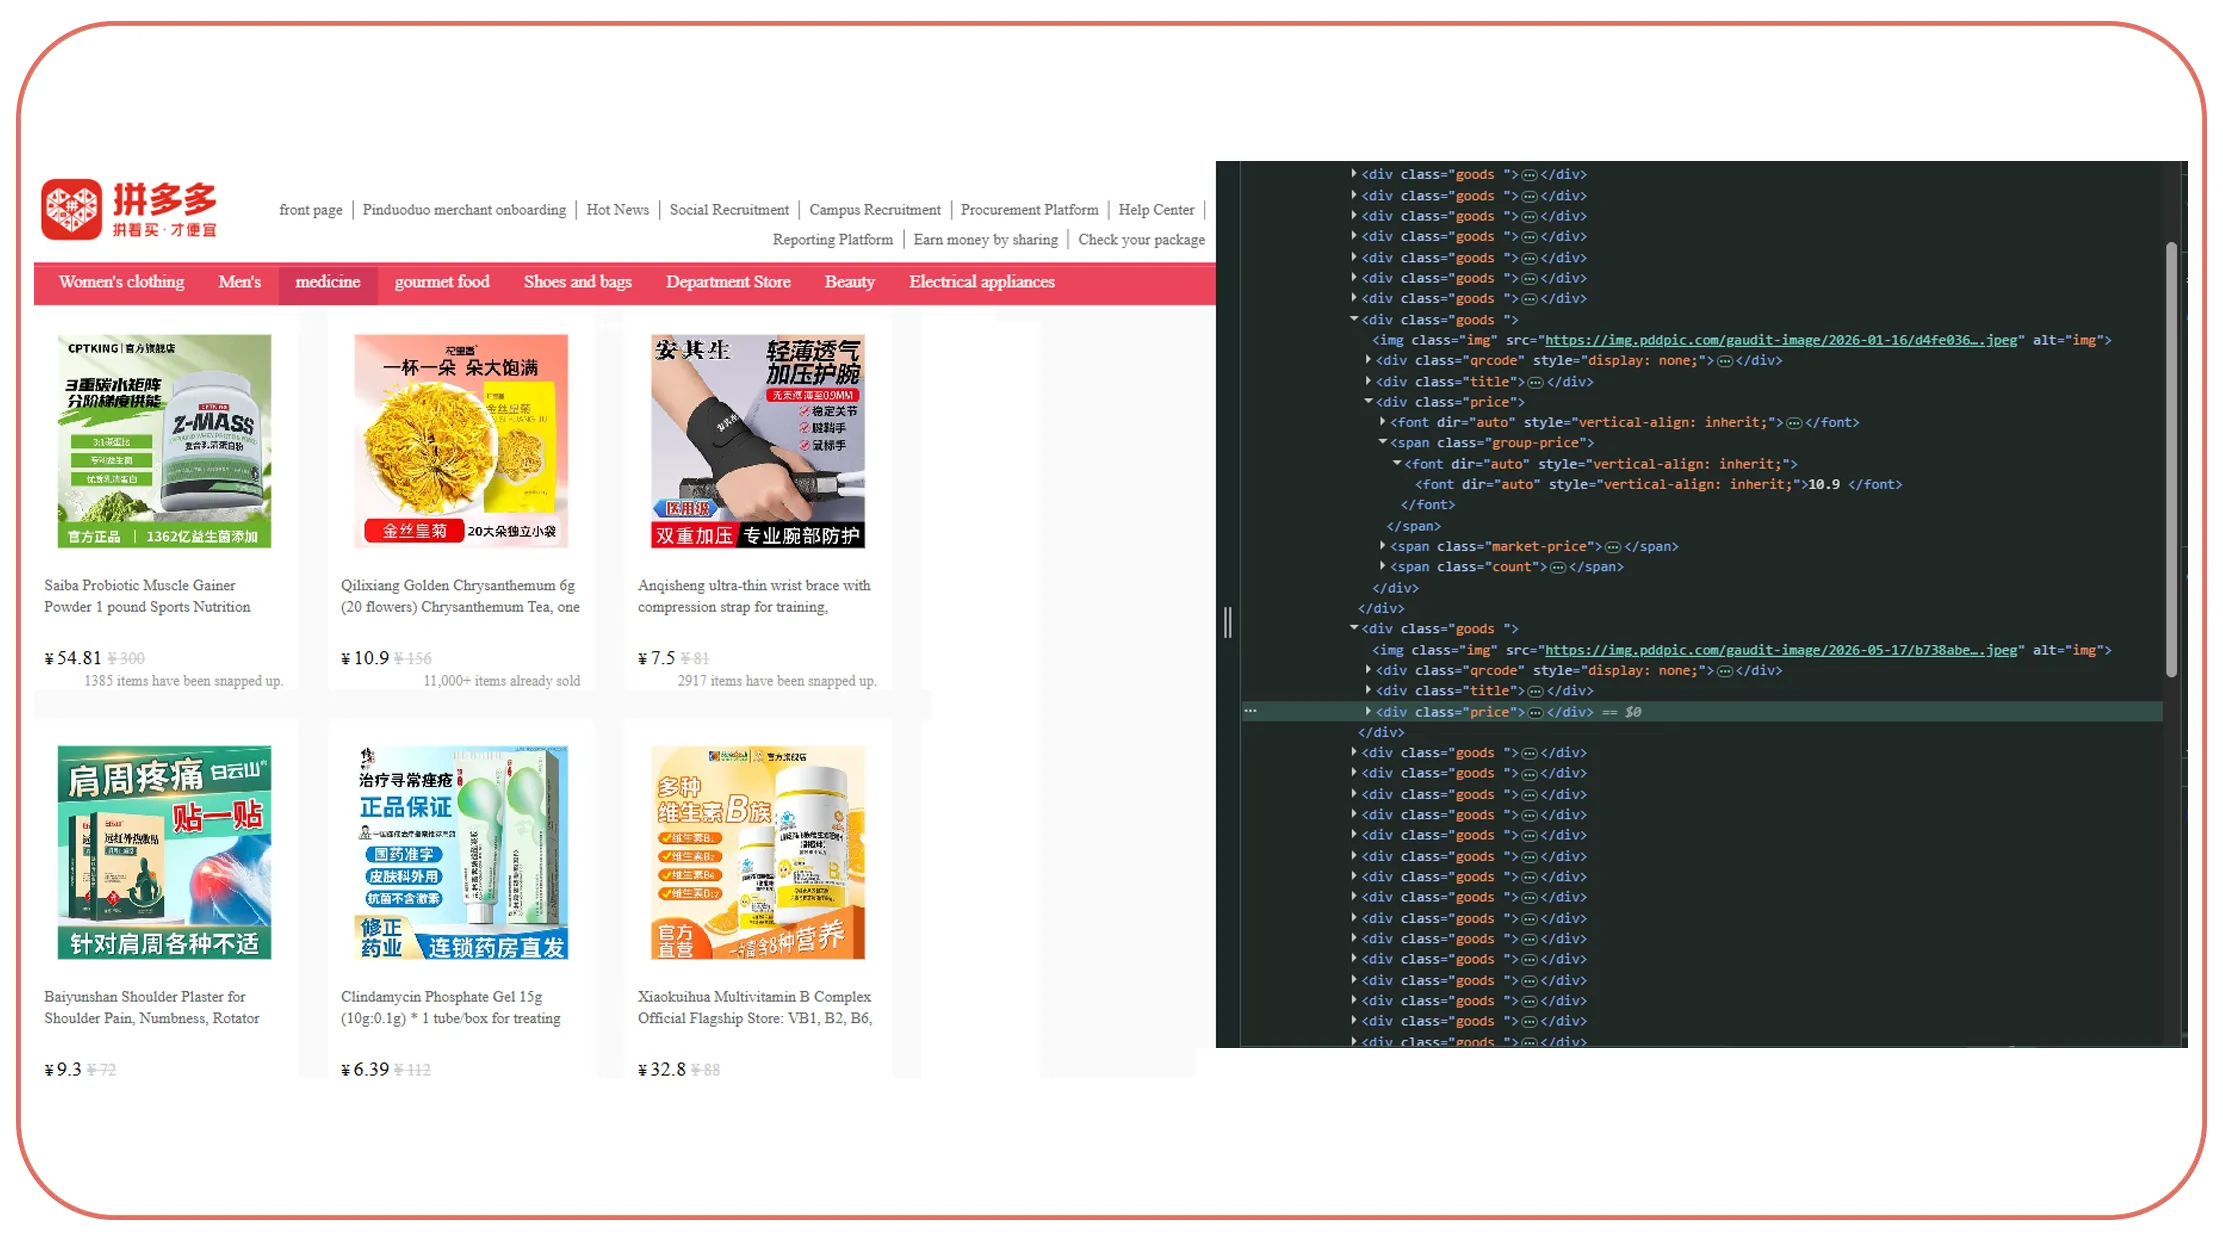
Pinduoduo promotions and discounts data scraping can help businesses understand why prices move.
A price decrease does not always mean a permanent change in pricing strategy. It may result from a limited-time promotion, coupon, seasonal event, bundle offer, or seller campaign.
This distinction matters.
If a competitor reduces its price for one day, a retailer may not need to change its own pricing strategy. If the competitor maintains a lower price for several weeks, the situation may require deeper analysis.
Promotion data can include:
- Original price.
- Discounted price.
- Discount percentage.
- Coupon information.
- Promotion period.
- Bundle information.
- Seller.
- Product.
- Timestamp.
A historical dataset allows businesses to compare promotional activity over time.
| Year | Illustrative Promotion Records | Main Use |
|---|---|---|
| 2020 | 20K | Discount tracking |
| 2021 | 40K | Campaign comparison |
| 2022 | 80K | Seasonal analysis |
| 2023 | 150K | Competitor promotions |
| 2024 | 300K | Discount intensity |
| 2025 | 550K | Promotion forecasting |
| 2026 | 1M+ | Automated campaign intelligence |
These figures are illustrative.
Businesses can calculate discount rates using a simple formula:
Discount % = ((Original Price − Sale Price) / Original Price) × 100
Analysts can then group promotions by product category, seller, date, or price segment.
This can reveal recurring promotional patterns.
For example, a category may show heavy discount activity during specific periods each year. Businesses can use historical patterns to prepare inventory and pricing strategies.
Promotion monitoring can also support competitive intelligence.
If several sellers begin offering discounts at the same time, the business may investigate whether a major shopping event or market shift is driving the change.
The key is to analyze promotion data alongside price and product data.
A discount by itself tells only part of the story.
How Can an API Make E-Commerce Data Collection Easier?
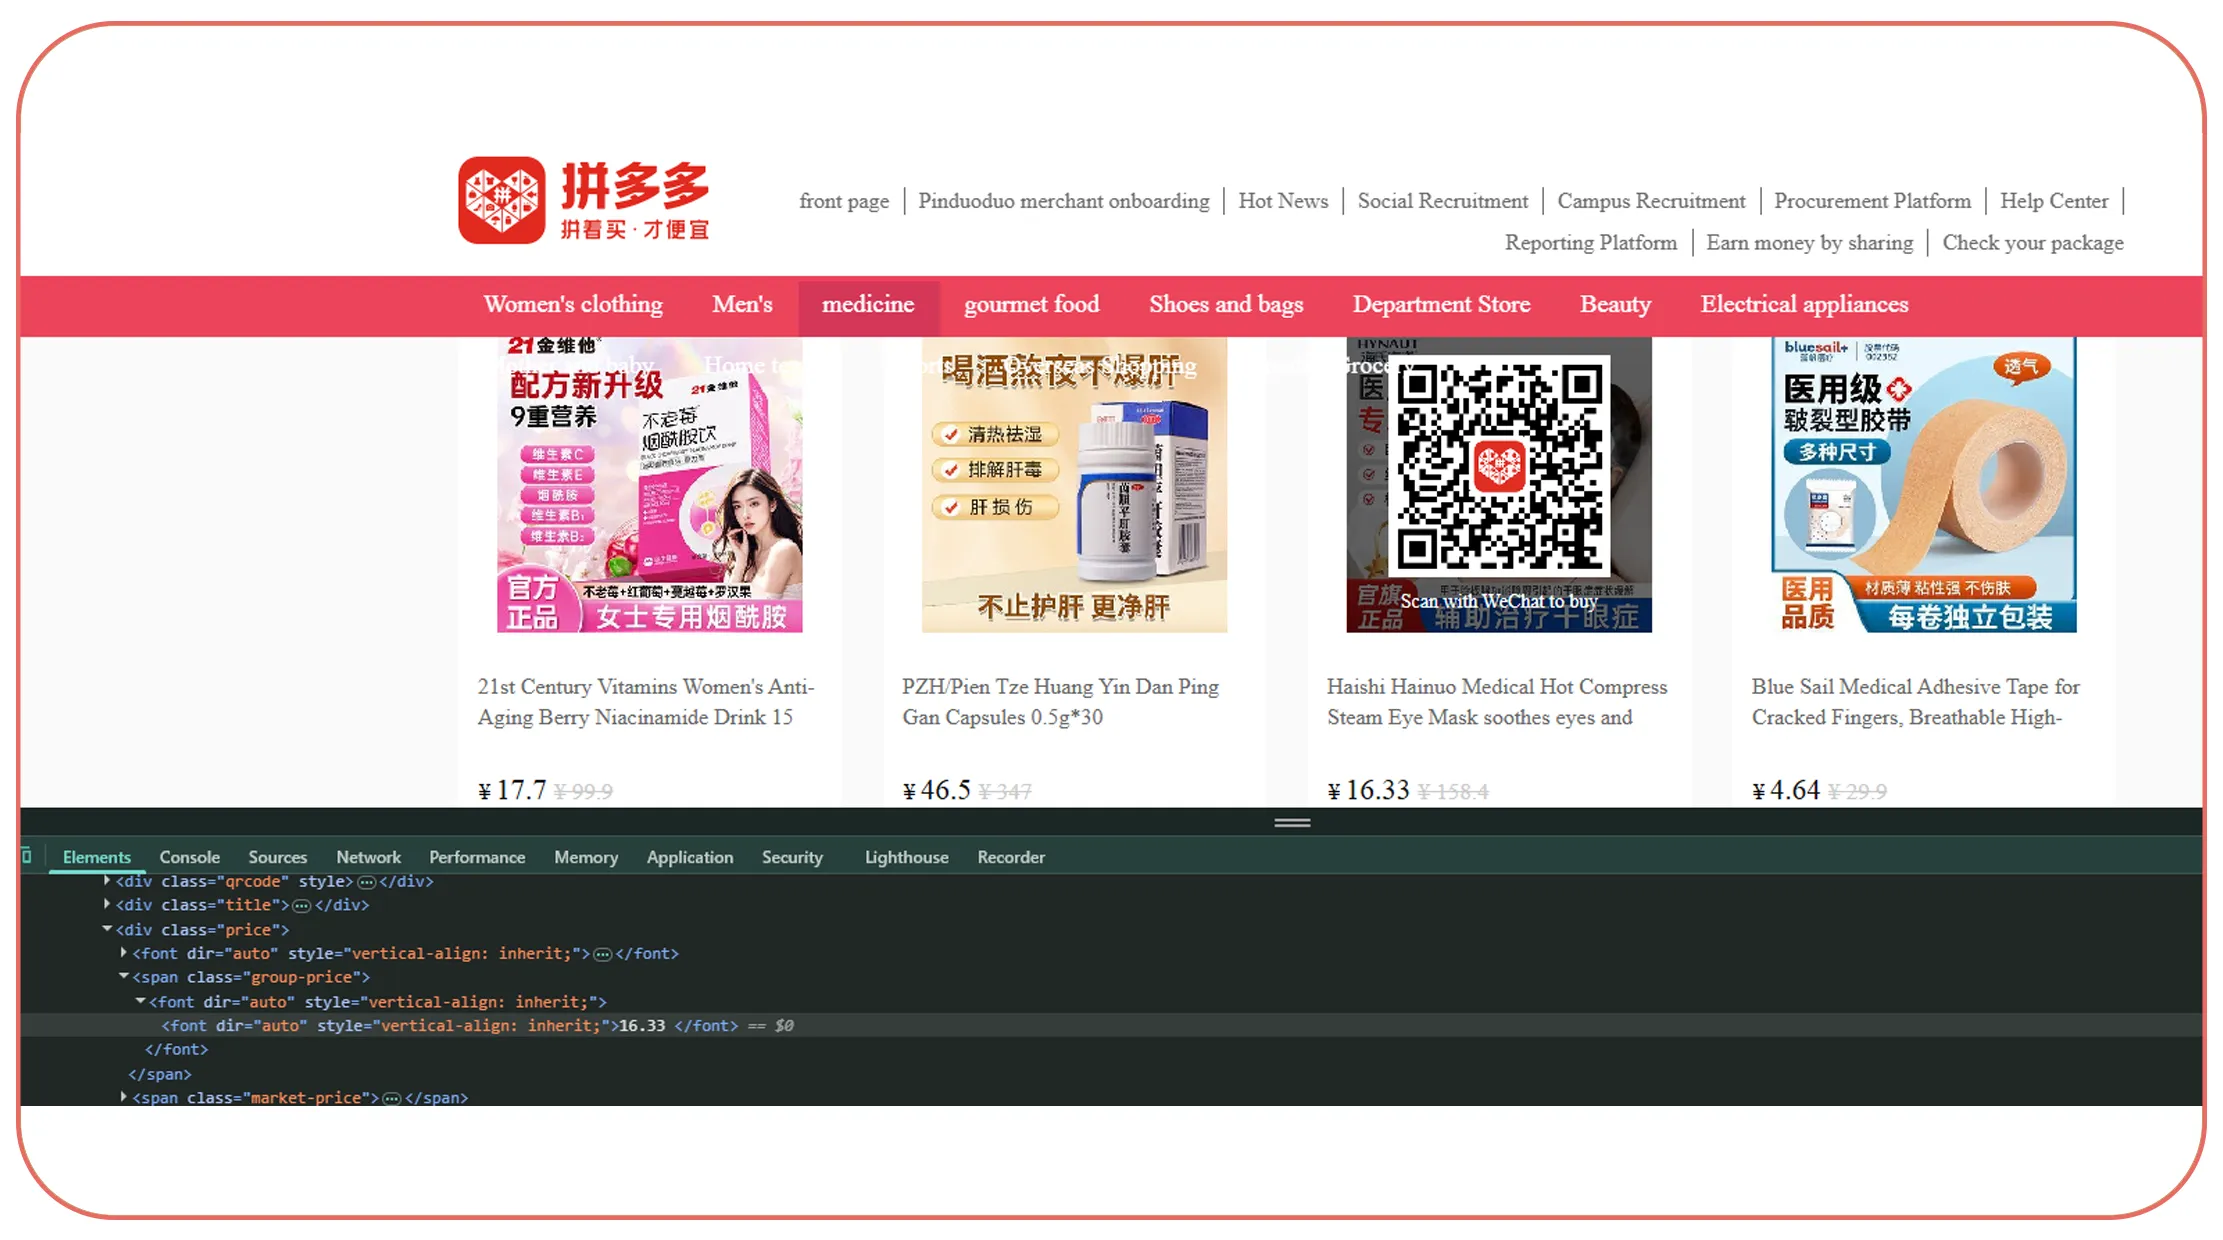
An E-Commerce Data Scraping API can connect marketplace data with business systems.
APIs are useful when companies want applications to consume structured data without repeatedly handling manual files.
A retailer could connect data to an internal dashboard. A market research company could feed records into an analytics platform. A pricing application could use structured product information for competitive analysis.
The workflow can be simple:
- Define the target products.
- Select required data fields.
- Schedule collection.
- Validate the results.
- Store historical records.
- Deliver structured data.
- Analyze changes.
| Year | Illustrative Data Volume | Delivery Requirement |
|---|---|---|
| 2020 | 50K records | CSV |
| 2021 | 100K records | Scheduled files |
| 2022 | 250K records | Database |
| 2023 | 500K records | API |
| 2024 | 1M records | Automated API |
| 2025 | 2M records | Scalable integration |
| 2026 | 5M+ records | High-volume data pipeline |
These figures are hypothetical.
An API-based workflow can reduce repetitive tasks. It can also support integration with business intelligence tools and internal applications.
However, businesses should evaluate data quality, coverage, update frequency, reliability, and permitted usage before selecting an API.
Scalability is also important.
A system that handles 10,000 records today may need to handle millions later.
Businesses should therefore plan for:
- Increased product coverage.
- Higher monitoring frequency.
- Historical storage.
- Data validation.
- Failure detection.
- Flexible delivery.
The best architecture supports growth without requiring a complete redesign.
How Can a Historical Dataset Reveal Consumer Demand?
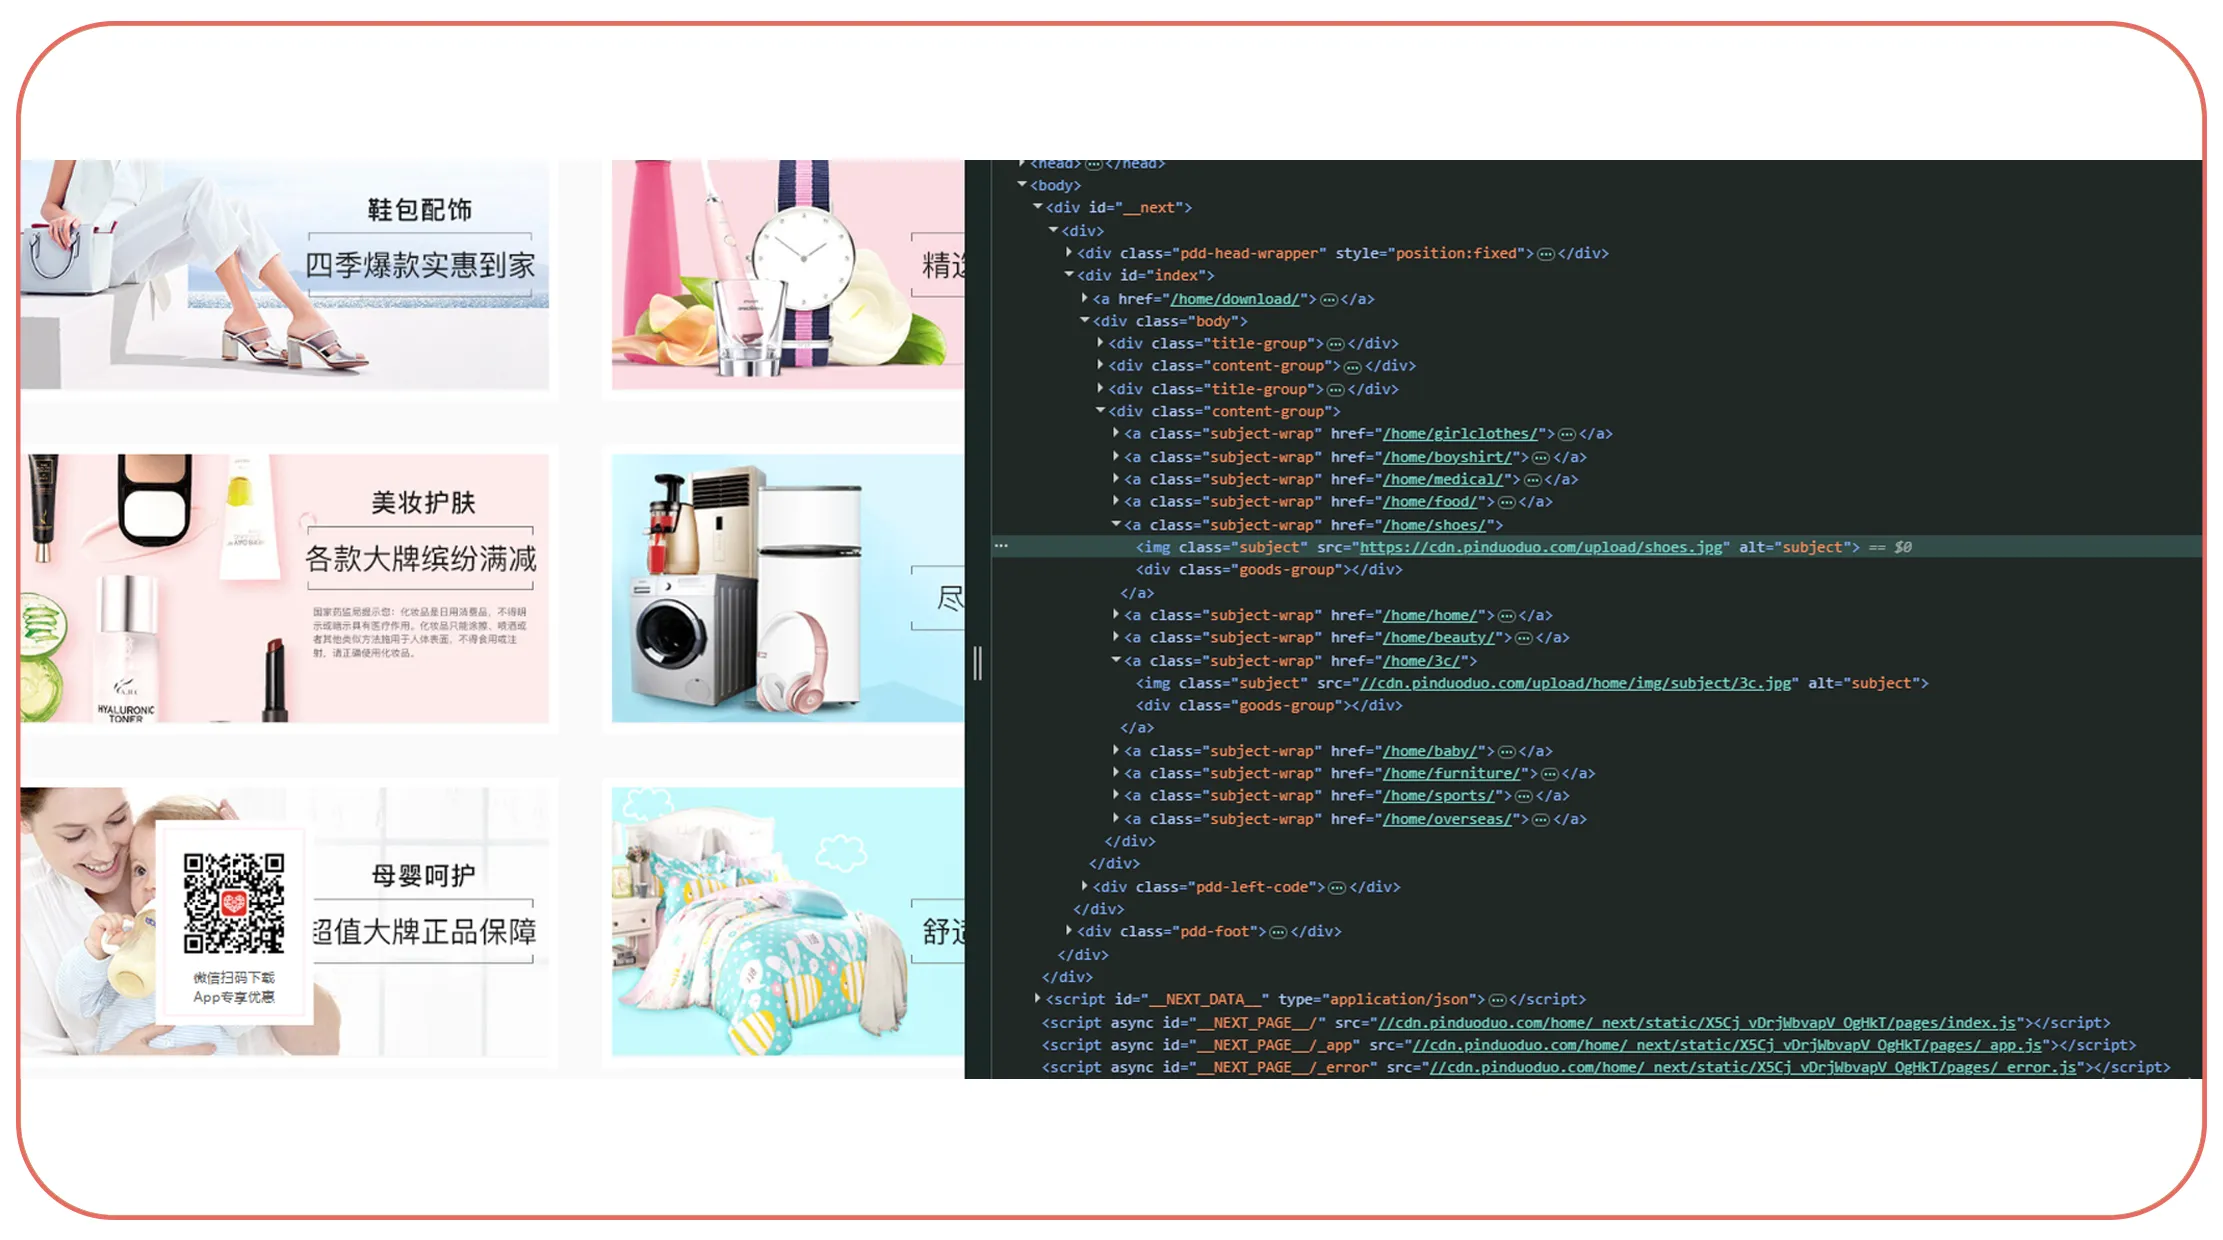
An E-Commerce Dataset can help businesses analyze changes in products, prices, sellers, promotions, and consumer signals over time. When businesses Scrape China's social commerce market using Pinduoduo data, they can turn individual product observations into a historical market dataset.
Historical data supports trend analysis.
A business can compare product activity across months or years. It can identify categories with growing product coverage. It can compare price changes with ratings, reviews, or other available demand signals.
Consider an illustrative demand index:
| Year | Illustrative Demand Index | Product Activity | Business Interpretation |
|---|---|---|---|
| 2020 | 100 | Baseline | Starting point |
| 2021 | 112 | Growing | Moderate interest |
| 2022 | 128 | Growing | Stronger activity |
| 2023 | 145 | High | Expanding demand |
| 2024 | 165 | High | Strong market activity |
| 2025 | 190 | Very High | Rapid growth |
| 2026 | 220 | Very High | Broad market opportunity |
These index values are hypothetical.
Businesses can build their own demand indicators using available signals.
For example, a demand model could combine product popularity, review activity, seller growth, price movement, and availability.
The model should be transparent.
A business should know which signals influence its score.
Historical data can also help identify seasonal behavior.
If product activity rises every year during a specific period, businesses can prepare inventory and promotional strategies in advance.
Category-level analysis can reveal another opportunity.
A business may find that one product category is growing faster than the overall marketplace. This could signal a potential expansion opportunity.
The dataset can also support competitor benchmarking.
Businesses can compare product coverage, pricing, promotions, and seller activity across selected categories.
The important point is that raw data becomes more useful when it is organized historically.
A single product record is information.
Thousands of timestamped records can become market intelligence.
What Are the Main Business Uses of E-Commerce Scraping?
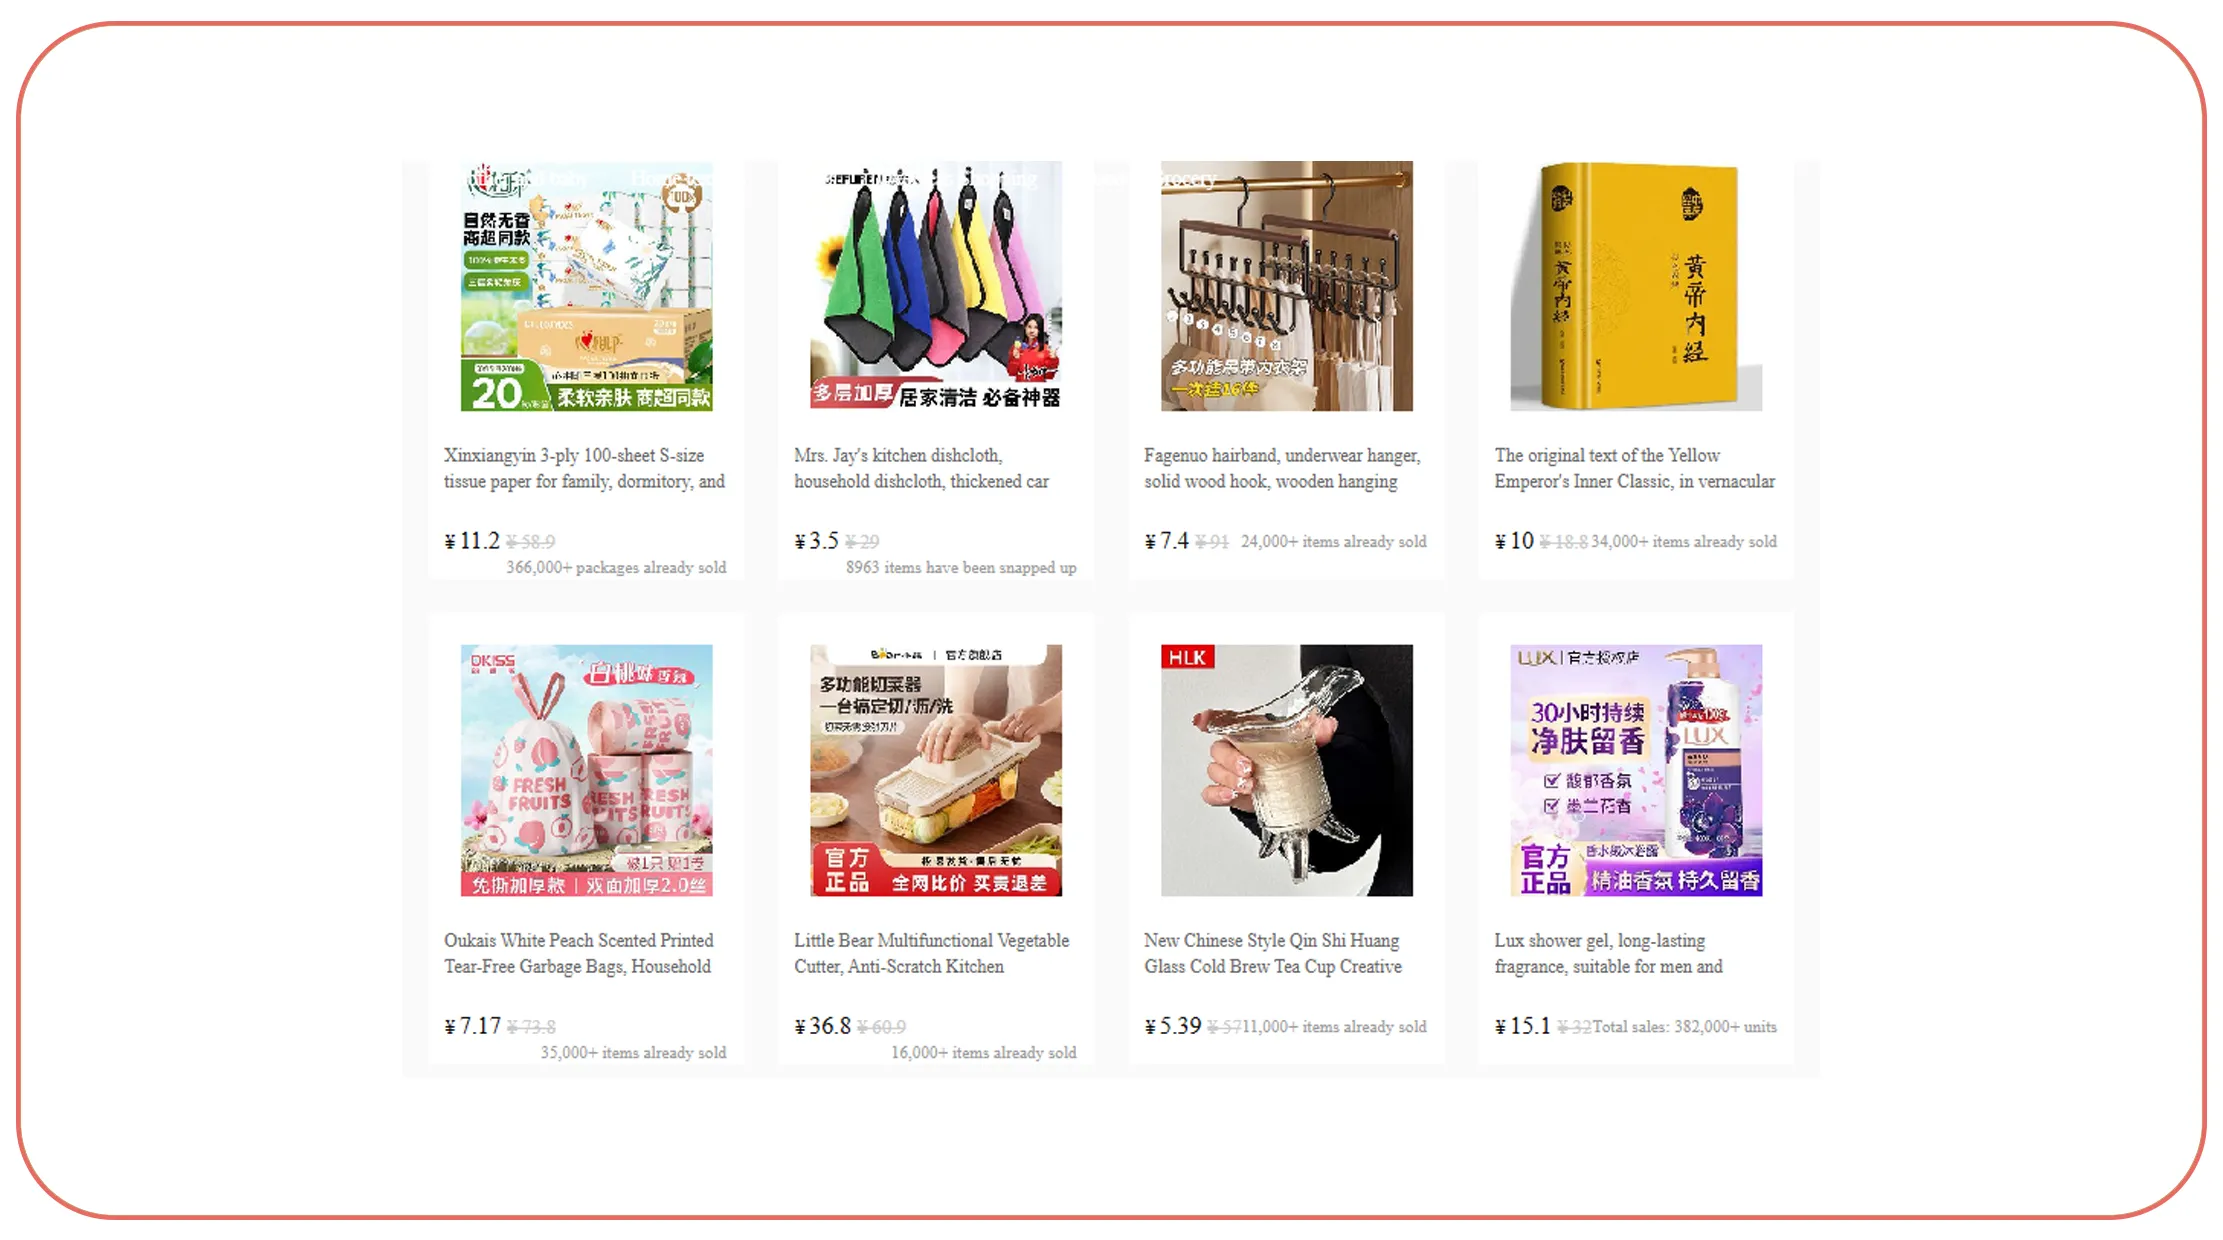
Ecommerce Scraping API Use Cases extend beyond basic price tracking.
Retailers can use marketplace data for competitive pricing. Brands can monitor product assortment. Sellers can research competitors. Market researchers can analyze categories. Distributors can study product availability.
Common use cases include:
Competitive Price Monitoring
Businesses can compare product prices across sellers and identify meaningful price movements.
Product Discovery
Teams can identify popular products, new product variations, and expanding categories.
Promotion Intelligence
Businesses can track discounts, campaigns, and promotional activity.
Assortment Analysis
Retailers can compare their product selection with competitors.
Seller Research
Companies can identify active sellers and analyze their product portfolios.
Market Trend Analysis
Historical datasets can reveal changes in category activity and consumer interest.
| Use Case | Data Needed | Business Benefit |
|---|---|---|
| Price monitoring | Prices, timestamps | Pricing decisions |
| Product research | Product attributes | Product discovery |
| Promotion analysis | Discounts, campaigns | Promotion planning |
| Seller analysis | Seller and product data | Competitor benchmarking |
| Demand analysis | Product activity | Market forecasting |
| Assortment analysis | Categories and products | Range optimization |
These are general use-case examples.
The value increases when businesses connect multiple data points.
For example, price data alone shows that a product became cheaper. Promotion data may explain why. Seller data may show which competitor changed its price. Historical data can reveal whether the event is temporary or recurring.
That combination creates stronger insight.
Businesses should also define clear objectives before collecting data.
Ask:
- What decision will the data support?
- Which products matter?
- How frequently should they be monitored?
- Which fields are required?
- How long should historical data be retained?
- How will the results be delivered?
A focused strategy can reduce unnecessary data volume and make analysis easier.
Why Choose Real Data API?
Real Data API helps businesses turn online marketplace information into structured datasets for analytics and decision-making. Scrape China's social commerce market using Pinduoduo data can support competitive research, product monitoring, price analysis, promotion tracking, and market trend analysis.
A strong data workflow should be scalable and easy to integrate.
Real Data API can help businesses build workflows around their specific requirements. These may include product data, pricing information, seller details, promotional signals, and historical records.
Key benefits include:
- Automated data collection.
- Structured outputs.
- Scalable workflows.
- Historical data support.
- Flexible integration.
- Competitive intelligence.
- Product and pricing analysis.
The goal is not simply to collect more data.
The goal is to collect relevant data at the right frequency and convert it into insights that support better business decisions.
Conclusion
China's social commerce environment changes quickly. Prices move. Sellers enter and exit categories. Promotions change product visibility. Consumer demand shifts with seasons, campaigns, and market conditions.
Scrape China's social commerce market using Pinduoduo data can help businesses build a historical view of these changes. Structured data can support pricing intelligence, product research, seller analysis, promotion monitoring, assortment planning, and demand analysis.
The strongest approach starts with a clear objective. Define the products and categories. Select the right fields. Set an appropriate monitoring frequency. Store historical records. Then connect the data to dashboards, analytics platforms, or internal applications.
Businesses should also review platform terms, applicable laws, and data-access permissions before starting a collection project.
Contact Real Data API today to discuss your Pinduoduo data requirements and build a scalable e-commerce data solution for smarter pricing, product, and market analysis!
Latest posts
Extract Flipkart Product Review Data For Brand Analysis - How To Track Customer Sentiment, Ratings, And Product Performance?
How To Track Prices, Products, And Consumer Demand When Scrape China's Social Commerce Market Using Pinduoduo Data?
How to Track Ratings, Prices, and Consumer Preferences When Scrape CellarTracker wine data to identify wine trends?
How to Scrape DAZN streaming data for sports viewing trends to Identify Popular Sports, Events, and Viewer Preferences?







.png)



