Introduction
Turkey's food delivery market has become increasingly competitive, making timely market intelligence essential for restaurants, food brands, retailers, market researchers, and technology companies. Customer preferences can change by city, season, price level, cuisine, promotions, and even time of day. Traditional market research often provides a broad picture but may not reveal what consumers are ordering at the restaurant or neighborhood level.
Scrape food delivery trends in Turkey via Yemeksepeti API provides a data-driven approach to understanding these changes. Businesses can collect structured information around restaurants, menus, prices, categories, ratings, reviews, promotions, and locations to identify patterns across Turkey's food delivery ecosystem.
The value of this approach becomes clearer when looking at the scale and variety of marketplace activity. Yemeksepeti's 2024 data identified chicken döner as Turkey's most ordered food, followed by burgers, lahmacun, pizza, and çiğ köfte. The company also reported that 18:00-19:00 was the busiest ordering period that year.
The platform's 2025 data showed that döner remained the leading preference, while users ordered across traditional Turkish and international cuisines. Saturday was the busiest day and May was the busiest month. Yemeksepeti also reported that users tried approximately seven different restaurants on average during the year.
A structured Food Dataset can turn these types of marketplace signals into historical records that businesses can analyze over time. Instead of looking at individual restaurants manually, analysts can compare prices, menu changes, restaurant density, cuisine popularity, promotional activity, and other indicators across cities and periods.
This makes food-delivery data useful not only for understanding current consumer behavior but also for identifying emerging trends, benchmarking competitors, optimizing menus, and making better market-entry decisions.
Building a Comprehensive Restaurant Intelligence Layer
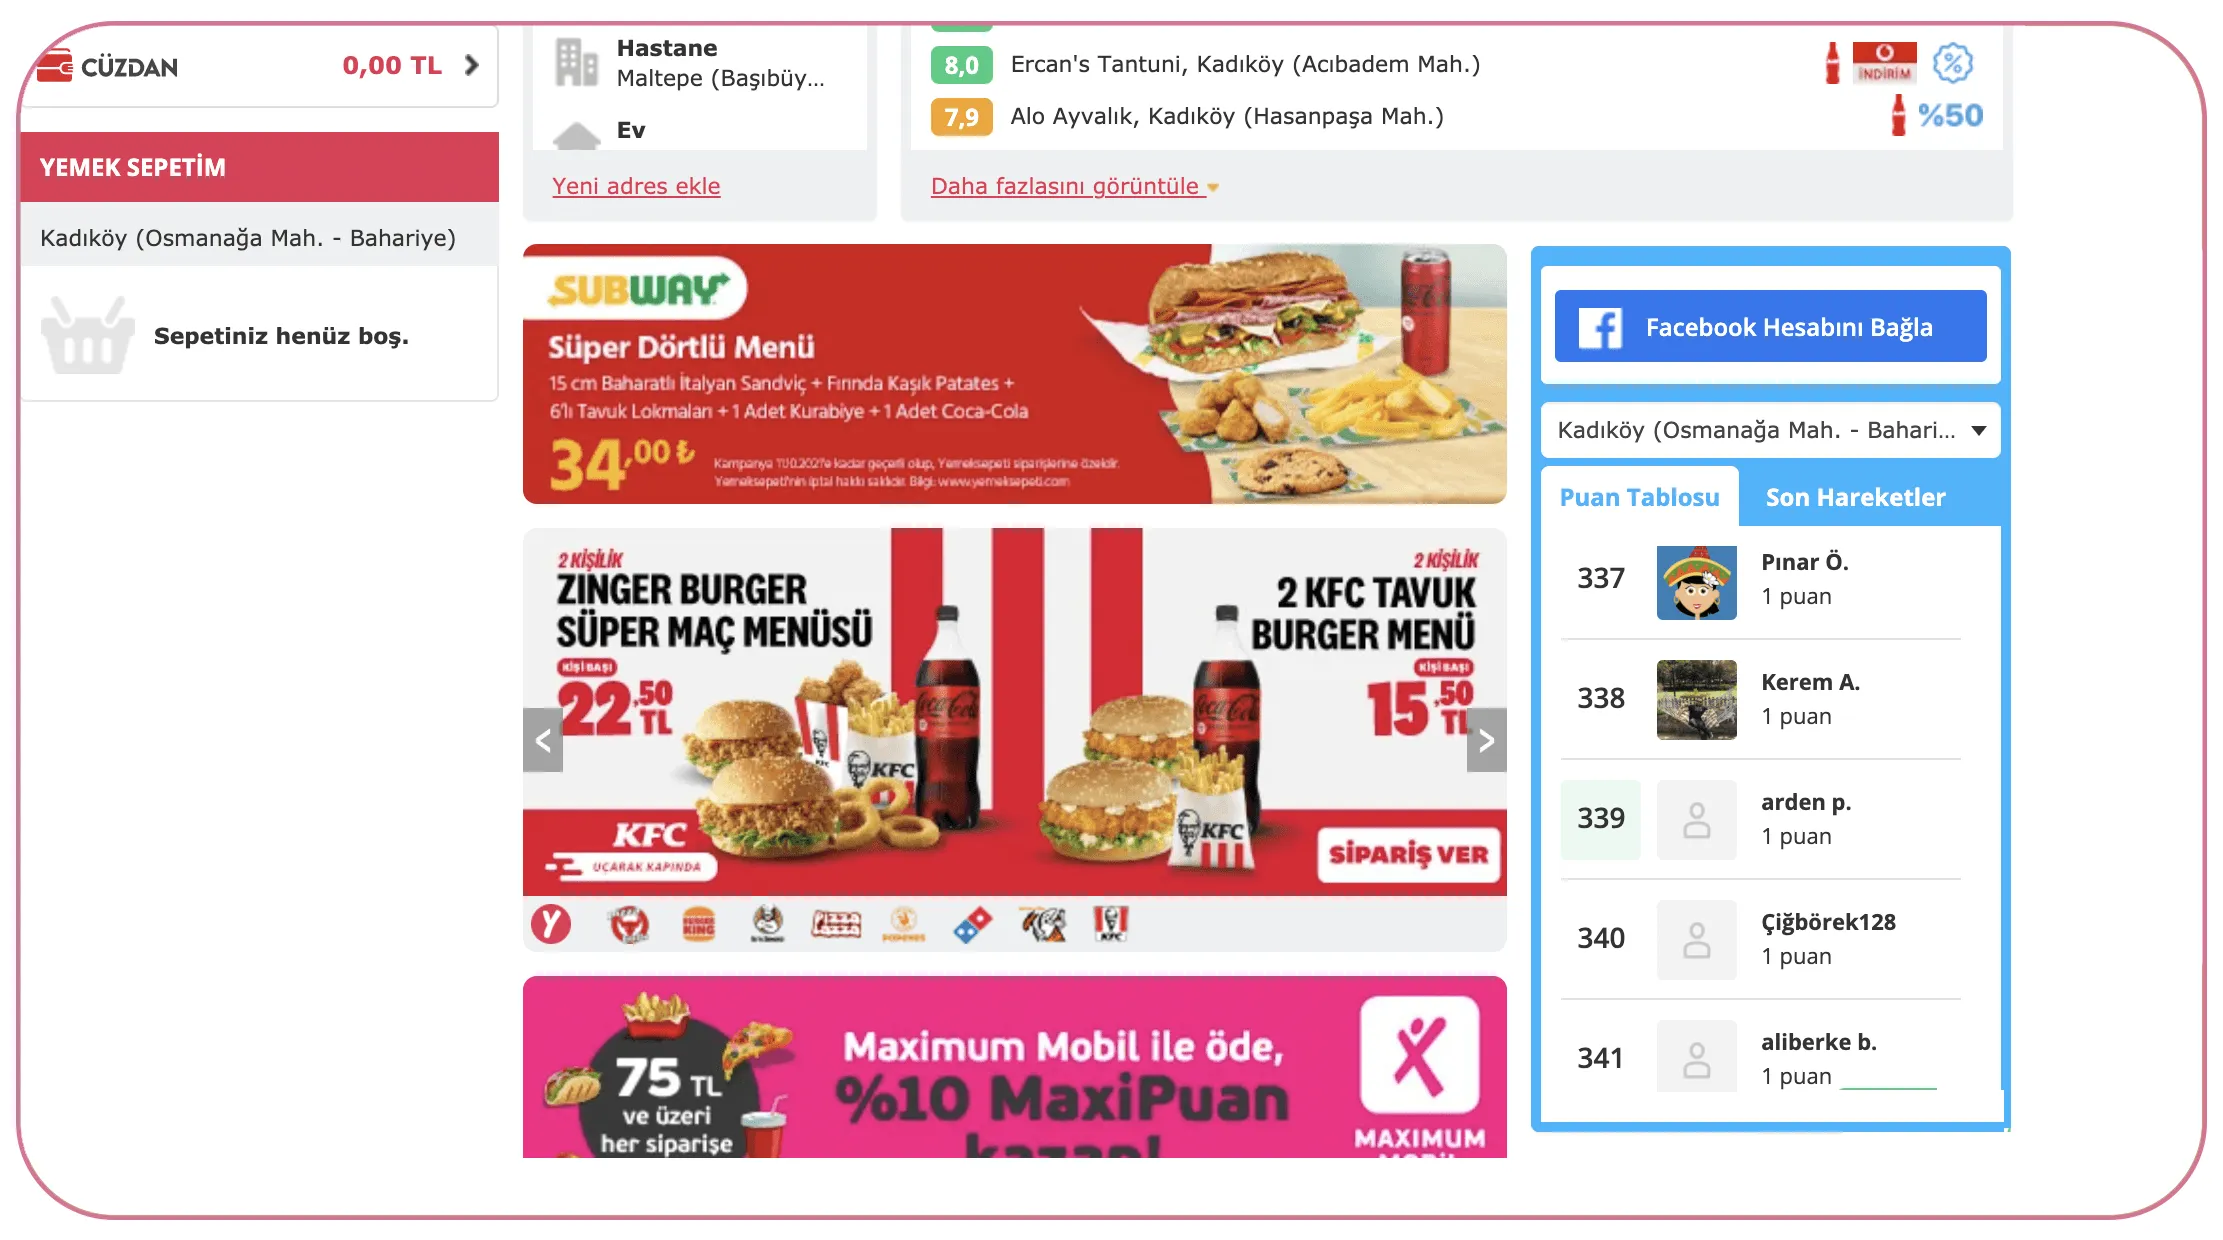
Restaurants are at the center of food-delivery intelligence. Businesses need to know which restaurants are active, what they sell, how much they charge, which cuisines dominate particular locations, and how customer engagement changes over time. Extract restaurant and menu data from Yemeksepeti can support this type of structured market analysis.
The collected information can include restaurant names, cuisine categories, locations, menu items, item prices, ratings, review counts, discounts, delivery information, and other publicly available attributes. When these fields are collected repeatedly, they can provide a historical view of restaurant-market changes.
For example, a restaurant chain considering expansion into Istanbul could compare competing restaurants across selected districts. Analysts could evaluate the number of restaurants in each cuisine category, average menu prices, discount frequency, ratings, and menu diversity. A similar analysis could be performed in Ankara, Izmir, Bursa, Antalya, and other cities.
Yemeksepeti's 2024 data provides a useful benchmark. Chicken döner was the platform's most ordered food, while burger, lahmacun, pizza, and çiğ köfte also appeared among the top five. The platform also reported that döner, pilaf, and home-cooked meals were among the categories with the fastest restaurant growth during the year.
| Year | Restaurant intelligence focus | Example KPI |
|---|---|---|
| 2020 | Establish historical baseline | Restaurant count |
| 2021 | Monitor category recovery | Cuisine distribution |
| 2022 | Track delivery expansion | Menu availability |
| 2023 | Benchmark competition | Average menu price |
| 2024 | Analyze established trends | Cuisine popularity |
| 2025 | Monitor consumer diversification | Restaurant discovery |
| 2026 | Detect current changes | Price and menu movement |
This type of structured collection helps businesses move beyond isolated observations. Historical snapshots can reveal whether a cuisine is gaining market presence, whether prices are rising faster in one city than another, or whether new restaurants are entering an already competitive category.
Turning Marketplace Data Into Local Market Intelligence
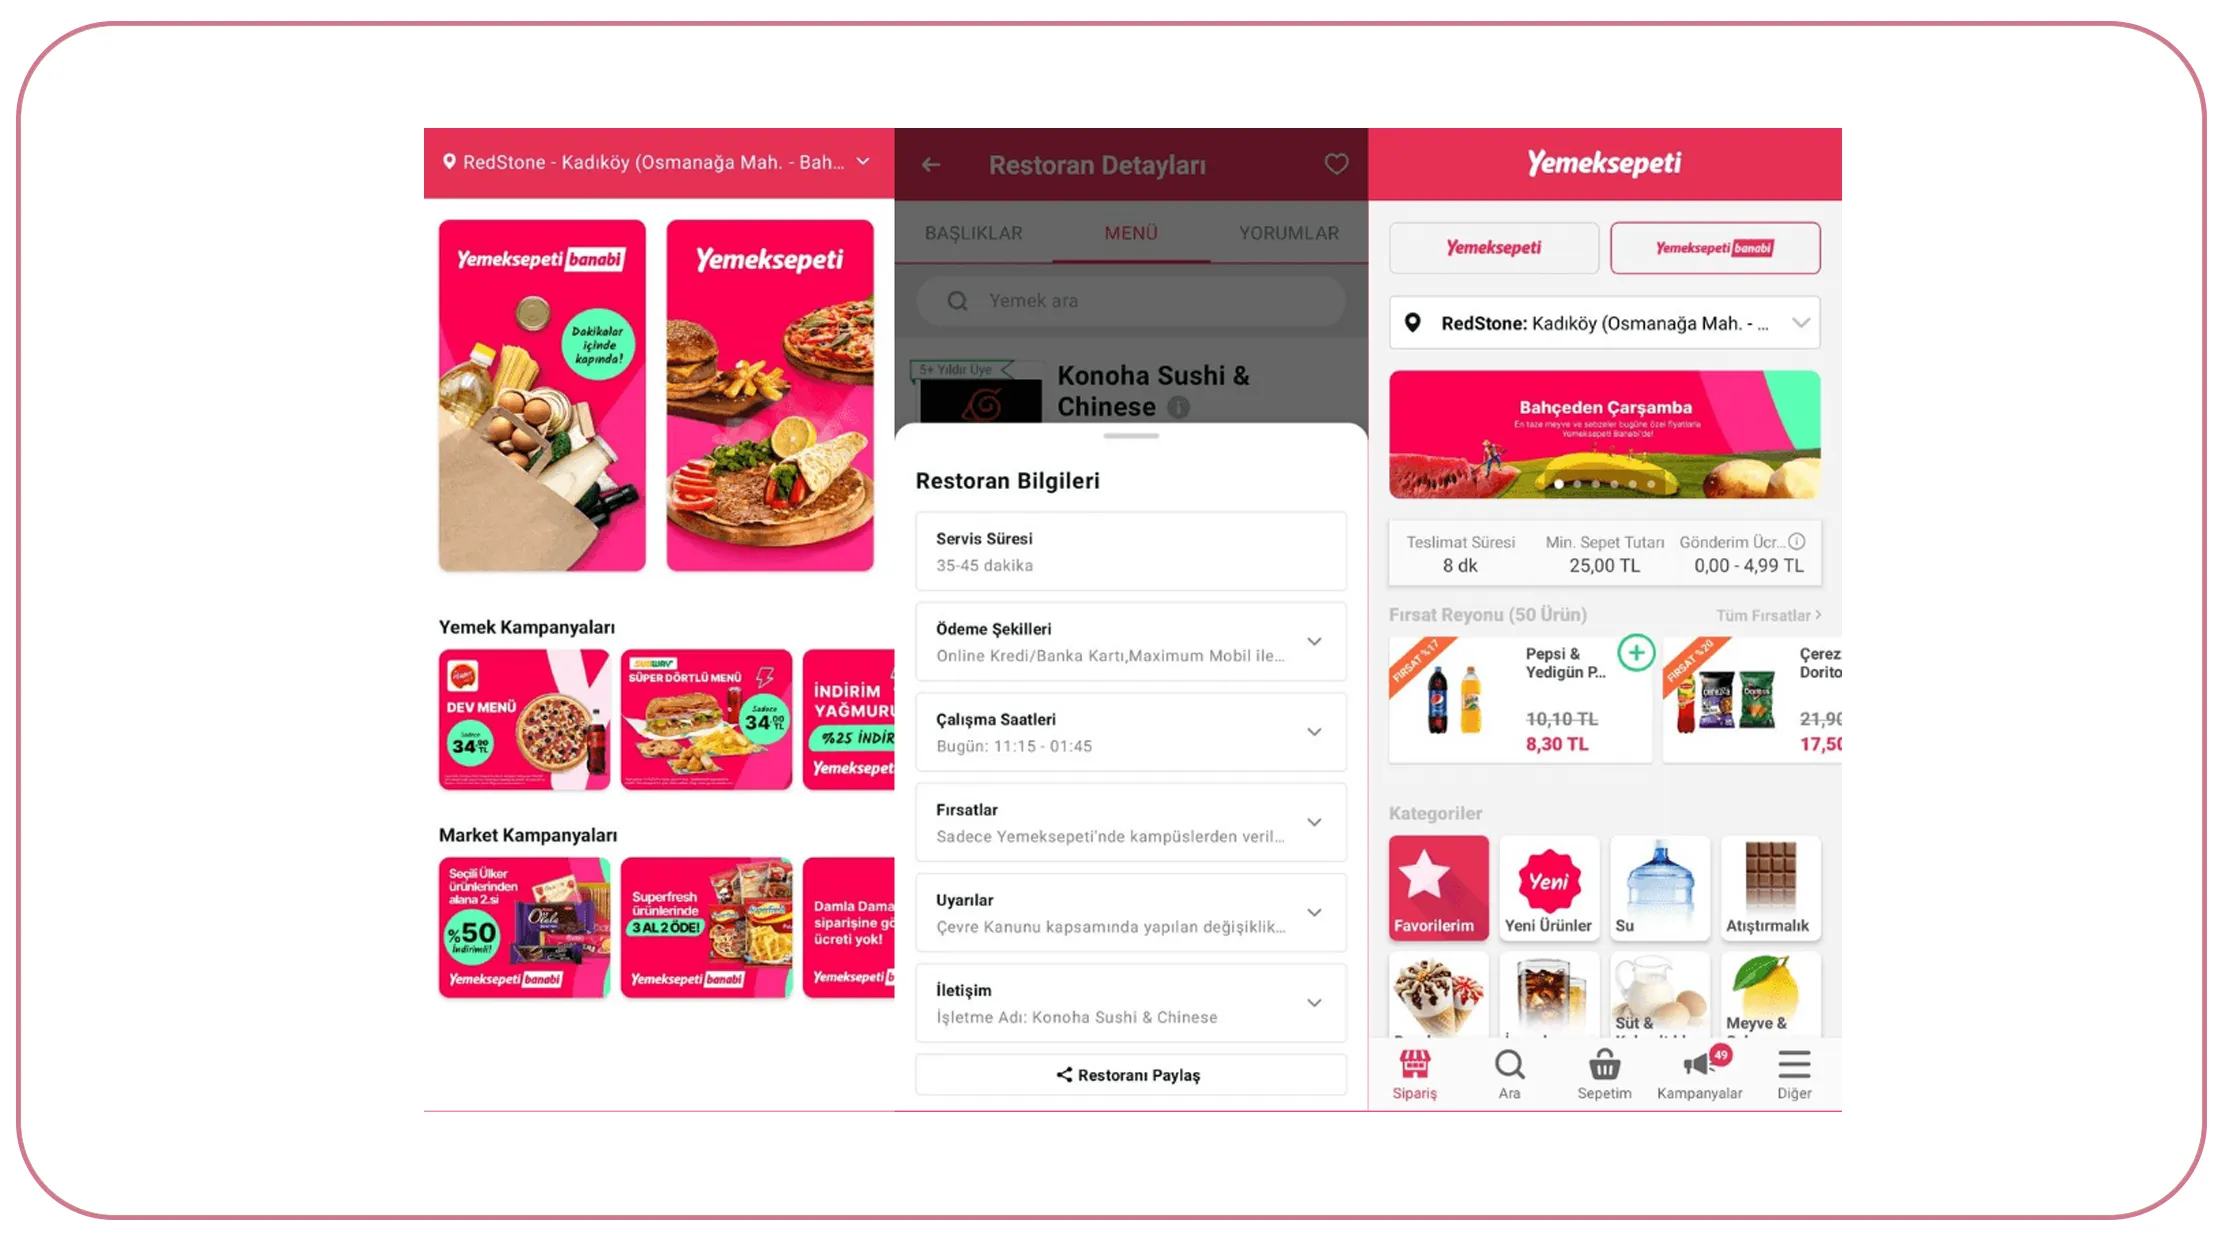
Turkey's food delivery market is not homogeneous. Consumer behavior in Istanbul may differ significantly from Ankara, Izmir, Antalya, Bursa, or Adana. Even within a single city, neighborhoods can have very different restaurant mixes and pricing structures.
Yemeksepeti Turkey food delivery market data scraping allows businesses to analyze these differences at a more granular level. Instead of relying exclusively on national averages, analysts can organize information by city, district, cuisine, restaurant, menu category, and price segment.
This approach can help solve a common market-intelligence problem: knowing that demand is changing without knowing where the change is occurring. If pizza restaurants are becoming more competitive nationally, for example, businesses need to know which cities are driving that growth and whether the increase is caused by new restaurants, changing consumer preferences, or aggressive promotions.
Yemeksepeti's published 2025 analysis demonstrates the value of city-level signals. In Istanbul and Izmir, for example, traditional items such as lahmacun were frequently paired with complementary products such as ayran and lentil soup. The platform also reported that Saturday was the busiest ordering day nationally in 2025.
| Year | Market-intelligence objective | Data points to compare |
|---|---|---|
| 2020 | Identify baseline conditions | Cities, restaurants, cuisines |
| 2021 | Detect behavioral changes | Orders, menus, prices |
| 2022 | Measure delivery adoption | Restaurant coverage |
| 2023 | Track competition | Restaurant density |
| 2024 | Identify leading categories | Cuisine rankings |
| 2025 | Analyze local preferences | City and day patterns |
| 2026 | Monitor emerging signals | Current pricing and supply |
The result is a location-focused intelligence framework. Businesses can identify areas with high restaurant concentration, underserved cuisines, competitive pricing gaps, and changing menu preferences.
For investors and market researchers, this can support market sizing and location analysis. For restaurant groups, it can support expansion planning. For food manufacturers, it can reveal which categories and menu ingredients are becoming more visible across the delivery ecosystem.
Monitoring Pricing and Menu Competition
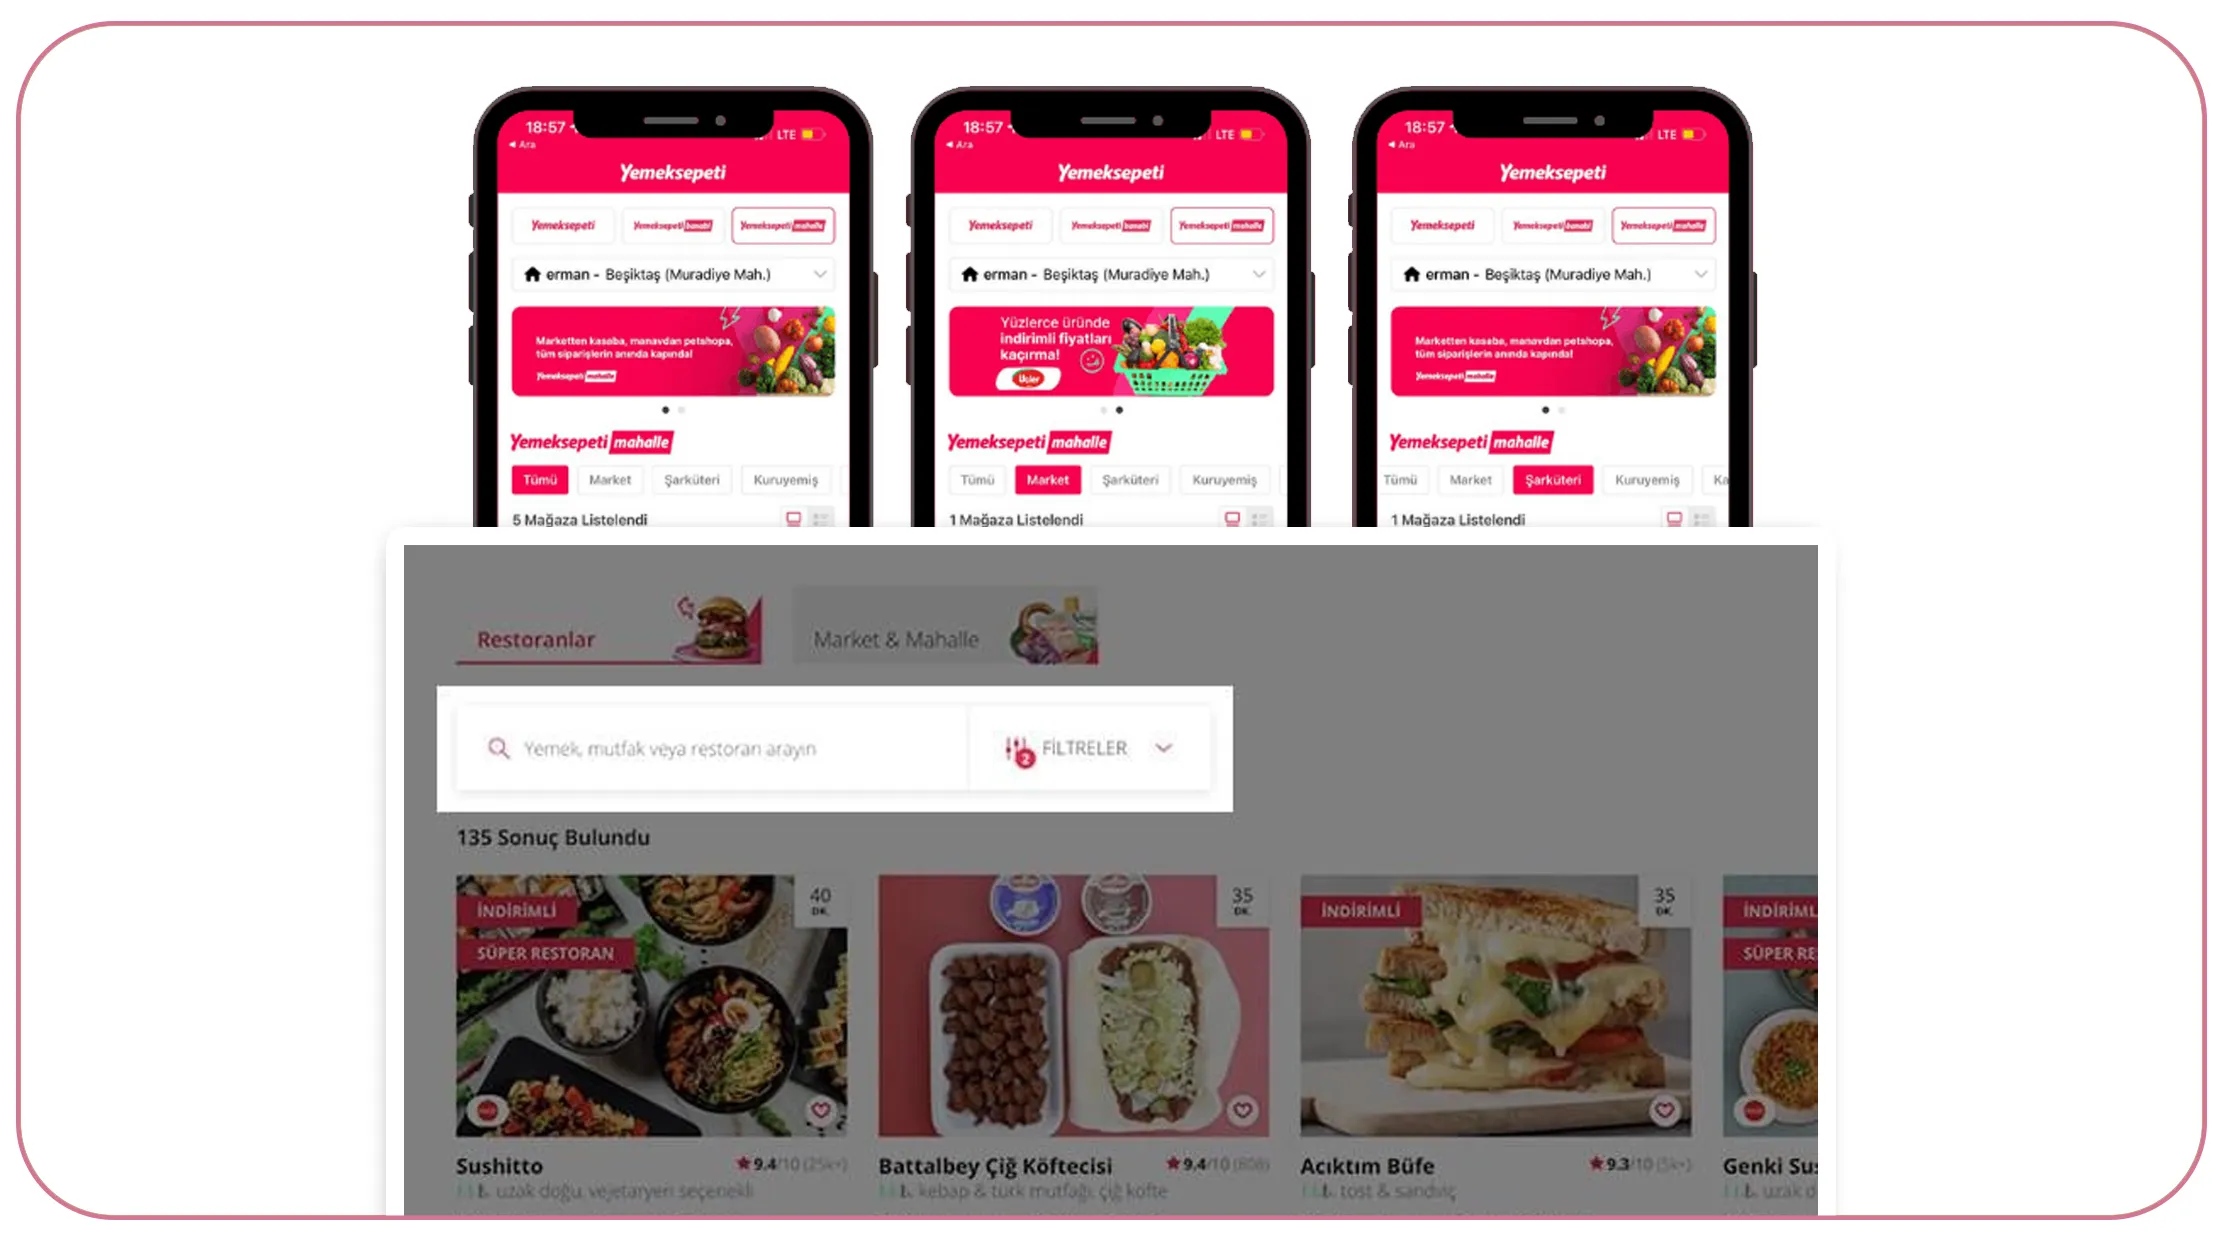
Price is one of the most important variables in online food ordering. Consumers can compare restaurants quickly, while restaurants can change prices and promotions frequently. Businesses that monitor these movements can better understand competitive positioning and identify pricing opportunities.
Web Scraping restaurant menu prices using Yemeksepeti data can provide a structured way to benchmark menu prices across restaurants and locations. Analysts can compare similar meals, portion sizes, add-ons, combo menus, delivery charges, promotional discounts, and category-level pricing.
Repeated collection is particularly important. A single price snapshot tells an analyst what a restaurant charges today. Monthly or weekly snapshots can show whether prices are increasing, decreasing, or remaining stable. Businesses can then compare their own pricing strategy against competitors.
Yemeksepeti's 2024 reporting highlighted the importance of promotional activity, noting that its campaigns distributed more than 3 billion TL in discounts during 2023. In 2024, the company reported creating 7.7 billion TL in economic value for users through discounts, campaigns, and its loyalty program.
| Year | Pricing analysis focus | Example metric |
|---|---|---|
| 2020 | Establish price baseline | Median meal price |
| 2021 | Compare price changes | Year-over-year movement |
| 2022 | Monitor inflation effects | Price per portion |
| 2023 | Benchmark competitors | Price gap |
| 2024 | Analyze promotion intensity | Discount percentage |
| 2025 | Track basket-based offers | Promotional threshold |
| 2026 | Monitor current pricing | Weekly price movement |
The resulting dataset can support competitive price indexes. For example, a business could calculate the median price of a burger menu across selected Istanbul districts and compare it with its own menu price.
It can also identify promotional patterns. If competitors frequently use discounts during certain hours or days, businesses can evaluate whether similar promotions are necessary or whether they can differentiate through menu value, quality, portion size, or convenience.
Creating an Automated Delivery Data Pipeline
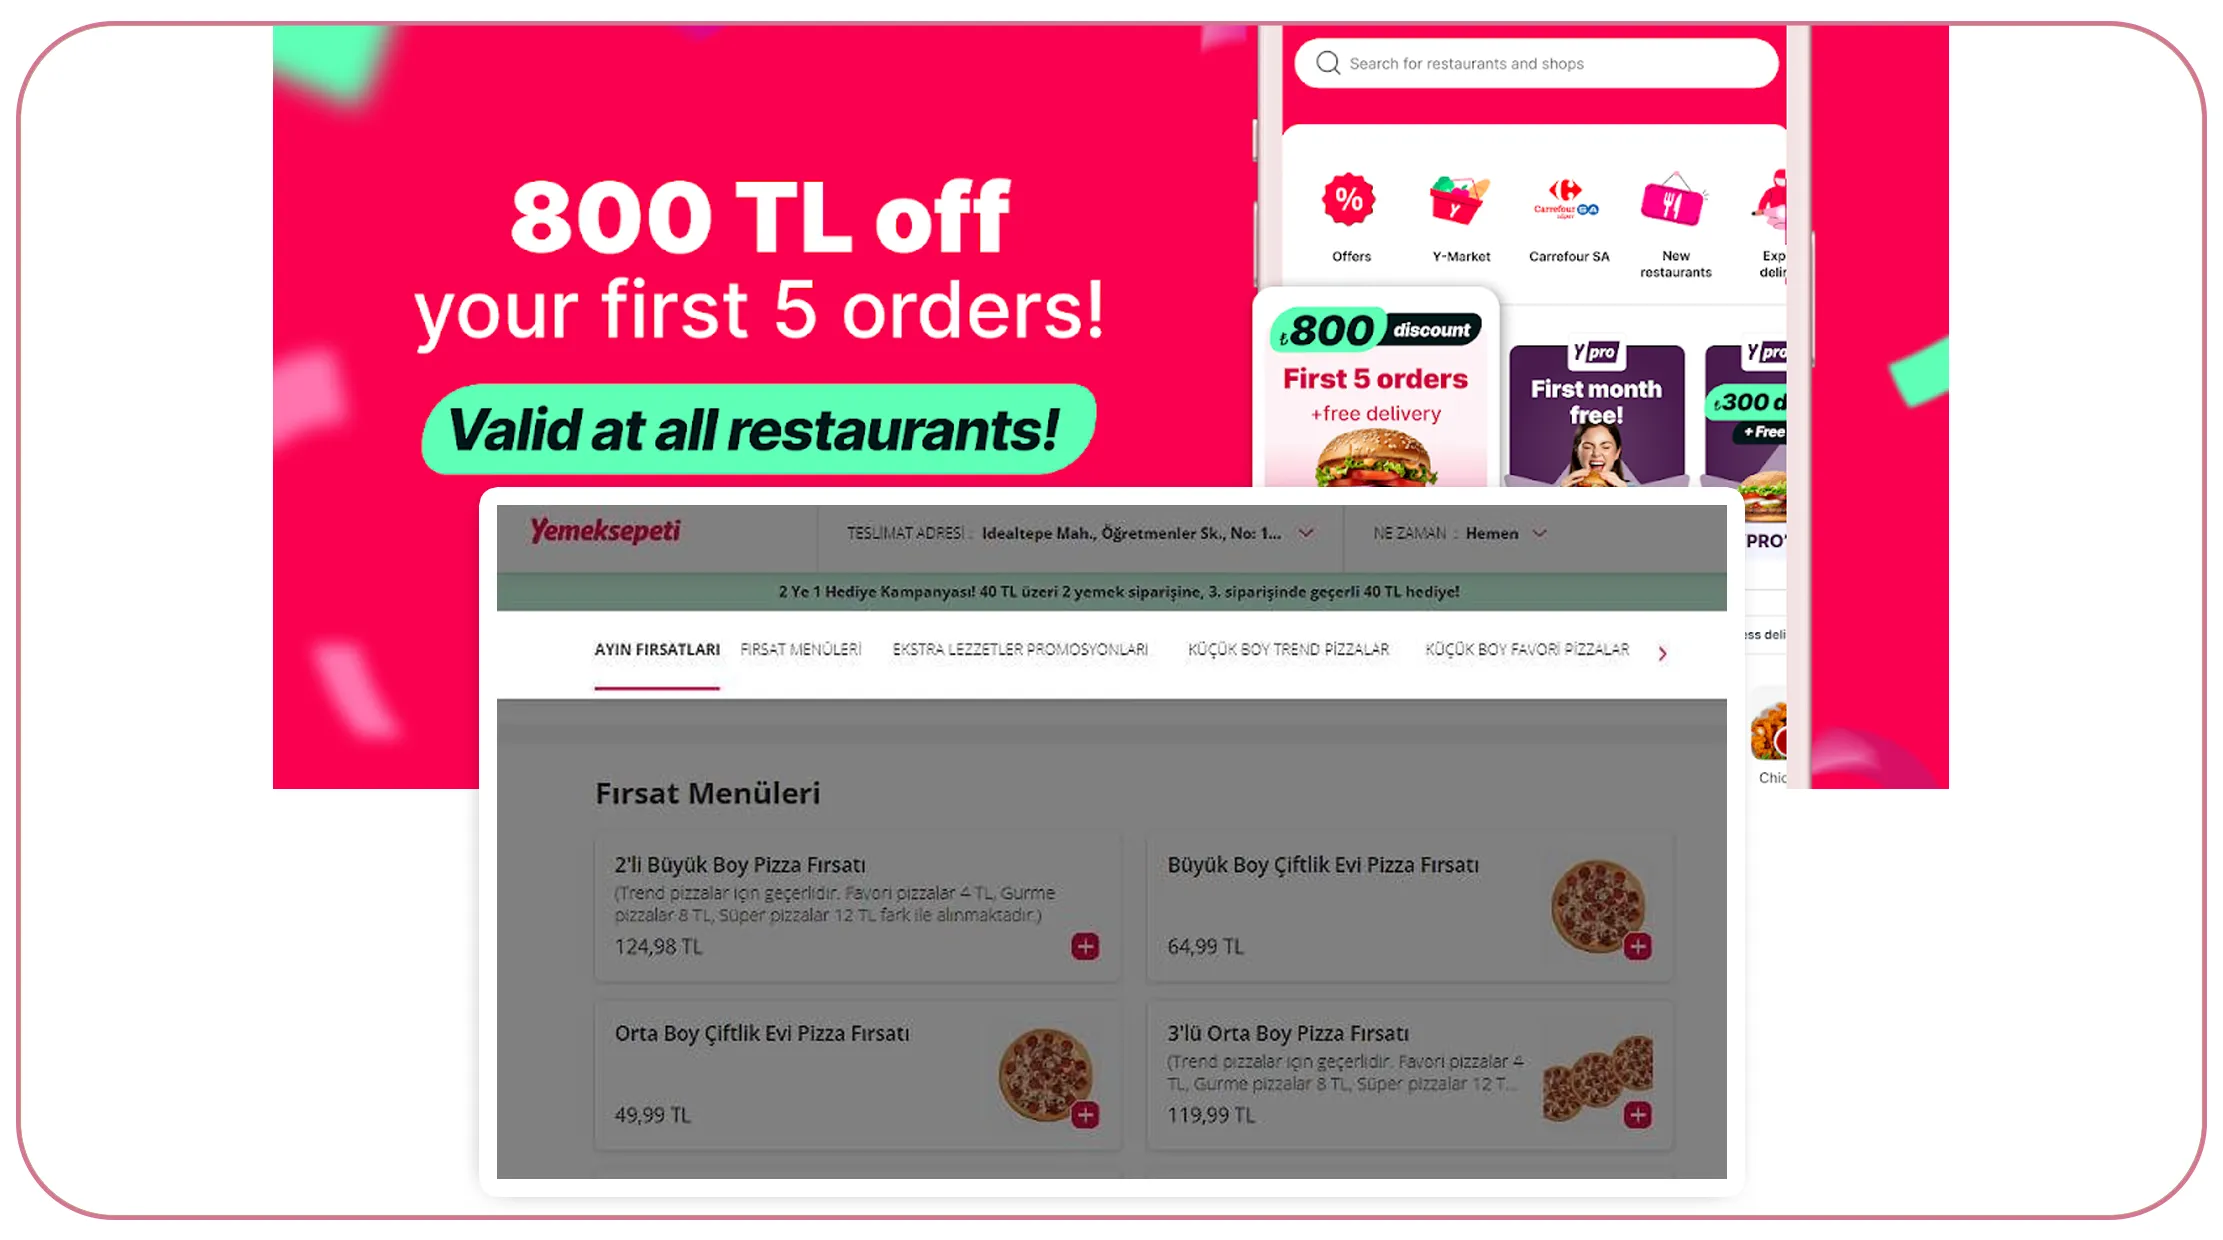
Manual research becomes inefficient when companies need to monitor thousands of restaurant records or repeat data collection over extended periods. An automated data pipeline can reduce repetitive work and make marketplace monitoring more consistent.
A Yemeksepeti Delivery API workflow can be designed around structured restaurant, menu, pricing, location, and category information. Depending on the permitted data-access method, businesses can integrate collected information into databases, dashboards, analytics platforms, or internal applications.
The major advantage of automation is frequency. A market research team may need monthly information, while a pricing team could require daily or weekly observations. Automated workflows can be designed around these different analytical requirements.
A typical pipeline includes:
- Collection.
- Validation.
- Normalization.
- Storage.
- Analysis.
Collection gathers available marketplace information. Validation identifies missing or duplicate records. Normalization standardizes restaurant names, categories, prices, and locations. Storage preserves historical snapshots. Analysis converts the data into business metrics.
| Year | Automation priority | Recommended output |
|---|---|---|
| 2020 | Historical reconstruction | Baseline database |
| 2021 | Dataset standardization | Clean restaurant records |
| 2022 | Delivery-market expansion | Location-level dataset |
| 2023 | Competitive monitoring | Price benchmark |
| 2024 | Promotion tracking | Discount database |
| 2025 | Consumer trend monitoring | Restaurant and menu trends |
| 2026 | Near-real-time intelligence | Automated dashboards |
Automation also enables alerts. A business could configure a system to flag significant menu-price changes, newly listed competitors, disappearing menu items, changes in ratings, or major promotional activity.
This makes the data operational rather than purely informational. Teams can receive structured updates and respond to market changes without manually checking hundreds of restaurant pages.
Converting Raw Marketplace Signals Into Business Dashboards
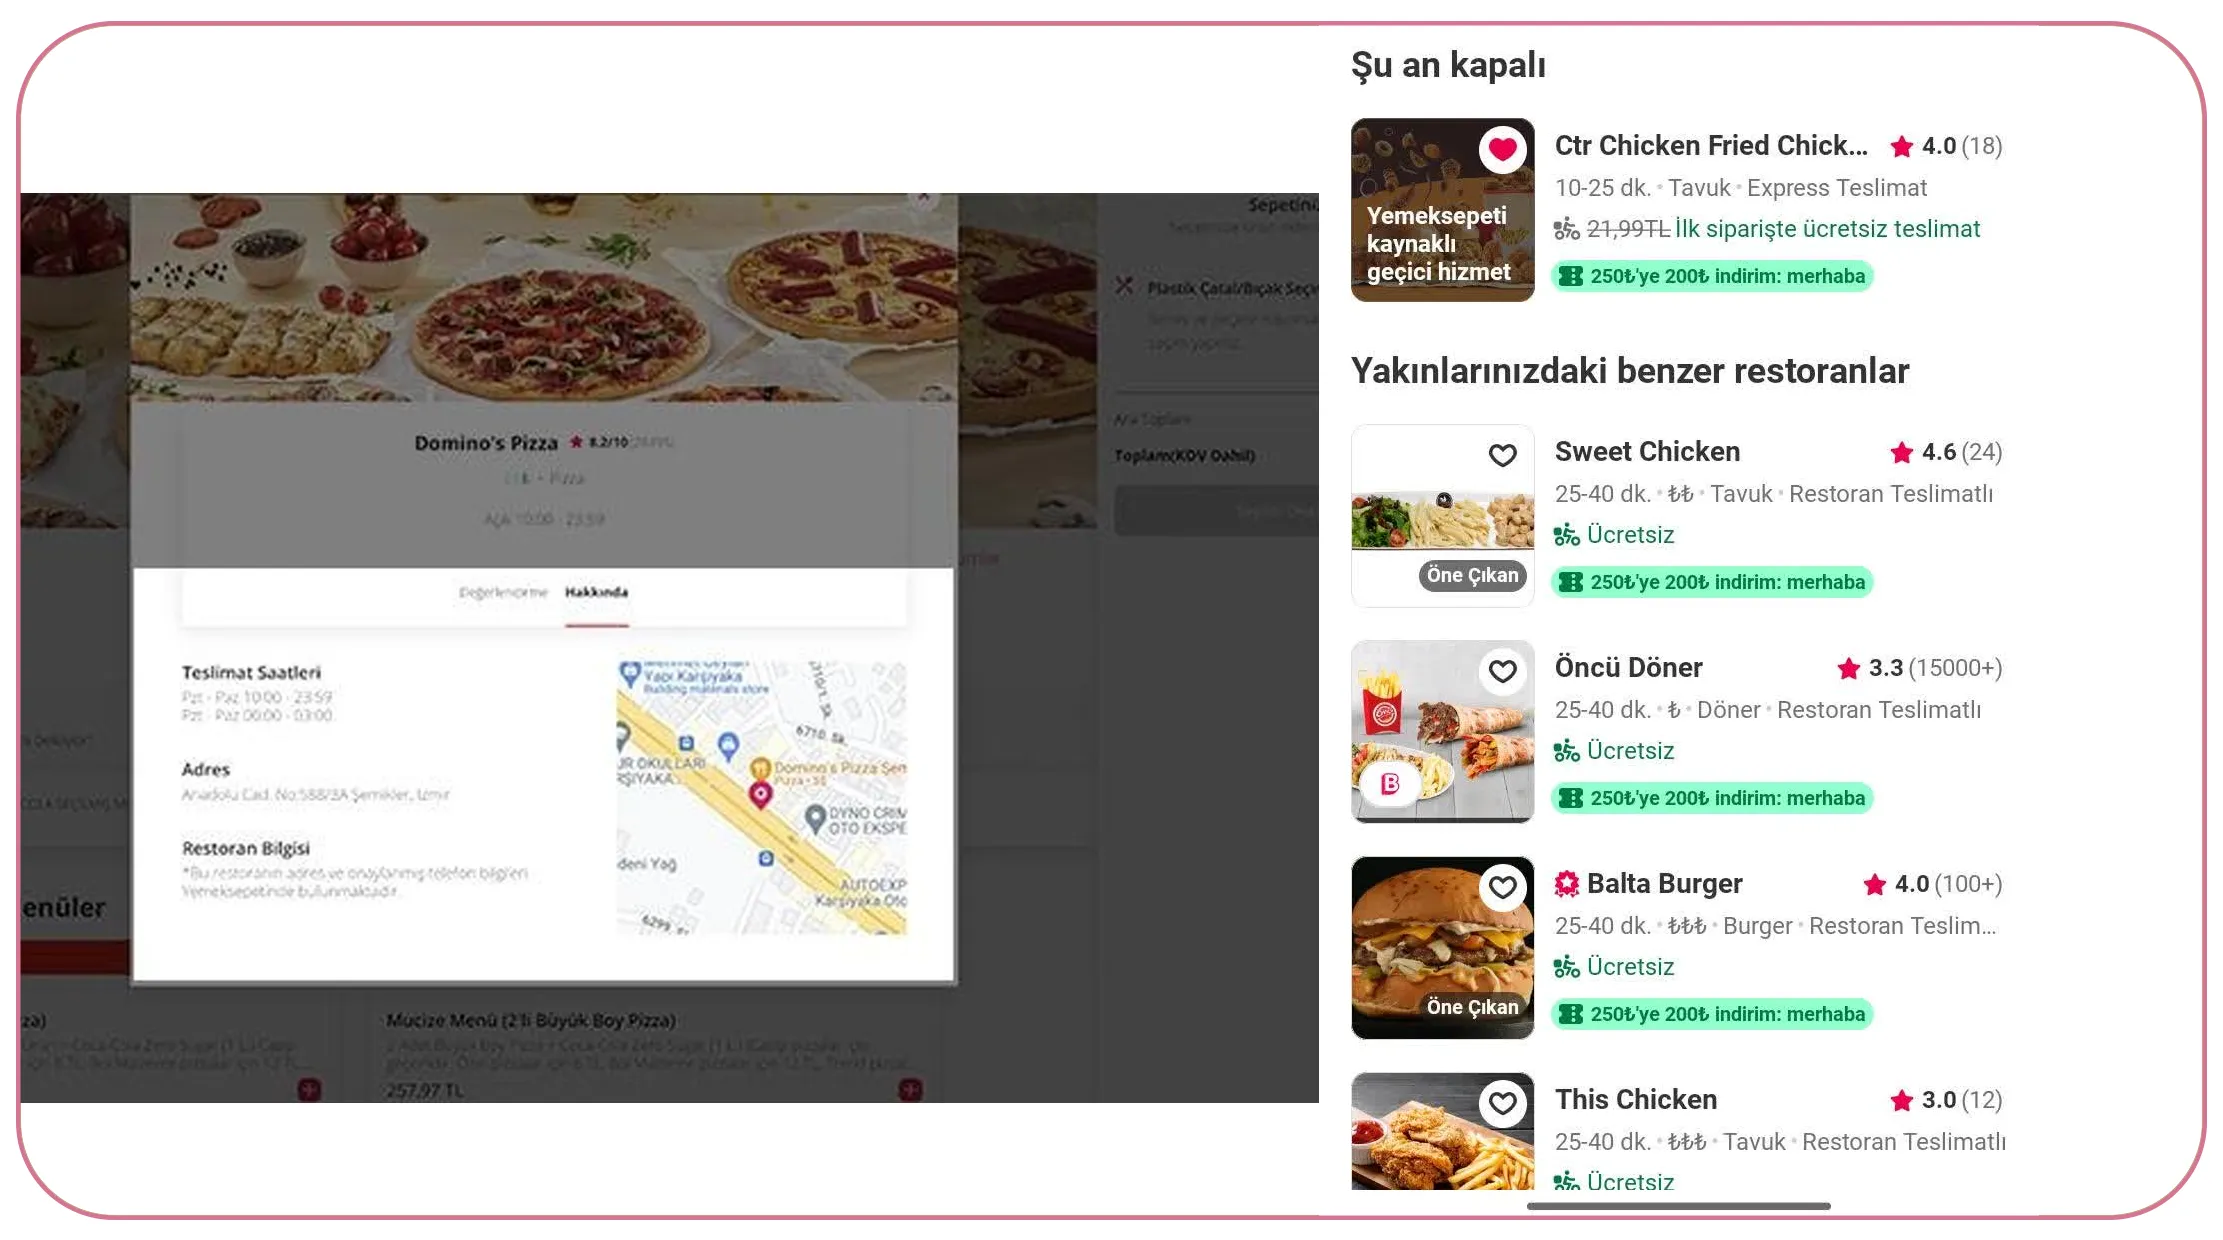
Raw data becomes much more useful when decision-makers can visualize it. A Food Delivery Dashboard can transform restaurant, menu, pricing, cuisine, and location information into interactive business intelligence.
For example, a dashboard could show average menu prices by city, restaurant counts by cuisine, top menu categories, promotional intensity, rating distributions, and changes in restaurant availability. Filters could allow users to select a specific city, district, cuisine, restaurant group, or time period.
The dashboard can also incorporate Scrape food delivery trends in Turkey via Yemeksepeti API as part of a recurring intelligence workflow. This enables businesses to compare current observations with historical snapshots and identify changes in local market conditions.
Yemeksepeti's 2025 data provides several useful examples of dashboard-ready indicators. Saturday was the busiest ordering day, May was the busiest month, and users tried approximately seven different restaurants on average during the year.
| Year | Dashboard dimension | Example visualization |
|---|---|---|
| 2020 | Restaurant supply | Restaurant-count trend |
| 2021 | Cuisine mix | Category distribution |
| 2022 | Pricing | Average price chart |
| 2023 | Competition | Restaurant-density map |
| 2024 | Consumer preferences | Top-food ranking |
| 2025 | Ordering behavior | Day/month analysis |
| 2026 | Current market | Live or latest snapshot |
Dashboards can also help different departments use the same underlying dataset. Marketing teams can monitor promotions and popular categories. Pricing teams can benchmark competitors. Operations teams can examine restaurant density and availability. Strategy teams can evaluate market-entry opportunities.
The result is a centralized view of food-delivery activity rather than separate spreadsheets maintained by individual teams.
Scaling Data Collection for Advanced Food Analytics
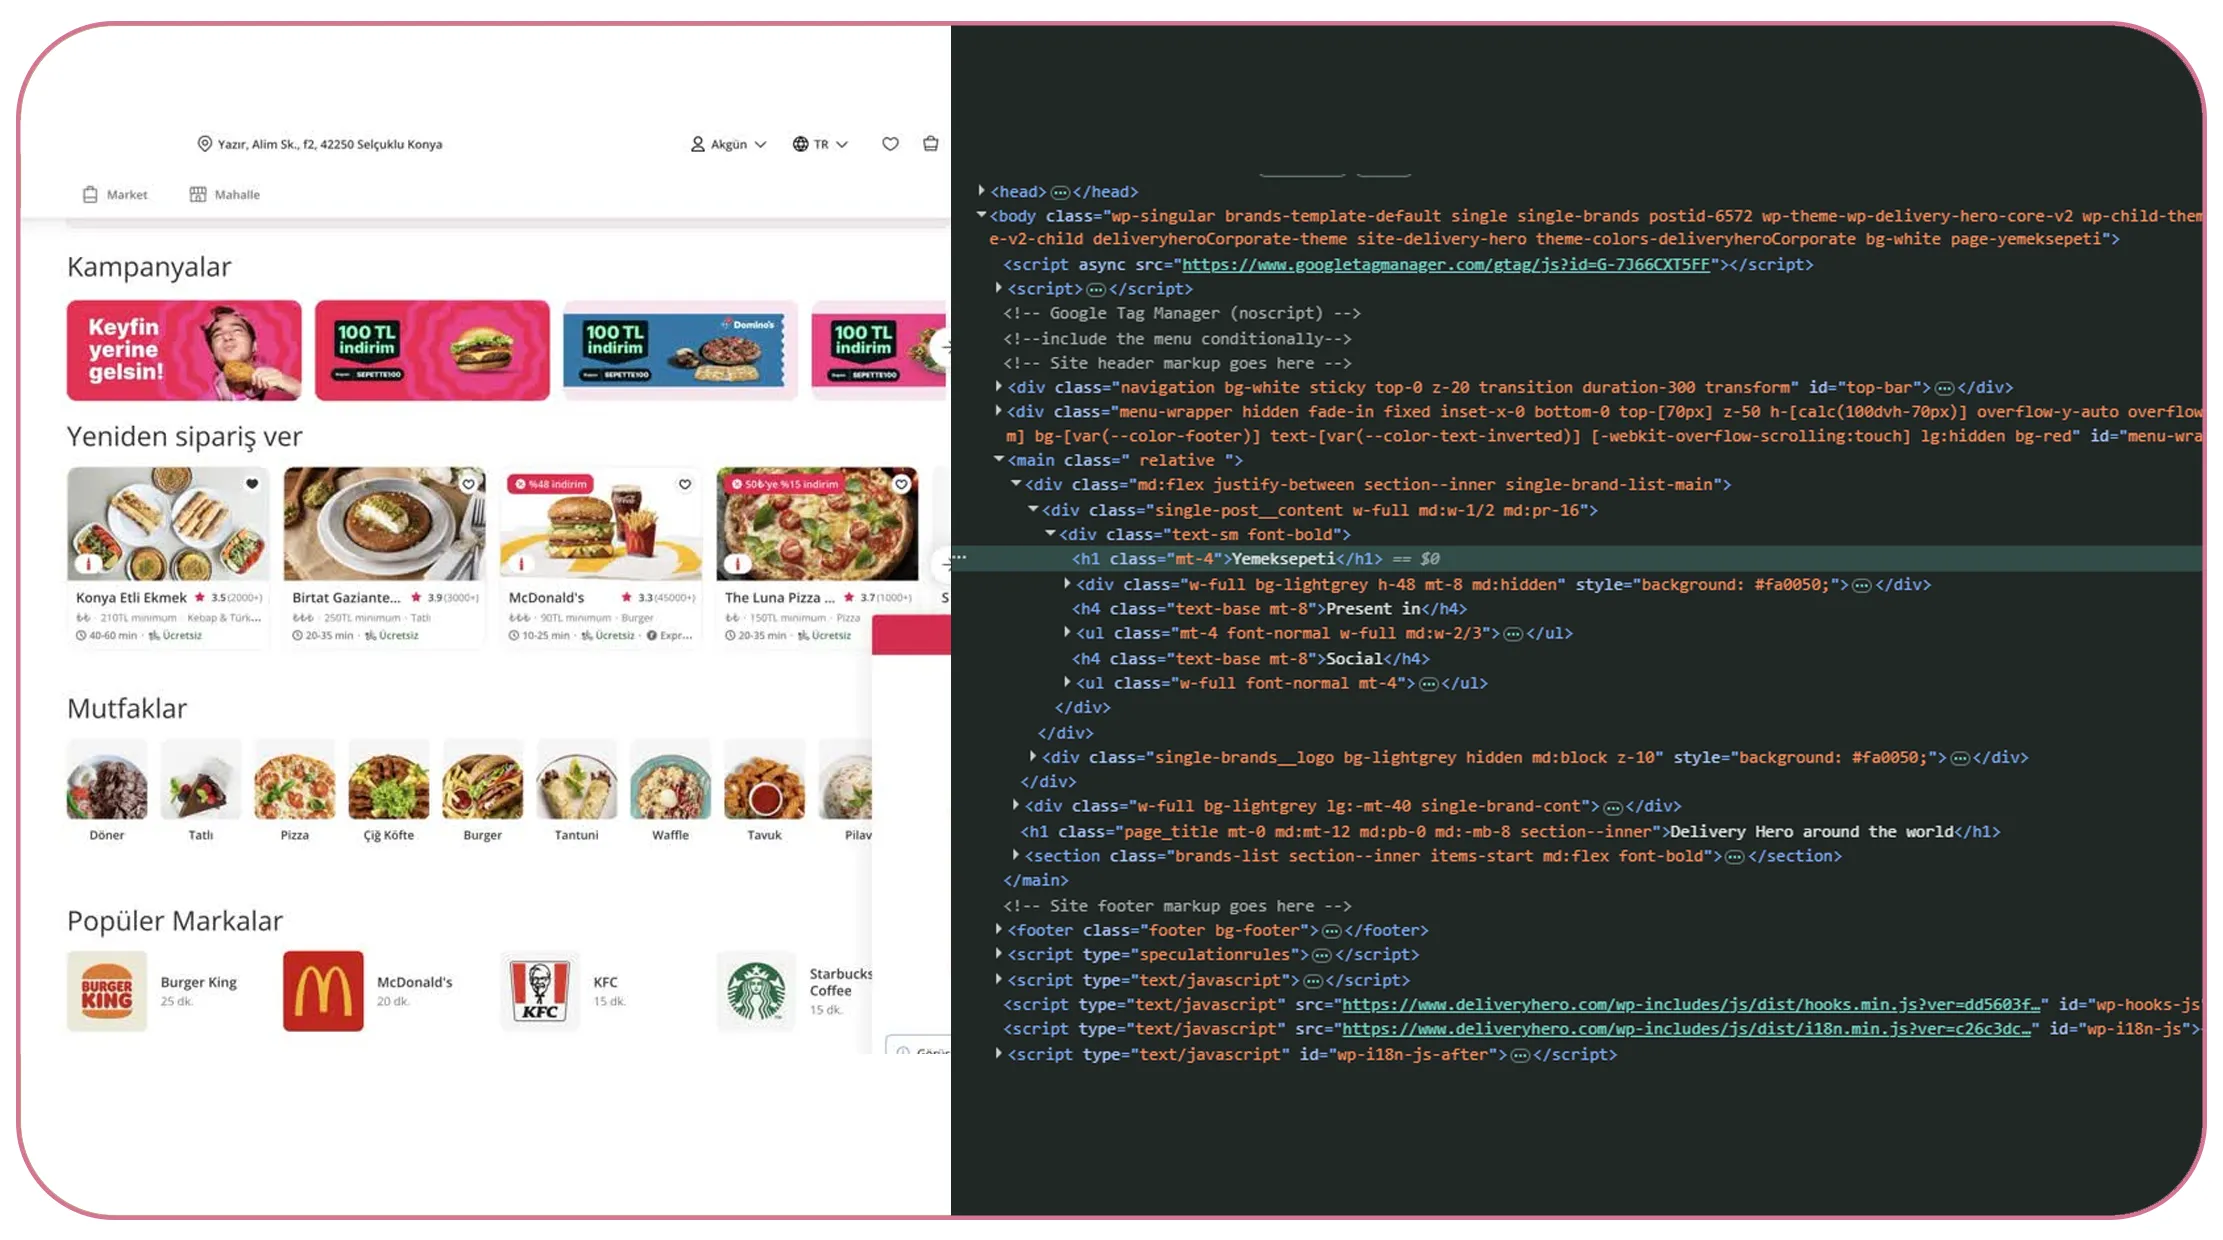
As food-delivery intelligence requirements grow, businesses often need a scalable way to collect and deliver structured information. A Food Data Scraping API can support workflows where restaurant, menu, pricing, and marketplace information must be integrated into analytical systems repeatedly.
A scalable data process can support different levels of analysis. At the restaurant level, companies can monitor competitors and menu changes. At the category level, they can measure cuisine growth and pricing trends. At the city level, they can identify geographic differences. At the national level, they can evaluate broader market movements.
Historical data from 2020 through 2026 can provide the foundation for trend modeling. Analysts can calculate changes in average prices, restaurant counts, cuisine diversity, ratings, promotions, and menu availability.
| Year | Analytical stage | Key business question |
|---|---|---|
| 2020 | Baseline | What did the market look like? |
| 2021 | Change detection | What changed after the baseline? |
| 2022 | Expansion analysis | Which categories gained visibility? |
| 2023 | Competition | Where did competitive intensity increase? |
| 2024 | Consumer trends | Which foods dominated demand? |
| 2025 | Behavioral analysis | When and what did consumers order? |
| 2026 | Forecasting | What patterns are emerging now? |
The 2024 and 2025 Yemeksepeti reports demonstrate why these datasets can be valuable. In 2024, chicken döner, burgers, lahmacun, pizza, and çiğ köfte were the leading foods. In 2025, döner remained the top preference, while the platform highlighted both traditional favorites and experimentation with new products.
For advanced analytics, historical records can feed forecasting models, competitive-price indexes, location scoring systems, category-growth models, and demand-monitoring tools.
Businesses can therefore move from simply collecting marketplace information to developing a repeatable data infrastructure that supports strategic decisions.
Why Choose Real Data API?
Real Data API helps businesses turn large volumes of marketplace information into structured, usable datasets for research, analytics, and competitive intelligence. The objective is to reduce the manual effort involved in collecting, organizing, and preparing data for business analysis.
For organizations focused on Scrape food delivery trends in Turkey via Yemeksepeti API, a structured workflow can support recurring restaurant, menu, pricing, location, and category analysis.
The resulting datasets can be used by restaurant chains, food brands, market researchers, retailers, investors, pricing teams, and business intelligence professionals. Instead of conducting one-off research projects, teams can establish recurring data pipelines that create historical records and support ongoing monitoring.
Real Data API can also help businesses organize marketplace information into formats that are easier to connect with dashboards, databases, analytics tools, and internal applications. This makes it possible to transform raw marketplace observations into business-ready intelligence.
Whether the objective is competitor monitoring, menu-price benchmarking, restaurant discovery, market expansion, or consumer-trend analysis, a structured data workflow provides a stronger foundation for decision-making.
Conclusion
Turkey's food delivery ecosystem generates valuable signals around consumer preferences, restaurant competition, menu pricing, promotions, cuisine popularity, and ordering behavior. However, these signals become difficult to use when they remain scattered across individual restaurant listings and marketplace pages.
A structured data strategy can solve this challenge by turning marketplace information into consistent historical datasets. Businesses can then compare restaurants, analyze prices, monitor menu changes, identify popular cuisines, evaluate promotional strategies, and detect market opportunities across Turkish cities.
Yemeksepeti's own published 2024 and 2025 analyses demonstrate how marketplace data can reveal detailed consumer patterns, from leading food choices and ordering times to city-level preferences and restaurant-discovery behavior.
For companies looking to build a repeatable intelligence workflow, Scrape food delivery trends in Turkey via Yemeksepeti API can provide the foundation for tracking market movement and turning food-delivery data into actionable insights.
Connect with Real Data API to build scalable restaurant, menu, pricing, competitor, and consumer-trend datasets for smarter decisions across Turkey's food delivery market!
#Yemeksepeti #DataScraping #FoodDelivery #TurkeyMarket #FoodData #MarketResearch #ConsumerInsights #CompetitiveIntelligenceLatest posts
Extract Flipkart Product Review Data For Brand Analysis - How To Track Customer Sentiment, Ratings, And Product Performance?

How To Track Prices, Products, And Consumer Demand When Scrape China's Social Commerce Market Using Pinduoduo Data?
How to Track Ratings, Prices, and Consumer Preferences When Scrape CellarTracker wine data to identify wine trends?
How to Scrape DAZN streaming data for sports viewing trends to Identify Popular Sports, Events, and Viewer Preferences?







.png)



