
Introduction
Modern grocery retail operates in an environment where prices, promotions, product availability, pack sizes, and assortment can change rapidly. For retailers, brands, market researchers, and technology providers, manually collecting this information from large grocery websites is difficult to scale and even harder to maintain consistently. The Albertsons grocery product data extraction guide provides a practical framework for understanding how structured grocery data can support pricing intelligence, catalog monitoring, inventory analysis, and competitive research.
The need for reliable grocery data has increased alongside the expansion of digital commerce. U.S. grocery-store sales increased from approximately $759.7 billion in 2020 to $792.3 billion in 2021, while total U.S. e-commerce represented 13.6% of retail sales in 2020 and 13.2% in 2021. By 2025, total U.S. retail e-commerce sales reached an estimated $1.234 trillion, accounting for 16.4% of total retail sales. In Q1 2026, e-commerce represented 16.9% of total retail sales.
An Albertsons Grocery Scraping API can help convert changing online grocery information into structured datasets containing product titles, brands, categories, prices, promotional offers, package sizes, ratings, availability indicators, and other attributes. These datasets can then feed dashboards, pricing engines, business intelligence platforms, recommendation systems, and market research workflows.
U.S. Retail E-Commerce Trend, 2020-2026
| Year | U.S. E-Commerce Share of Retail Sales | Research Significance |
|---|---|---|
| 2020 | 13.6% | Rapid digital shopping adoption |
| 2021 | 13.2% | Continued online purchasing |
| 2022 | 14.6% | E-commerce expansion |
| 2023 | 15.4% | Digital retail becomes more established |
| 2024 | 16.1% | Increasing online purchasing penetration |
| 2025 | 16.4% | E-commerce exceeds $1.23 trillion |
| 2026 Q1 | 16.9% | Digital channel reaches another high |
Sources: U.S. Census Bureau. The 2026 figure is Q1 2026; earlier annual figures are based on Census Bureau e-commerce releases and revisions.
The growing importance of digital grocery channels makes timely product intelligence increasingly valuable. Albertsons Companies operates more than 2,200 stores nationwide and reports more than 34 million customers served weekly, illustrating the scale at which product information can become operationally important.
1. Building a Structured Grocery Catalog for Better Market Visibility
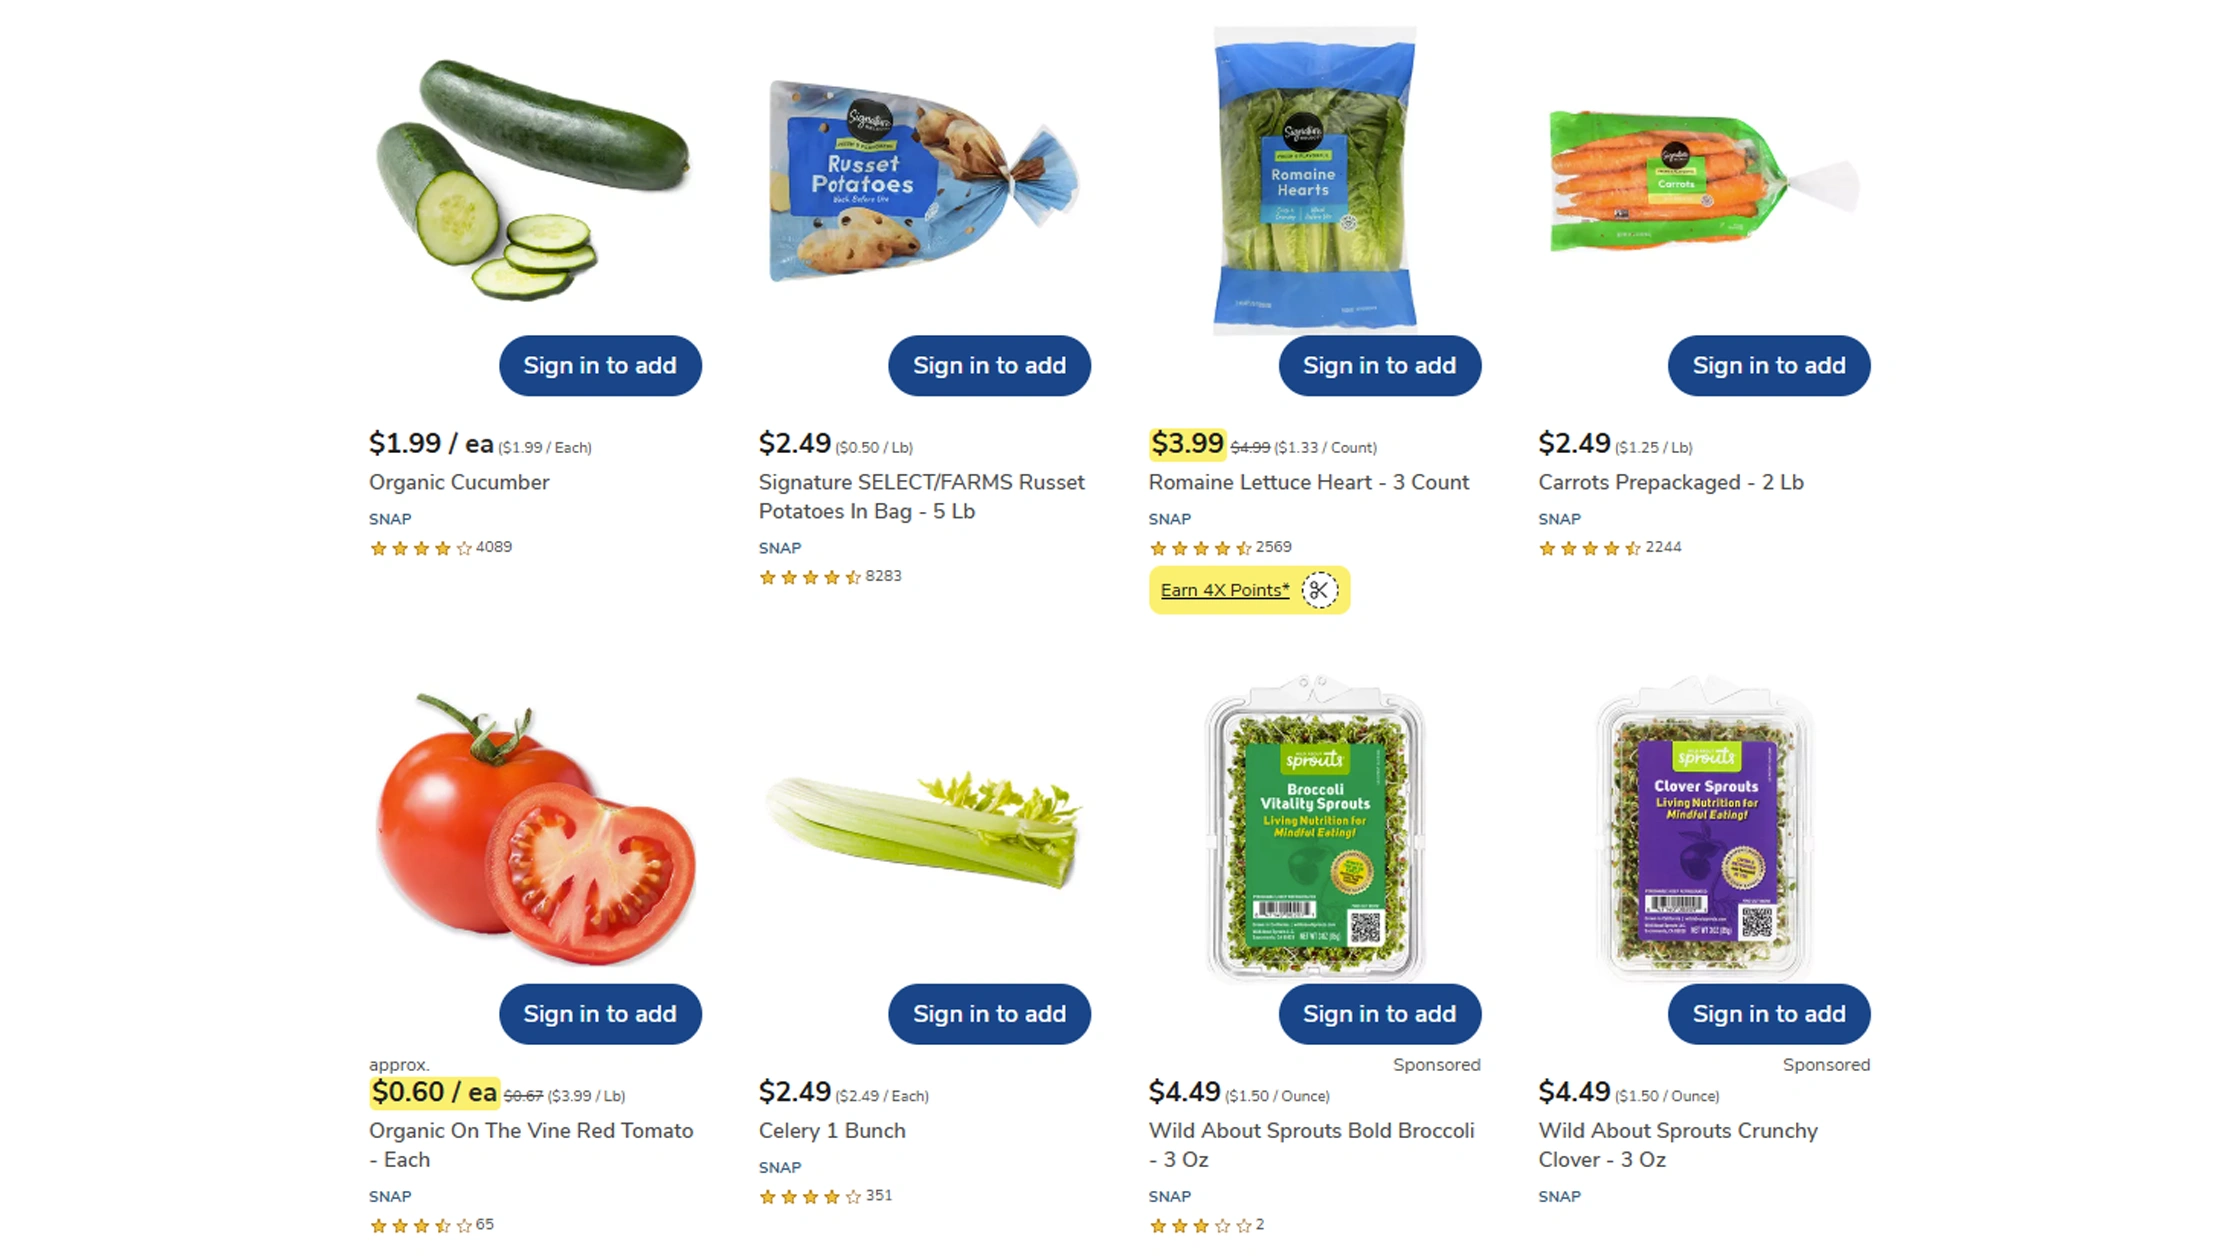
Extract grocery product listings from Albertsons enables businesses to transform dispersed online catalog information into a consistent research dataset. A useful extraction workflow can capture product names, SKU or product identifiers, brand names, categories, subcategories, package quantities, unit prices, promotional prices, images, product descriptions, ratings, availability, and other relevant attributes.
For pricing teams, the value comes from creating a historical record rather than looking at a single product page at one point in time. A product priced at $4.99 today may have been $5.49 last week and $3.99 during a promotion. A structured dataset makes these movements measurable. Analysts can calculate price changes, identify frequently discounted products, compare private-label and national brands, and detect category-level pricing patterns.
The scale of the broader retail market reinforces the importance of this approach. Grocery-store sales increased from $759.4 billion in 2020 to $792.3 billion in 2021 according to Census Bureau estimates, while e-commerce continued to expand as a share of retail.
Market Indicators Supporting Product-Level Intelligence
| Year | Relevant U.S. Retail Indicator | Data Opportunity |
|---|---|---|
| 2020 | Grocery sales: ~$759.7B | Establish historical product benchmarks |
| 2021 | Grocery sales: ~$792.3B | Expand assortment monitoring |
| 2022 | Grocery sales: ~$858.3B | Strengthen category intelligence |
| 2023 | E-commerce: 15.4% of retail | Increase online catalog monitoring |
| 2024 | E-commerce: 16.1% of retail | Improve digital price tracking |
| 2025 | E-commerce: 16.4% of retail | Scale automated monitoring |
| 2026 Q1 | E-commerce: 16.9% of retail | Support near-real-time intelligence |
The extracted dataset can be organized around a product-level schema. For example, each record may contain product ID, product name, brand, category, package size, regular price, promotional price, unit price, availability, rating, review count, URL, timestamp, and store or ZIP-code context where applicable. Timestamped records are particularly important because grocery prices and availability can vary according to location, promotion, fulfillment method, and time.
For retailers and brands, this creates opportunities to benchmark products systematically rather than relying on sporadic manual checks. For data platforms, the same information can become a reusable source for pricing dashboards, competitor intelligence applications, grocery search engines, and category-management systems.
2. Turning Catalog Changes Into Actionable Competitive Intelligence
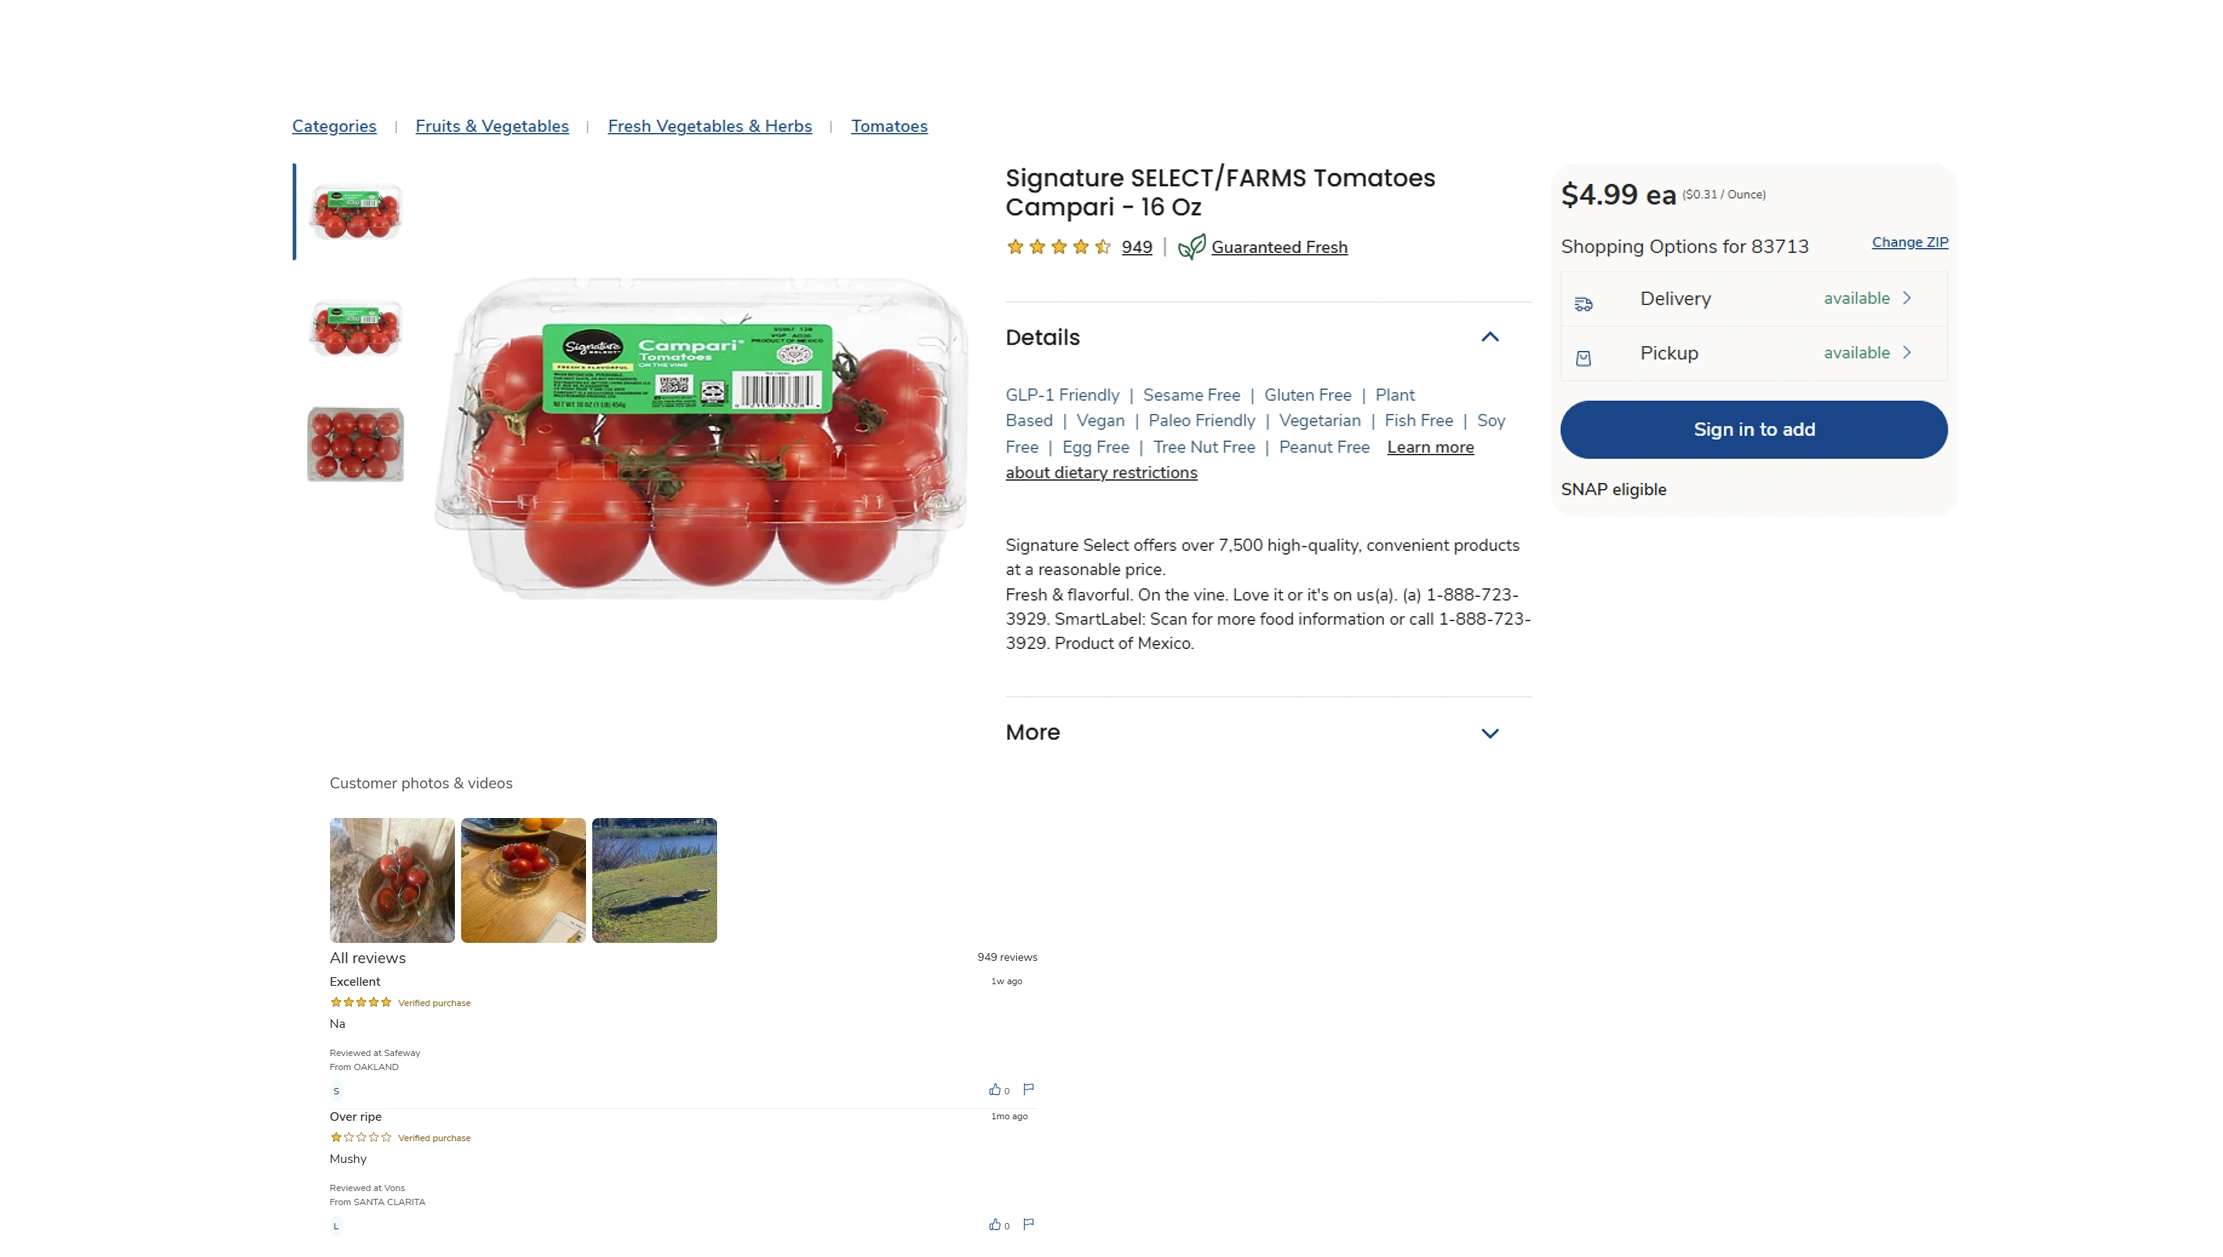
The ability to scrape Albertsons grocery product catalog data provides a foundation for catalog normalization and competitive market analysis. Grocery catalogs are not static databases. Products can be introduced, discontinued, temporarily unavailable, discounted, replaced, reformulated, or displayed differently across digital channels.
A well-designed extraction process therefore needs to capture both product attributes and changes over time. Historical snapshots allow analysts to determine which products remain consistently available, which categories experience frequent assortment changes, and which brands receive greater promotional visibility.
This becomes especially important when comparing private-label products with national brands. Analysts can group products by brand, category, package size, and unit price to calculate meaningful comparisons. For example, comparing a 12-ounce branded product with a 16-ounce private-label product only by displayed price may lead to an inaccurate conclusion. Unit-level normalization makes the comparison more useful.
Digital Retail Expansion and Catalog Monitoring
| Year | E-Commerce Share | Catalog Monitoring Implication |
|---|---|---|
| 2020 | 13.6% | Digital catalogs gained importance |
| 2021 | 13.2% | Online grocery behavior remained significant |
| 2022 | 14.6% | More products required digital visibility |
| 2023 | 15.4% | Catalog changes became easier to observe online |
| 2024 | 16.1% | Automated monitoring became more valuable |
| 2025 | 16.4% | Large-scale product intelligence gained importance |
| 2026 Q1 | 16.9% | Faster digital data refreshes support real-time decisions |
Census Bureau data shows total U.S. e-commerce sales reached approximately $1.034 trillion in 2022 and $1.119 trillion in 2023. By 2025, annual e-commerce sales were estimated at $1.234 trillion.
For a grocery intelligence platform, catalog extraction can support assortment gap analysis, brand monitoring, promotion discovery, product availability studies, and competitive benchmarking. Data can also be normalized into common taxonomies so products from different retailers can be compared using consistent categories and attributes.
Another important application is change detection. A monitoring system can flag when a product's price changes, when a promotion appears, when a product becomes unavailable, or when a new item enters a category. Instead of delivering a static dataset, the process creates an ongoing stream of retail intelligence.
3. Creating SKU-Level Data for Pricing and Assortment Analysis
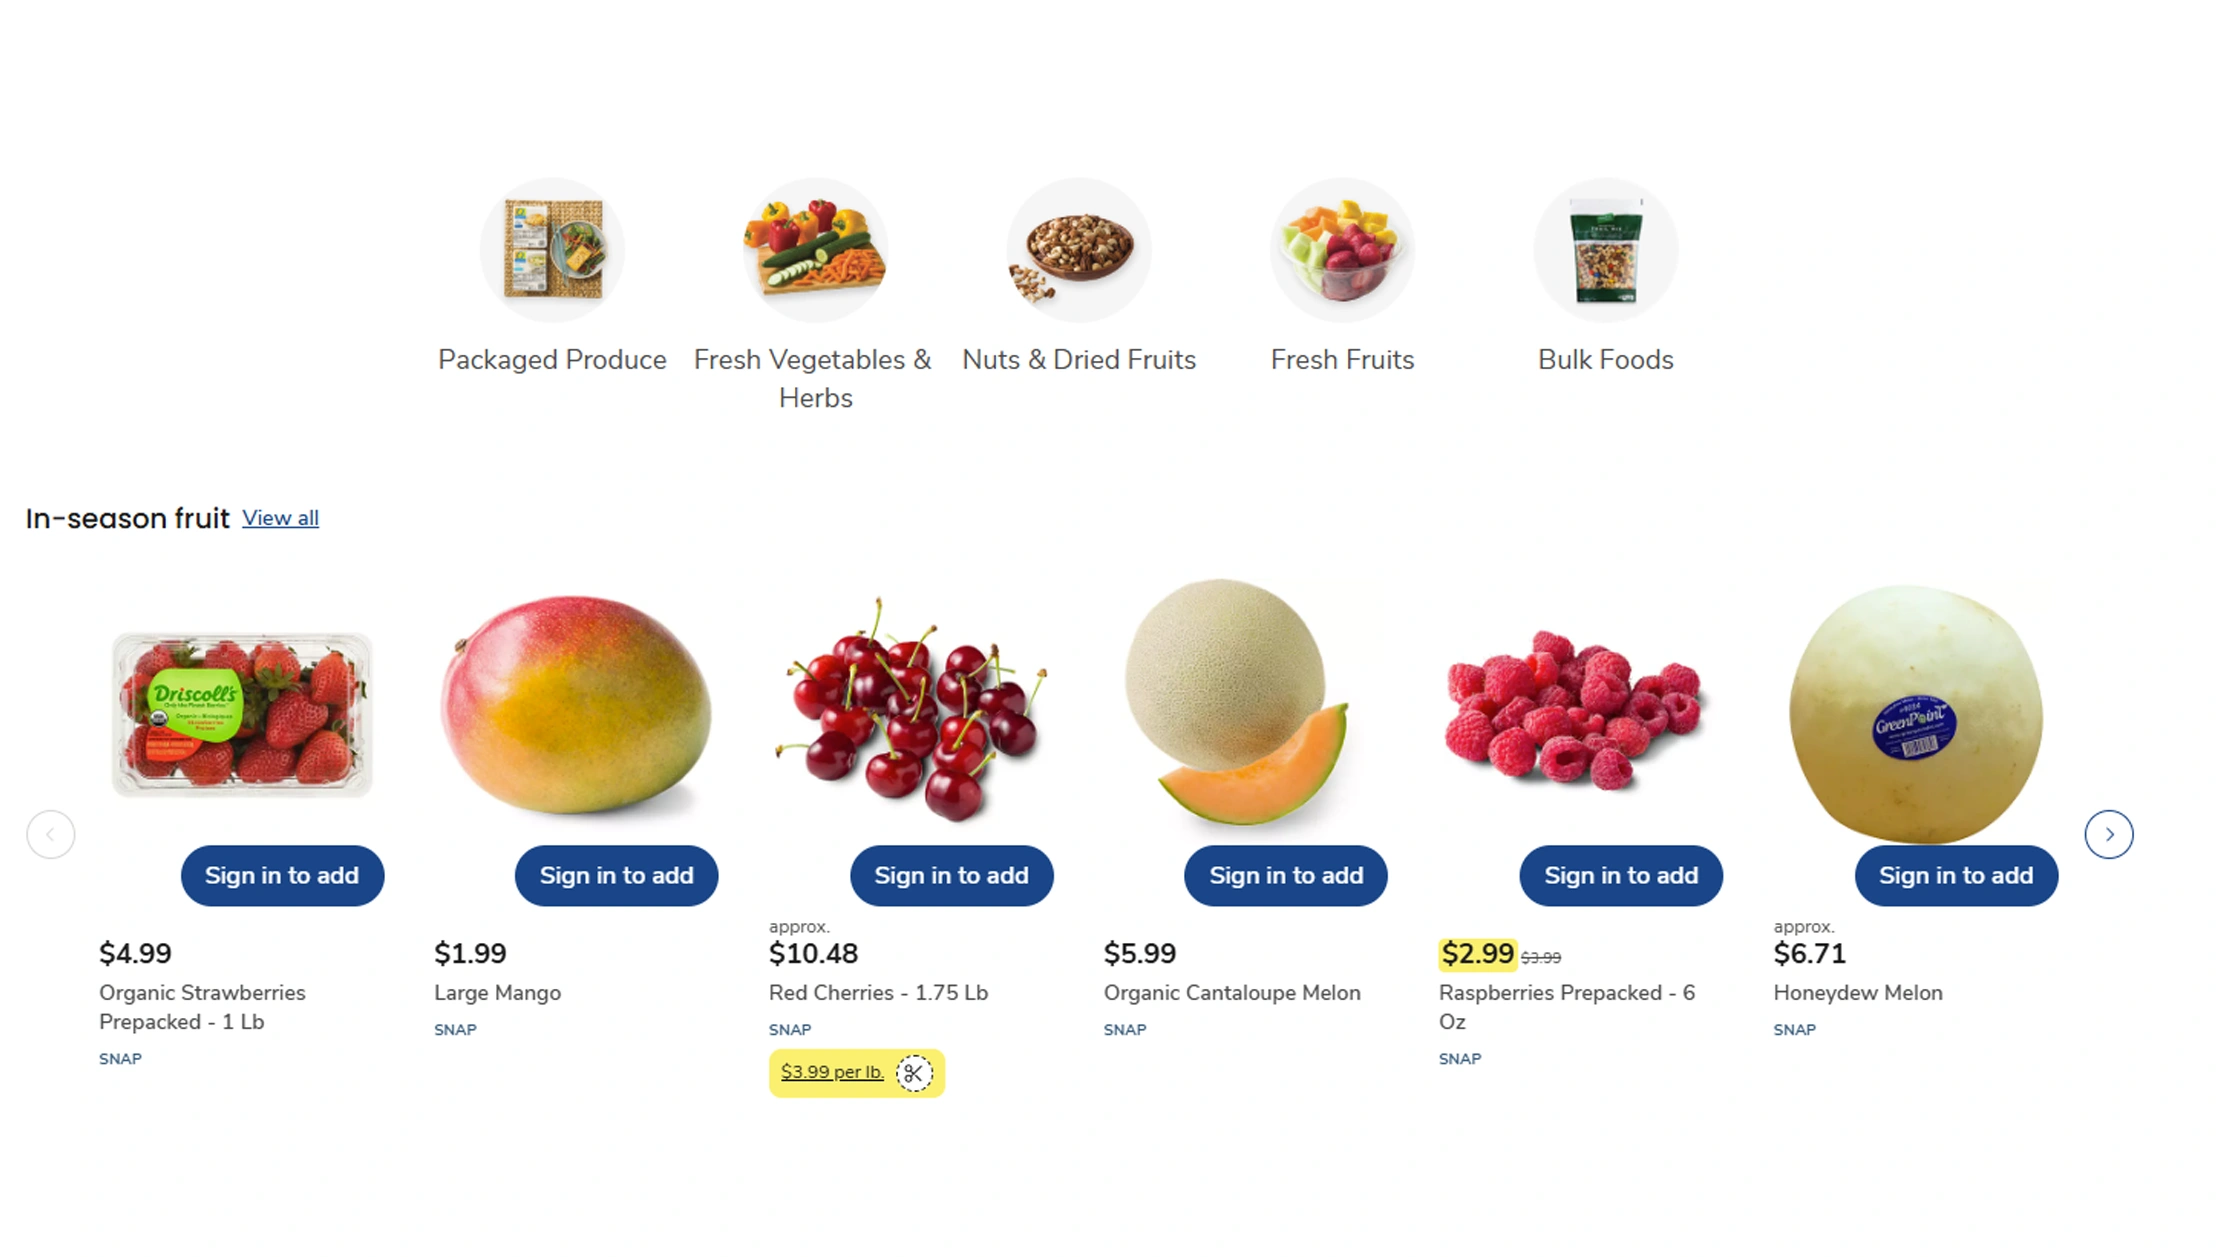
Grocery SKU data collection from Albertsons allows analysts to move from broad catalog observation toward detailed product-level intelligence. SKU-level information can provide the granularity required for price benchmarking, assortment comparison, promotion analysis, and inventory-related research.
A useful SKU dataset should distinguish products using stable identifiers whenever available. It should also retain attributes such as product title, brand, category, package size, flavor or variant, regular price, sale price, unit price, availability, promotion text, rating, review count, and timestamp. This structure allows businesses to analyze both individual products and groups of comparable products.
SKU-level datasets are especially useful when prices are affected by pack size. A $5.99 product may appear cheaper than a $6.49 competitor, but the comparison could reverse when calculated on a per-ounce or per-unit basis. Normalization therefore becomes an important stage in the data pipeline.
SKU Intelligence Framework, 2020-2026
| Period | Market Development | SKU-Level Research Value |
|---|---|---|
| 2020 | Strong digital shopping growth | Establish baseline product records |
| 2021 | Grocery demand remained elevated | Expand SKU coverage |
| 2022 | Retail sales increased | Improve price and assortment comparisons |
| 2023 | E-commerce reached 15.4% share | Increase online product monitoring |
| 2024 | E-commerce reached 16.1% share | Strengthen historical SKU tracking |
| 2025 | E-commerce reached 16.4% share | Scale automated datasets |
| 2026 Q1 | E-commerce reached 16.9% share | Support faster refresh cycles |
The Census Bureau reported grocery-store sales of $858.3 billion in 2022, up 8.2% from $793.4 billion in 2021. This growth highlights the commercial importance of detailed grocery-market information.
For category managers, SKU data can reveal assortment breadth and identify products that appear only at selected locations. For brands, it can provide evidence of pricing differences and promotional activity. For marketplaces and grocery applications, structured SKU information can support search, recommendation, comparison, and product discovery features.
Historical SKU records also make it possible to calculate metrics such as average price, median price, discount frequency, price volatility, availability rate, and assortment turnover. These metrics can be segmented by brand, category, store, geography, or time period.
The result is a dataset that does more than list products. It becomes a research layer for understanding how grocery assortments evolve and how product-level pricing changes influence competitive positioning.
4. Detecting Price Movements Before They Affect Competitive Positioning
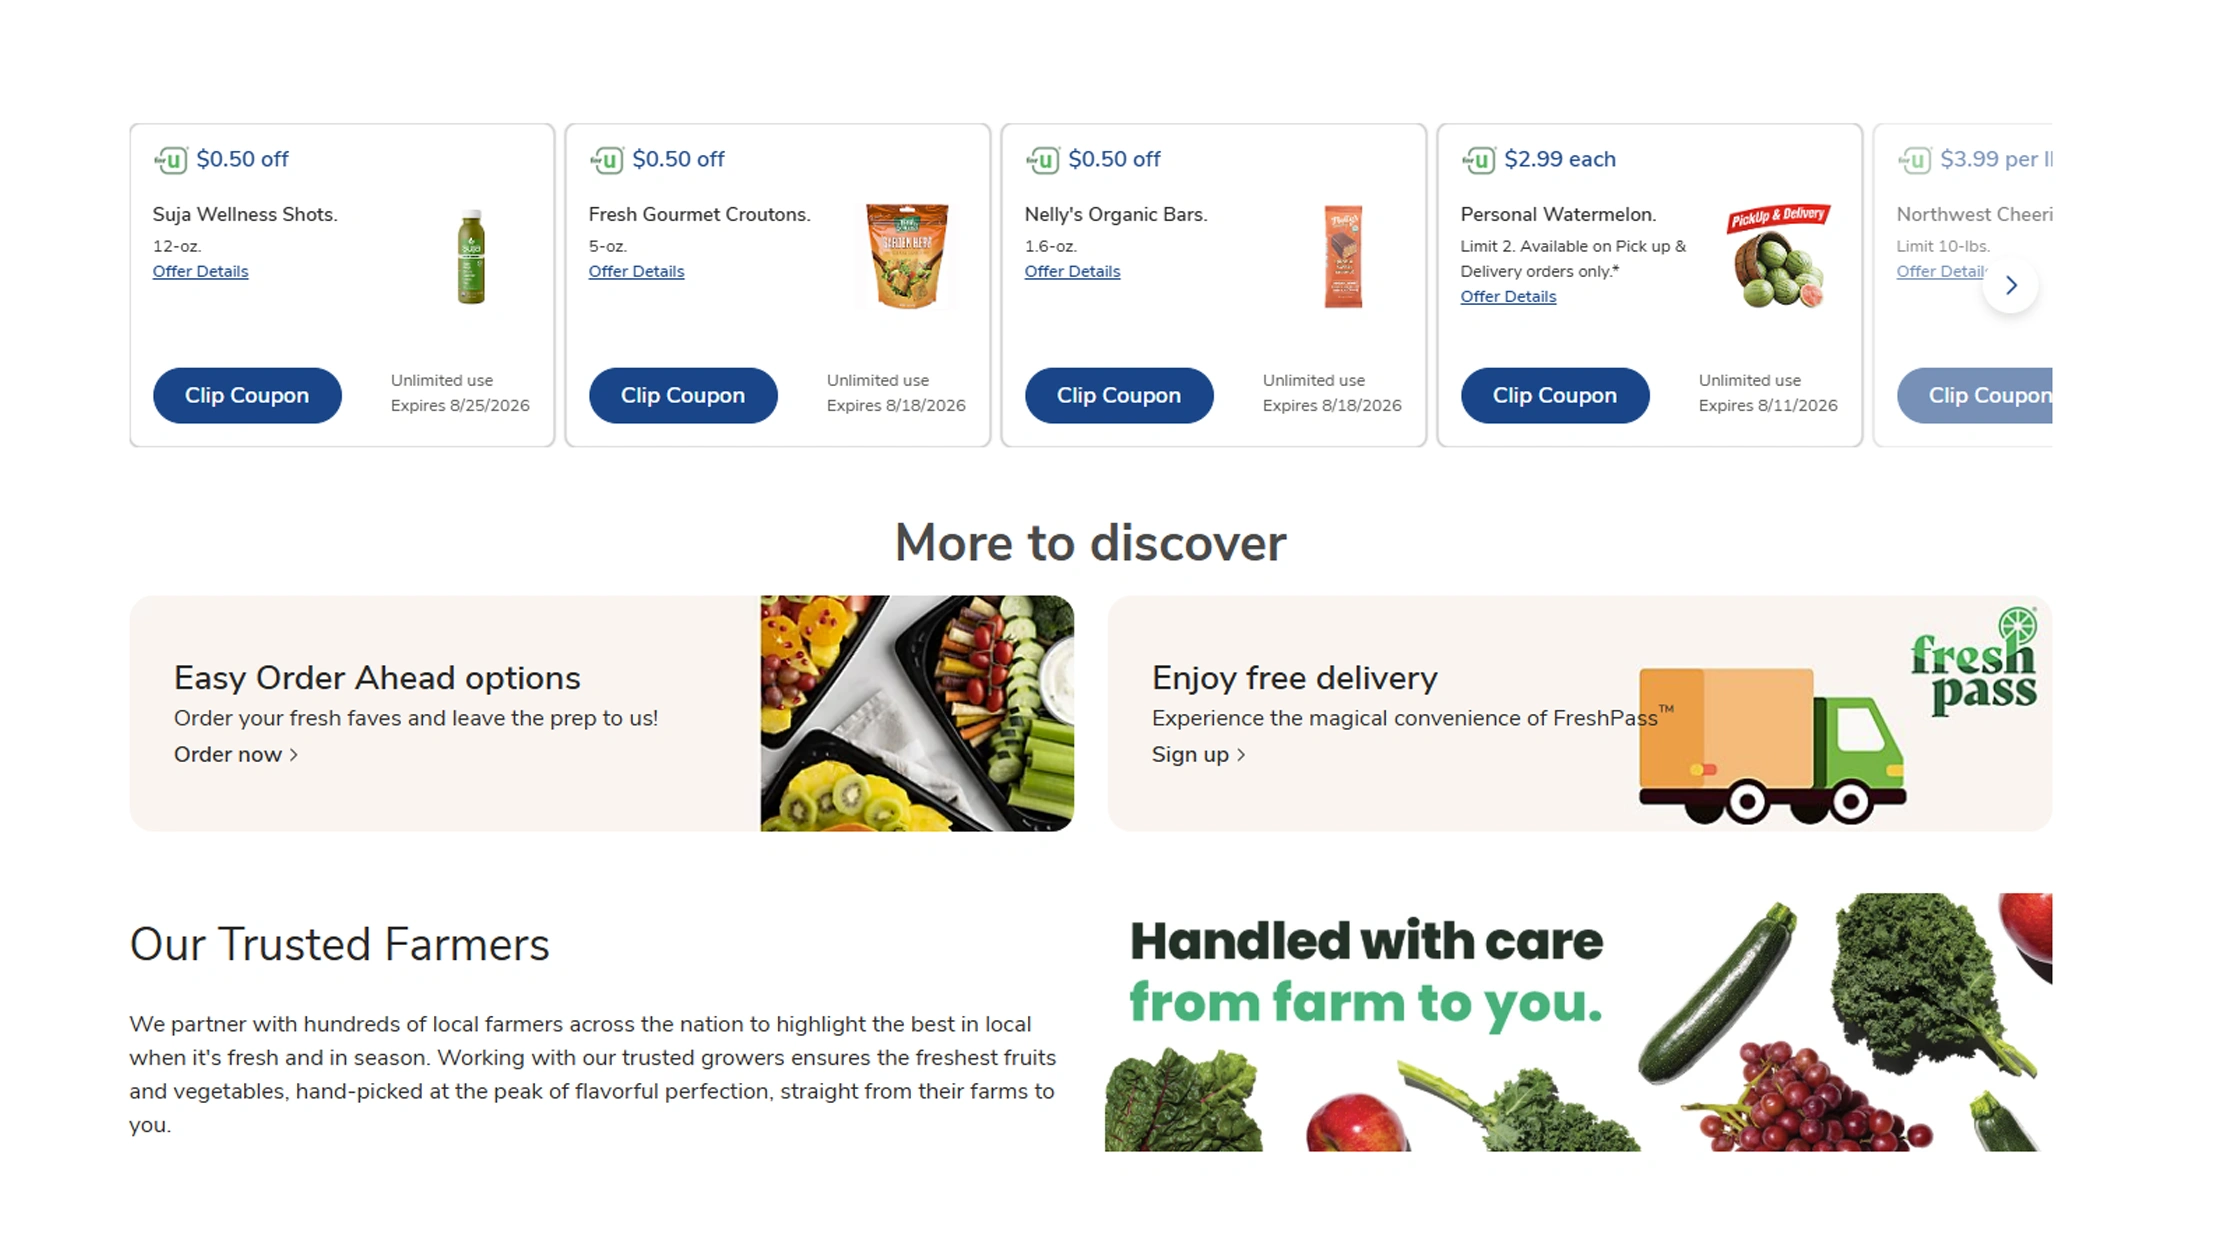
Monitor Albertsons grocery prices in real time is particularly valuable for businesses operating in highly competitive grocery categories. Prices can change because of promotions, supplier costs, seasonal demand, competitive activity, inventory conditions, or retailer pricing strategies. A periodic manual check may miss short-lived changes, whereas automated monitoring can create a timestamped record of price movements.
A real-time or near-real-time monitoring architecture typically captures product information at scheduled intervals and compares the latest snapshot with previous records. If a price changes, the system can calculate the absolute and percentage difference and assign an event such as price increase, price decrease, promotion started, promotion ended, or product unavailable.
Retail E-Commerce Growth and Price Monitoring Need
| Year | U.S. E-Commerce Share | Monitoring Priority |
|---|---|---|
| 2020 | 13.6% | Establish baseline |
| 2021 | 13.2% | Monitor digital price movements |
| 2022 | 14.6% | Expand category coverage |
| 2023 | 15.4% | Track promotional changes |
| 2024 | 16.1% | Increase refresh frequency |
| 2025 | 16.4% | Automate competitive monitoring |
| 2026 Q1 | 16.9% | Support near-real-time intelligence |
The Census Bureau estimates that Q1 2026 U.S. e-commerce sales reached $326.7 billion, 9.8% higher than Q1 2025, with e-commerce accounting for 16.9% of total retail sales. This continuing expansion increases the value of digital price intelligence.
For competitive pricing teams, monitored data can answer questions such as: Which products experienced the largest price changes? Which categories are most promotional? How frequently does a retailer discount private-label products? Which brands maintain stable pricing? How quickly does a promotion disappear?
Price monitoring can also support a Grocery Delivery Dashboard by providing the underlying product and pricing layer needed to display current market conditions. Dashboards can combine current price, previous price, discount percentage, availability, product category, brand, and timestamp into a single interface.
A mature workflow should also preserve historical snapshots rather than overwriting previous records. This makes it possible to distinguish temporary promotions from structural price changes and provides a reliable basis for trend analysis.
5. Developing a Reusable Dataset for Grocery Analytics
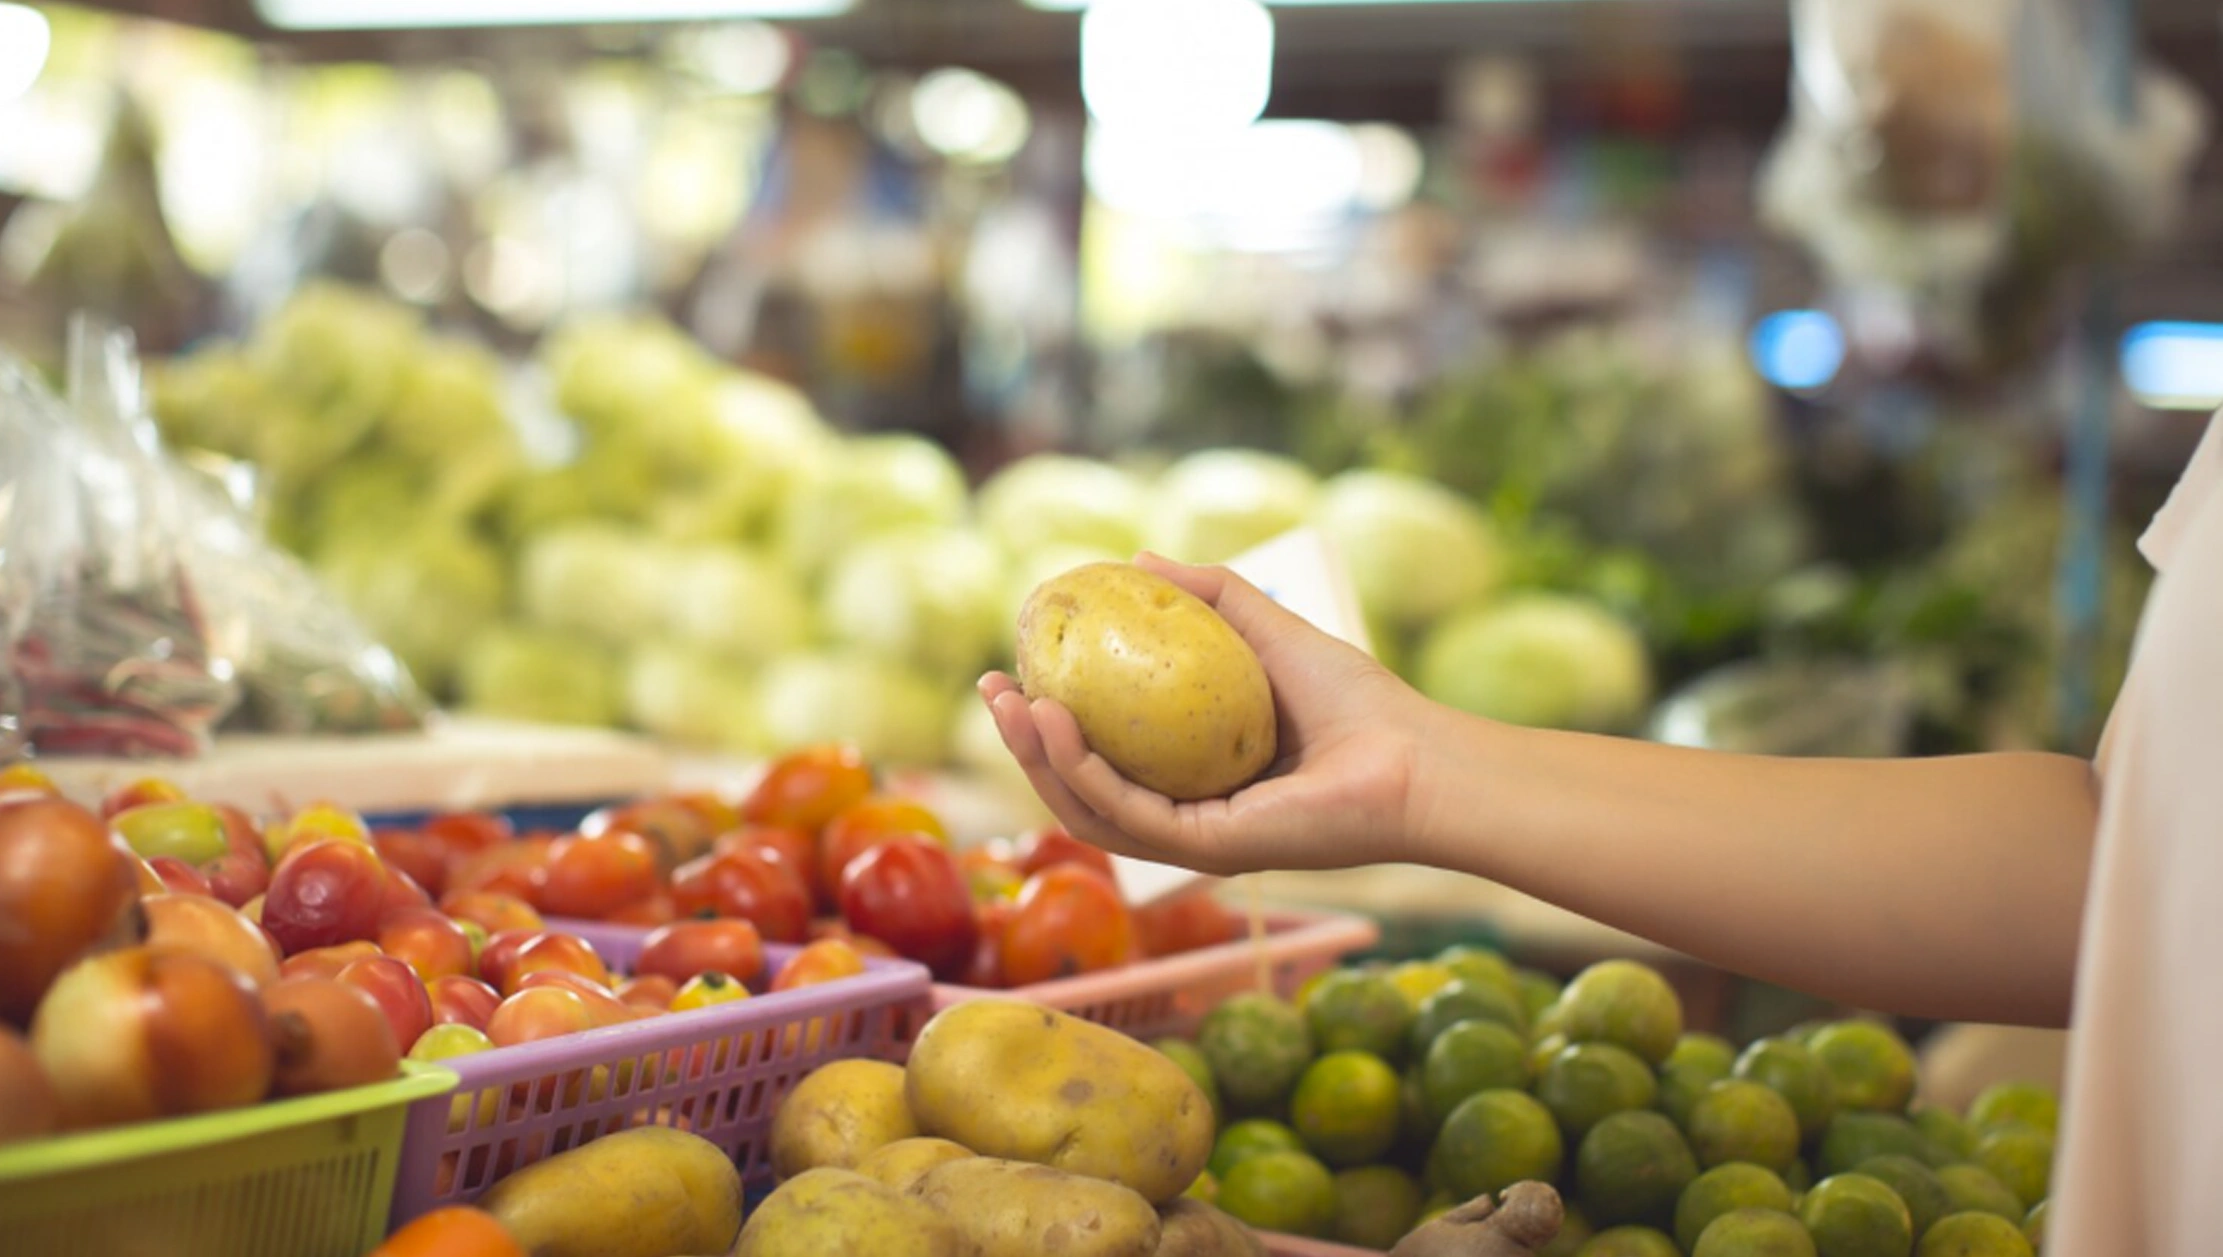
A Web Scraping Albertsons Dataset can serve as a centralized source for multiple analytical applications rather than being limited to one pricing project. Once product information is collected and normalized, businesses can reuse the dataset for assortment intelligence, promotional analysis, product matching, market research, and competitive benchmarking.
A high-quality dataset should include standardized fields and timestamps. Suggested fields include product ID, product title, brand, category, subcategory, package quantity, unit of measure, regular price, promotional price, unit price, availability, rating, review count, product image URL, product URL, store context, location context, and extraction timestamp.
Recommended Data Coverage by Year
| Year | Primary Data Objective | Example Output |
|---|---|---|
| 2020 | Historical baseline | Product and price reference |
| 2021 | Catalog expansion | Brand and category records |
| 2022 | Pricing intelligence | Promotion and unit-price analysis |
| 2023 | Digital comparison | Competitor and assortment datasets |
| 2024 | Historical monitoring | Price-change histories |
| 2025 | Automated intelligence | Large-scale refreshed datasets |
| 2026 | Near-real-time analytics | Current product and price feeds |
The broader retail data environment supports this approach. The Census Bureau's retail surveys cover sales, e-commerce, inventories, purchases, operating expenses, and gross margins, demonstrating the importance of structured retail data for economic and business analysis.
For data scientists, a reusable dataset can support machine-learning models for price prediction, product matching, demand signals, or promotional classification. For business teams, it can feed BI dashboards and scheduled reports. For technology companies, it can become an API-ready product intelligence layer.
Data quality is equally important. Duplicate SKUs, inconsistent package sizes, missing prices, stale availability values, and category mismatches can reduce the usefulness of the final dataset. Validation rules should therefore be applied after extraction. Product identifiers should be normalized, prices converted into consistent numeric formats, package quantities standardized, and timestamps retained.
The strongest datasets also preserve historical states. Rather than replacing yesterday's record with today's value, the system should retain both. This creates a longitudinal dataset capable of showing how products and prices evolve over months and years.
6. Addressing Geographic and International Grocery Research Requirements
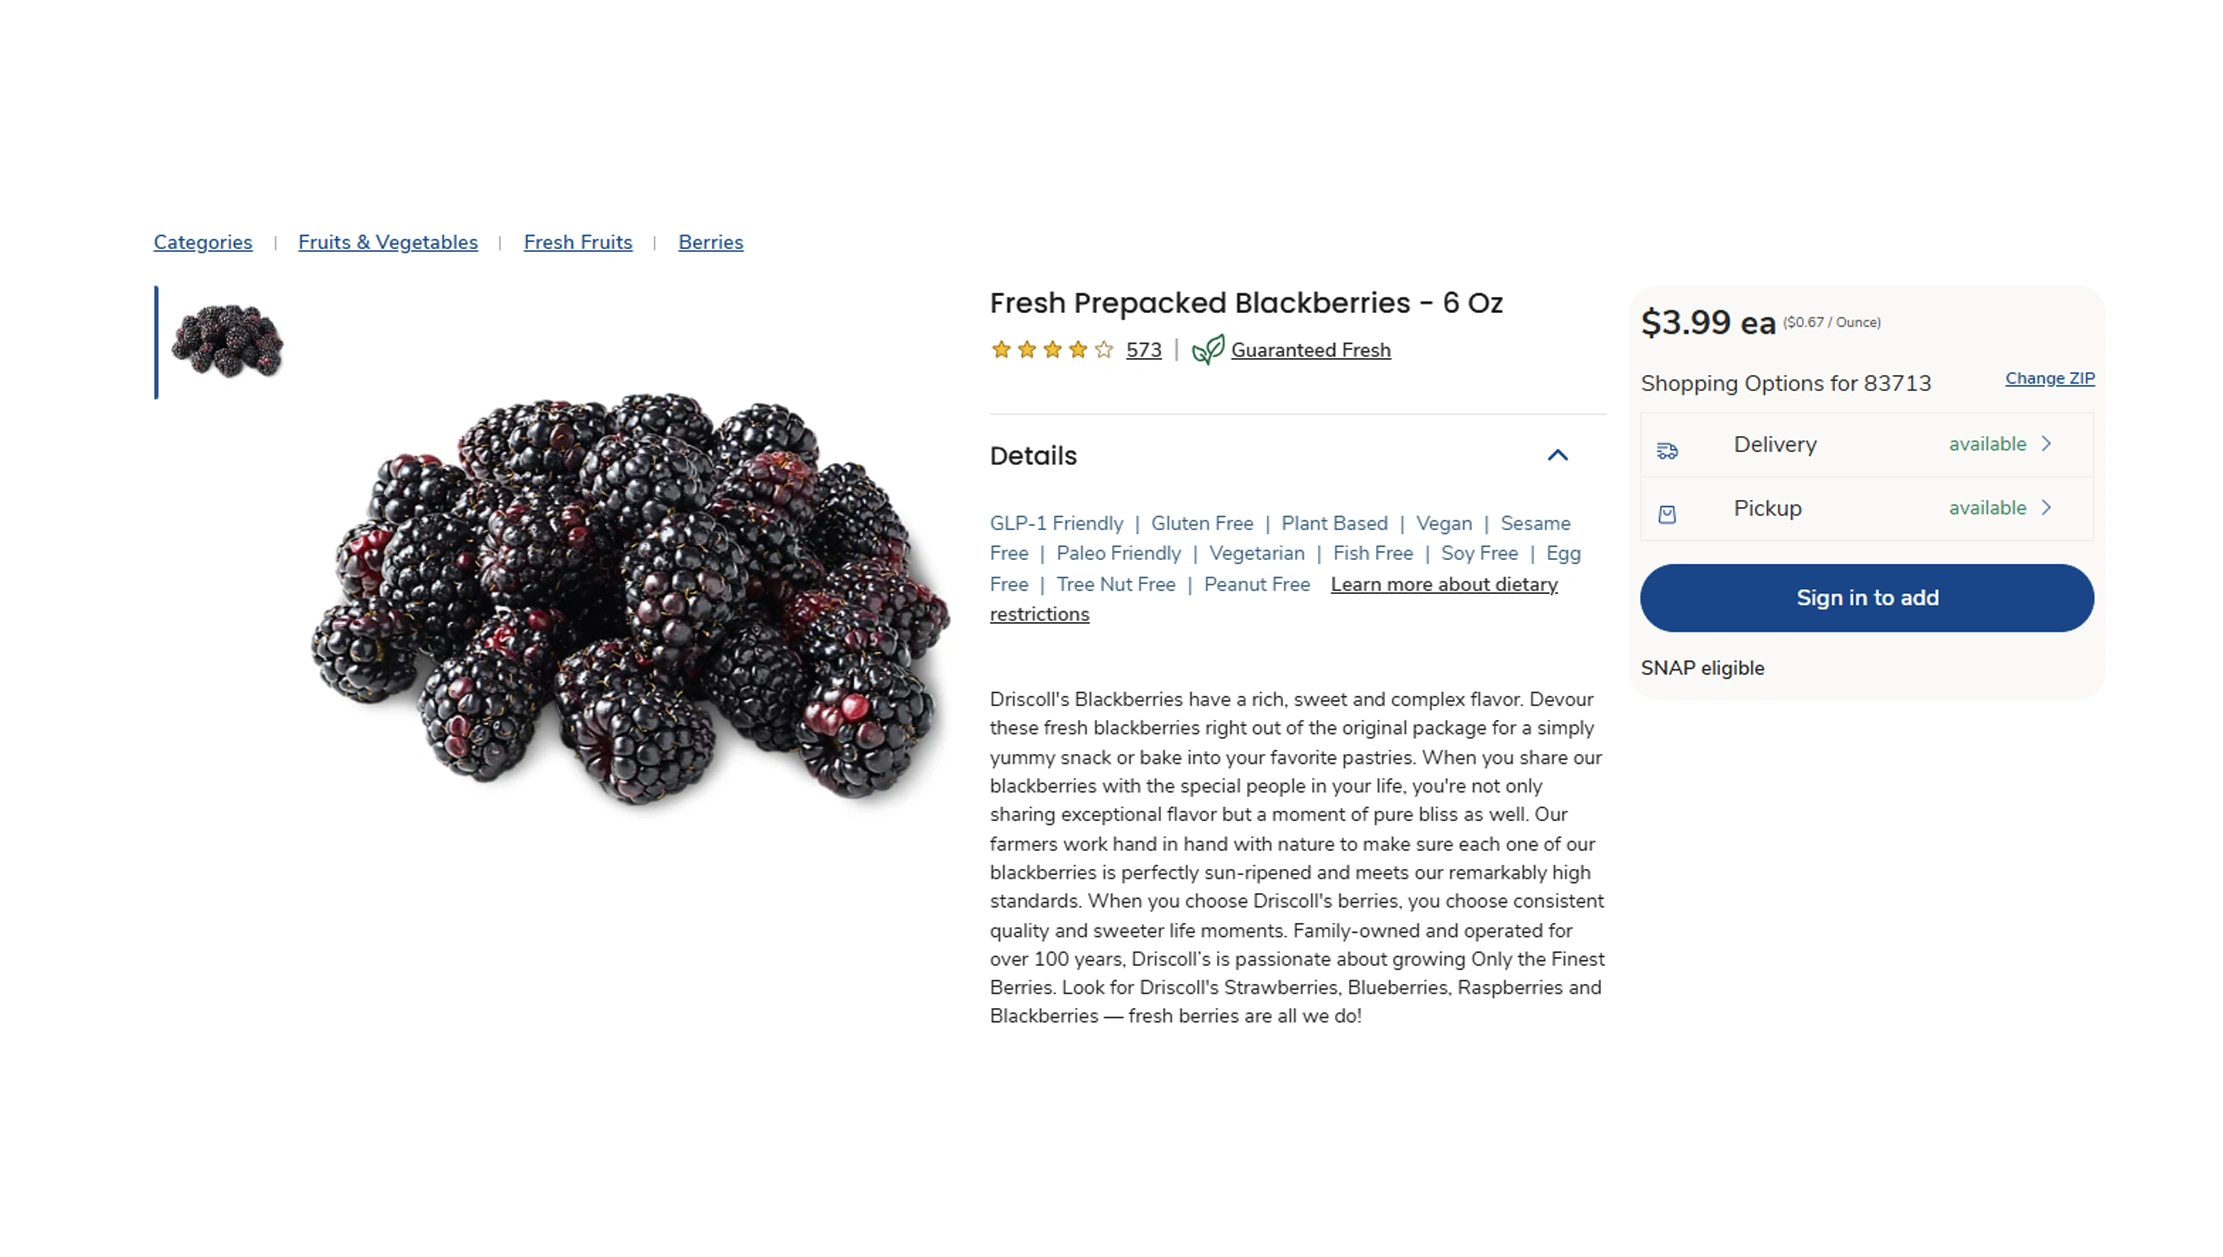
The keyword Scrape Grocery Prices from Albertsons UK can be relevant to search strategies targeting international grocery-price research, but it requires an important geographic clarification: Albertsons Companies is a U.S.-focused grocery operator, and its public business information describes a nationwide U.S. store footprint. Therefore, the phrase should not be interpreted as evidence that Albertsons operates a UK grocery chain. For research teams using this phrase as a search or content term, the underlying methodology is better understood as a grocery-price extraction framework that can be adapted to other regional retailers.
The same data architecture can be applied across markets when the target retailer has an accessible online catalog. A regional implementation can capture product identifiers, names, brands, categories, package sizes, prices, promotions, availability, location information, and timestamps.
Seven-Year Retail Data Perspective
| Year | Digital Retail Indicator | Strategic Data Focus |
|---|---|---|
| 2020 | E-commerce share: 13.6% | Build digital baselines |
| 2021 | E-commerce share: 13.2% | Expand online coverage |
| 2022 | E-commerce share: 14.6% | Strengthen price intelligence |
| 2023 | E-commerce share: 15.4% | Improve product comparison |
| 2024 | E-commerce share: 16.1% | Expand automated monitoring |
| 2025 | E-commerce share: 16.4% | Scale structured datasets |
| 2026 Q1 | E-commerce share: 16.9% | Enable faster market updates |
These figures show why grocery data infrastructure increasingly needs to support digital-first research.
For international research, localization is critical. Currency, measurement units, taxation, product naming, regional packaging, promotions, and availability rules may differ substantially between markets. A robust extraction architecture should therefore separate retailer-specific extraction logic from common data-normalization rules.
This makes it possible to create a reusable grocery intelligence platform. The same pipeline can collect information from multiple retailers, map products into common categories, normalize prices, and generate comparable datasets. Analysts can then examine price differences, assortment gaps, promotional intensity, and availability patterns across markets.
The key objective is not simply collecting more records. It is creating consistent, timestamped, validated data that can be used repeatedly for business decisions.
Why Choose Real Data API?
Real Data API provides a scalable approach for organizations that need structured web data without building and maintaining every component of a data collection infrastructure internally. Its approach can support automated extraction, structured output, recurring collection, and integration with downstream analytics systems.
For grocery intelligence projects, the Grocery Delivery Dashboard can be powered by structured product, price, availability, and promotion records, enabling teams to monitor market conditions from a centralized interface. Historical records can also support trend analysis and price-change reporting.
The Albertsons grocery product data extraction guide demonstrates how retailer-level product information can become a foundation for competitive intelligence. Instead of treating scraped information as a one-time file, businesses can transform it into a recurring data feed for dashboards, analytics applications, market research, and pricing workflows.
A reliable API-based approach can also reduce repetitive manual collection. Data can be standardized into predictable fields, refreshed according to business requirements, and delivered in formats suitable for databases, analytics tools, applications, and internal reporting systems.
For organizations comparing multiple retailers, the same infrastructure can be extended to additional grocery websites and product categories. This creates a broader retail intelligence environment where product, pricing, promotion, and availability information can be analyzed consistently.
Conclusion
Digital grocery commerce has transformed product information into an important business intelligence asset. From price changes and promotional activity to assortment shifts and availability patterns, timely product data can help retailers, brands, marketplaces, and researchers make better decisions.
The Albertsons grocery product data extraction guide provides a practical framework for converting grocery catalog information into structured, historical, and analysis-ready datasets. By combining product extraction, SKU normalization, price monitoring, availability tracking, and historical snapshots, businesses can move beyond manual research and establish repeatable data-driven workflows.
The broader market trend supports this transition. U.S. e-commerce accounted for 16.4% of total retail sales in 2025 and reached 16.9% in Q1 2026, demonstrating the continuing importance of digital retail channels.
Ready to turn grocery product data into actionable pricing and competitive intelligence? Contact Real Data API to build a scalable, automated data extraction solution tailored to your retail analytics requirements!
Latest posts
How Ixigo API Helps Businesses Solve Flight, Train, Hotel, Travel, and Pricing Data Challenges

How to Extract Restaurants, Menus, Prices, Ratings, and Business Data for Market Insights
How Brands Track Restaurant, Menu, Pricing, Rating, and Delivery Data for Competitive Intelligence

How Retailers Track Fashion Products, Prices, Brands, and Category Data for Competitive Intelligence Using AJIO API






.png)



