
Quick Summary
- DoorDash API enables brands to organize restaurant, menu, pricing, rating, and delivery information into structured datasets for competitive intelligence and market monitoring.
- DoorDash Scraper supports recurring collection of marketplace information, helping teams identify menu changes, price movements, restaurant availability, ratings, and delivery patterns.
- The approach helps food-tech companies, restaurant groups, aggregators, and analytics teams turn fragmented marketplace signals into actionable competitive insights.
Introduction
Brands can strengthen food-delivery competitive intelligence by combining structured restaurant, menu, pricing, rating, and delivery information into a repeatable data workflow. A DoorDash API approach can help businesses organize marketplace signals, compare competitors, identify pricing changes, and monitor restaurant-level trends without relying on disconnected manual checks.
A scalable DoorDash Scraper workflow can collect relevant marketplace attributes at recurring intervals and transform them into standardized datasets. This is particularly valuable for restaurant groups, food-tech companies, market researchers, delivery platforms, pricing teams, and investors that need location-specific intelligence.
The scale of DoorDash's marketplace demonstrates why structured monitoring matters. DoorDash reported 816 million total orders in 2020 and 3.172 billion in 2025, while Marketplace GOV increased from $24.7 billion in 2020 to $102.0 billion in 2025. These figures show how substantially the marketplace expanded during the period. (SEC)
For businesses, the practical question is not simply how many restaurants are listed. The larger opportunity is understanding how menus, prices, ratings, availability, delivery conditions, promotions, and competitive positioning change over time.
How Can Brands Build a Reliable Restaurant Intelligence Layer?
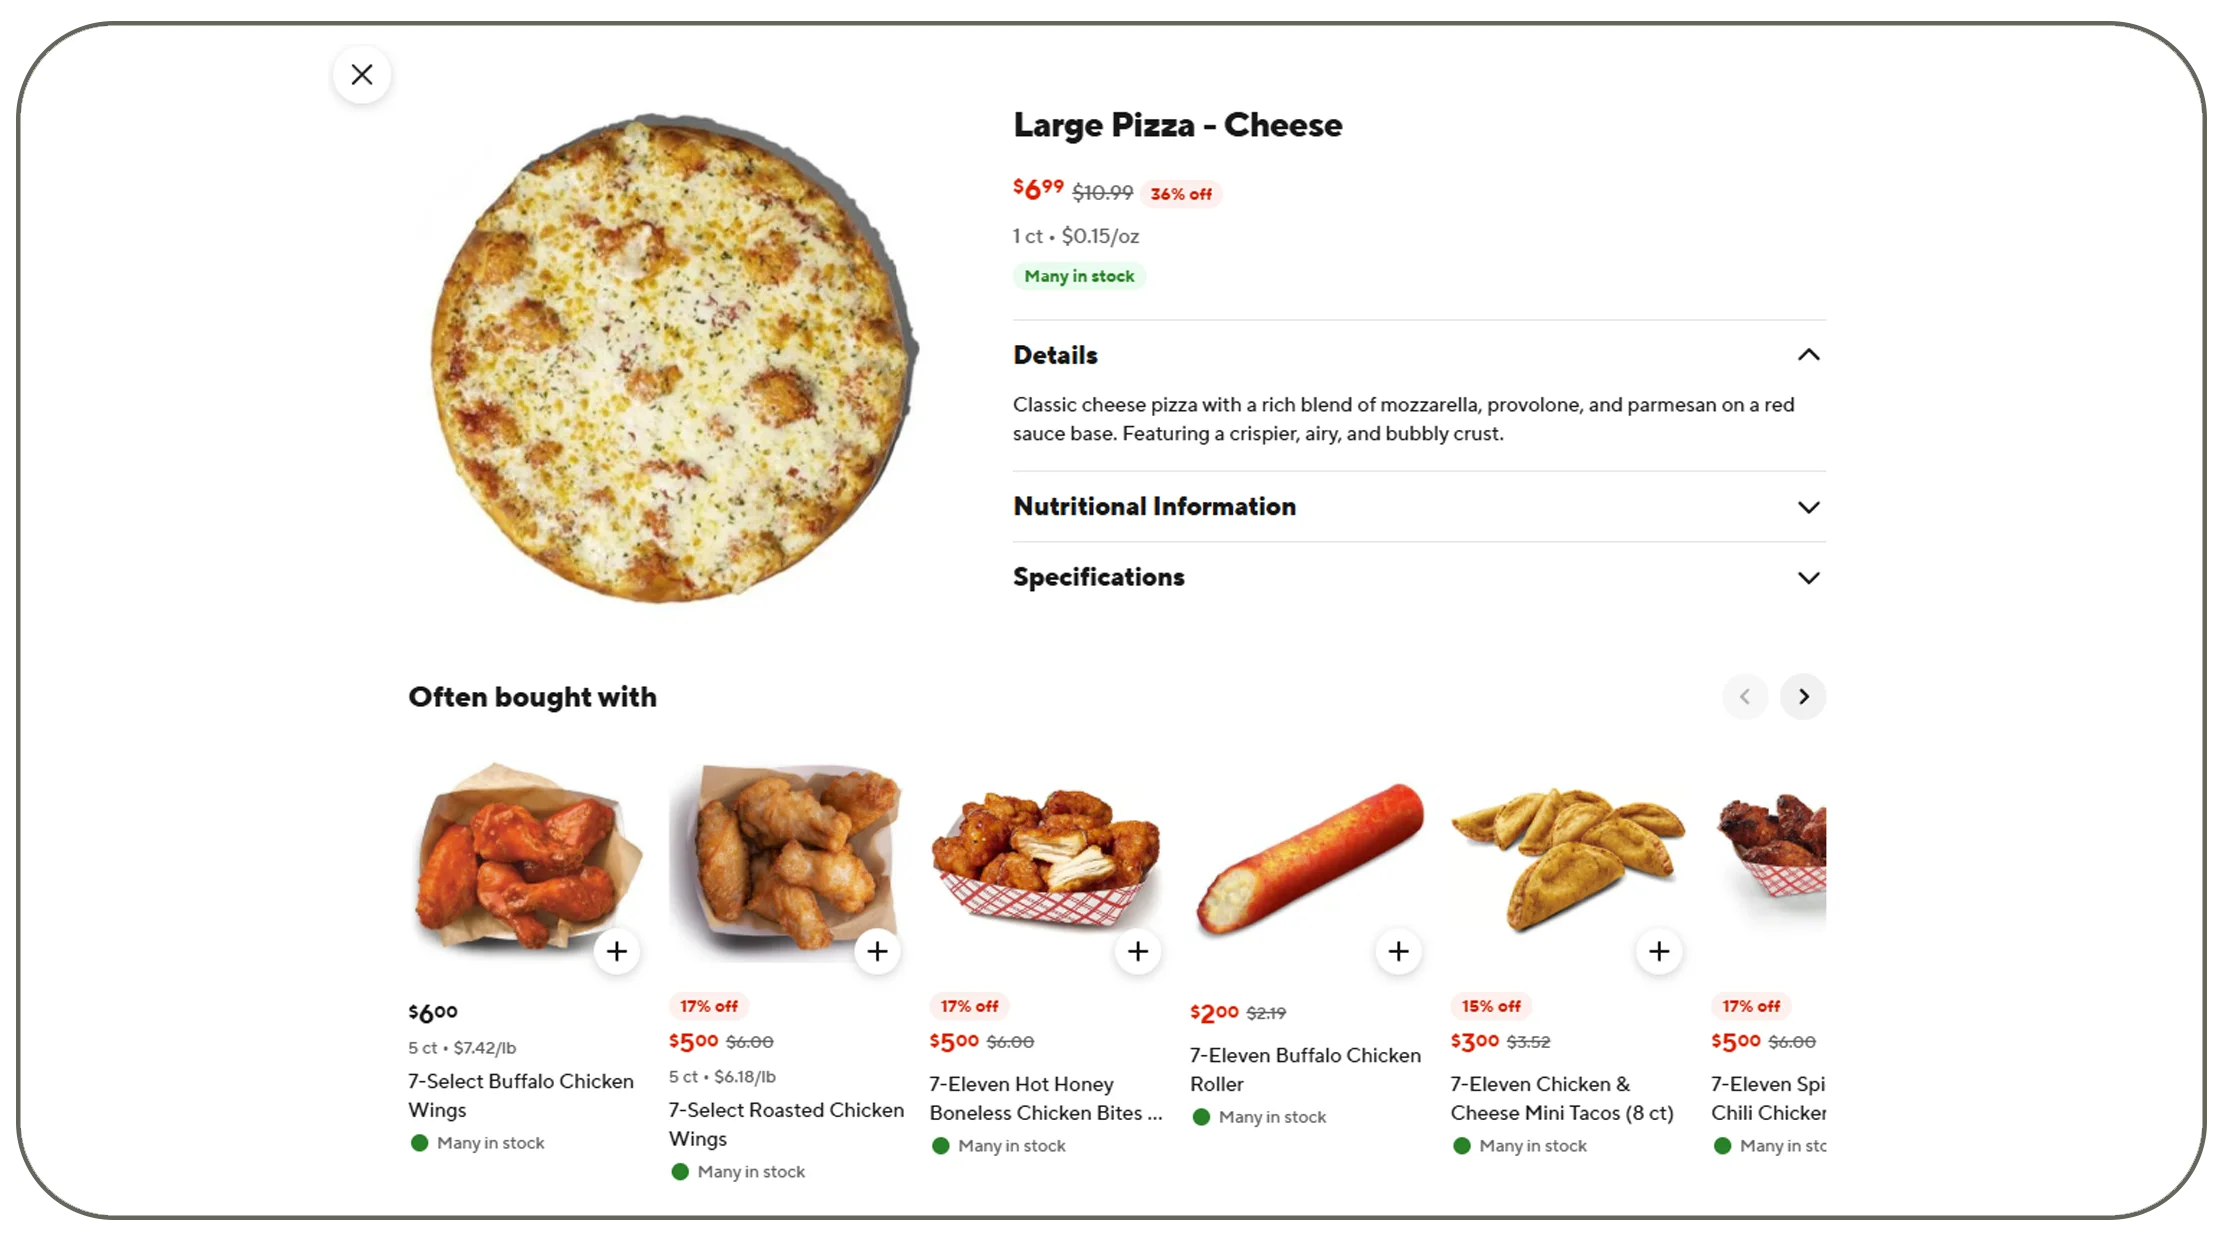
Restaurant intelligence starts with consistent information about individual establishments. DoorDash restaurant data web scraping can help businesses organize restaurant names, cuisines, locations, menu structures, item availability, ratings, delivery information, promotional signals, and other publicly accessible attributes into a standardized dataset.
| Intelligence Area | Useful Data Points | Business Application |
|---|---|---|
| Restaurant | Name, location, cuisine | Market mapping |
| Menu | Item, category, description | Assortment analysis |
| Availability | Available/unavailable | Supply monitoring |
| Ratings | Rating and review volume | Reputation benchmarking |
| Delivery | ETA, delivery availability | Service comparison |
A useful restaurant dataset should maintain a stable restaurant identifier wherever possible. This allows analysts to distinguish between genuine restaurant changes and changes caused by URL structures, category placement, or location-specific listings.
From 2020 to 2022, delivery-market intelligence became increasingly important as consumer ordering behavior expanded and DoorDash's annual orders rose from 816 million in 2020 to 1.39 billion in 2021 and 1.736 billion in 2022. In 2023, annual orders reached 2.161 billion, followed by 2.583 billion in 2024 and 3.172 billion in 2025. (SEC)
For 2026 planning, businesses can use historical observations to create restaurant-level trend models. For example, an analytics team can compare the same restaurant across locations, identify menu expansion, detect changes in availability, and calculate how often competitive information changes.
The most useful workflow therefore combines collection, normalization, validation, historical storage, and analytics rather than treating extraction as a one-time activity.
How Can Businesses Detect Competitive Price Movements?
Pricing intelligence becomes more useful when businesses can compare similar products across restaurants, locations, categories, and time periods. DoorDash pricing data scraping can support structured monitoring of item prices, promotional prices, delivery charges, service-related fees where accessible, and other visible pricing attributes.
| Pricing Metric | Monitoring Frequency | Example Insight |
|---|---|---|
| Menu item price | Daily/hourly | Detect price changes |
| Promotional price | Recurring | Measure discount activity |
| Delivery charge | Location-based | Compare delivery economics |
| Minimum order | Recurring | Identify purchasing thresholds |
| Price history | Longitudinal | Calculate price volatility |
Price monitoring should not focus only on absolute values. A better analytical model considers the same product or comparable product across different restaurants and locations. This makes it possible to calculate price gaps, median category prices, discount frequency, and changes in competitive positioning.
The 2020–2026 period illustrates the increasing scale of the underlying marketplace. DoorDash's Marketplace GOV rose from $24.664 billion in 2020 to $41.944 billion in 2021, $53.414 billion in 2022, $66.771 billion in 2023, $80.231 billion in 2024, and $102.018 billion in 2025. (SEC)
For 2026, pricing teams can move beyond simple snapshots and create historical price panels. These panels can identify recurring promotional periods, sudden increases, competitive price compression, and differences between metropolitan markets.
For restaurant chains, this information can support localized pricing reviews. For food-tech businesses, it can support market benchmarking. For investors and researchers, longitudinal pricing datasets can provide evidence for studying consumer-facing marketplace dynamics.
The key is to capture the same fields consistently so that price changes can be analyzed rather than merely observed.
How Can Brands Monitor Customer Ratings More Effectively?
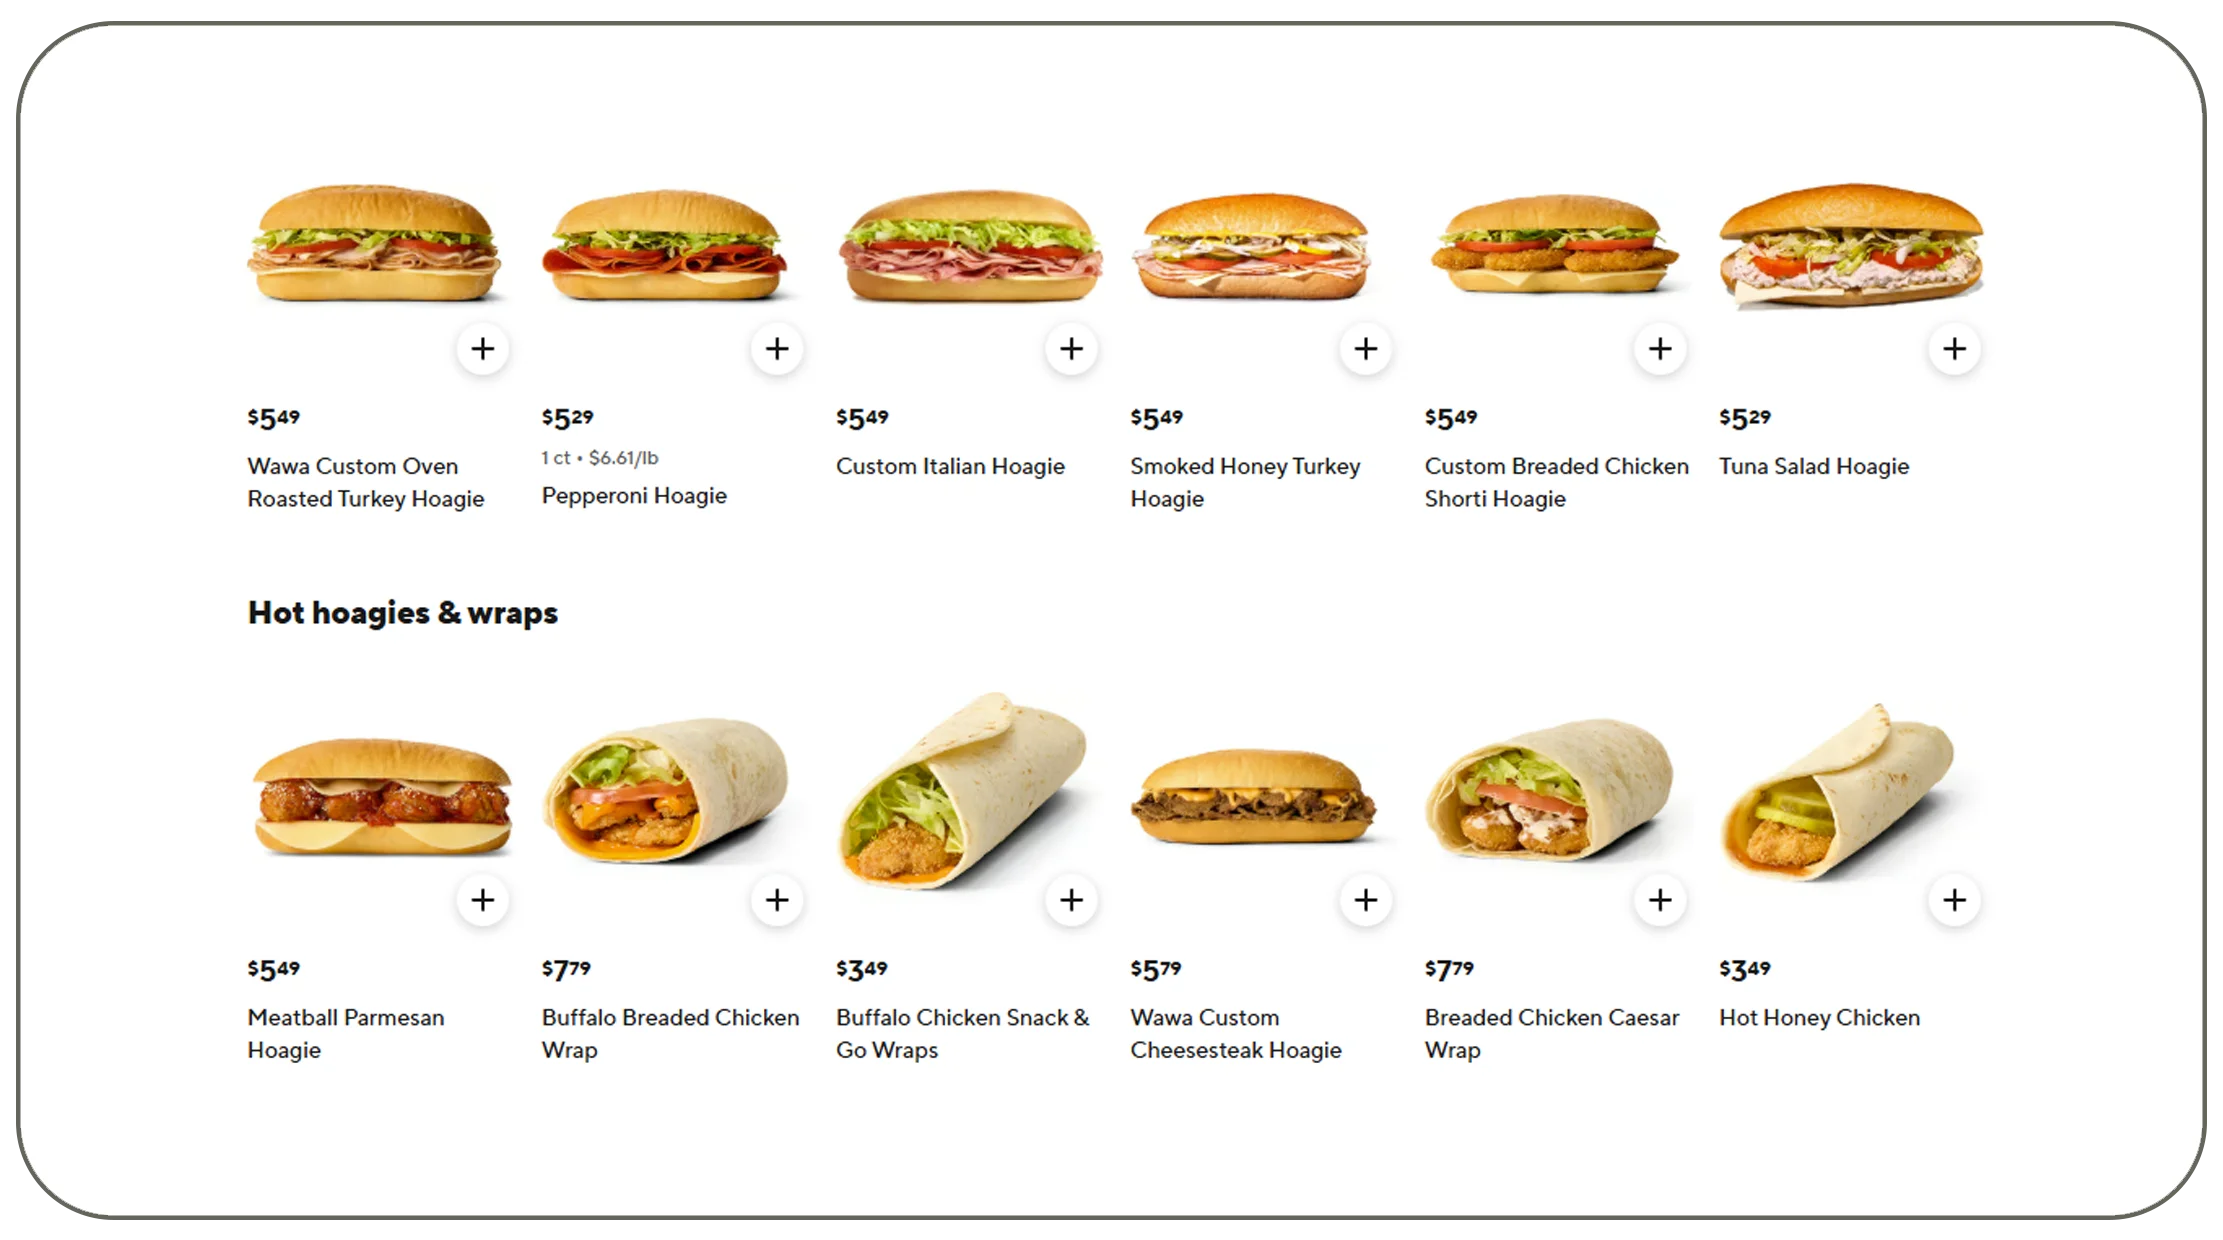
Ratings are an important part of restaurant marketplace intelligence because they provide a measurable signal of customer perception. A real-time DoorDash rating data API workflow can help businesses organize rating information alongside restaurant, location, menu, and availability attributes.
| Rating Signal | What It Can Reveal | Potential Use |
|---|---|---|
| Average rating | Overall customer perception | Benchmarking |
| Review volume | Engagement level | Restaurant comparison |
| Rating movement | Reputation changes | Early-warning monitoring |
| Location-level rating | Local performance | Regional analysis |
| Historical rating | Long-term trend | Performance tracking |
Rating intelligence becomes more valuable when it is historical. A restaurant moving from a high rating to a lower rating over several collection periods may warrant investigation. Analysts can then compare that movement with menu changes, availability problems, delivery conditions, or promotional activity.
DoorDash's marketplace scale makes such monitoring increasingly relevant. The company reported 42 million monthly active users in December 2024 and more than 56 million monthly active users at the end of 2025 across its marketplace businesses. (SEC)
From 2020 through 2022, the delivery ecosystem experienced rapid consumer adoption. Between 2023 and 2024, DoorDash continued expanding order volume, reaching 2.583 billion annual orders in 2024. In 2025, annual orders reached 3.172 billion. (SEC)
In 2026, companies can combine rating history with operational indicators to identify patterns. For example, analysts can flag restaurants where ratings decline while delivery estimates increase or menu availability falls.
This creates a broader customer-experience intelligence framework rather than treating ratings as an isolated metric.
Build a structured DoorDash restaurant, pricing, rating, and delivery intelligence workflow with Real Data API to turn recurring marketplace data into actionable competitive insights!
How Can Companies Turn Rating Signals Into Competitive Insights?
Businesses often collect ratings but fail to convert them into useful historical intelligence. scrape DoorDash rating data workflows can address this gap by capturing rating-related attributes at consistent intervals and linking them to restaurant identifiers.
A useful dataset can include restaurant name, location, cuisine, current rating, rating changes, review count, menu attributes, and collection timestamp. The timestamp is particularly important because it allows businesses to measure changes rather than simply store the latest value.
| Analysis | Dataset Requirement | Output |
|---|---|---|
| Rating trend | Historical ratings | Trend line |
| Restaurant comparison | Standardized records | Benchmark |
| Market comparison | Location field | Regional ranking* |
| Reputation alerts | Change thresholds | Monitoring signal |
| Category analysis | Cuisine/category | Segment insight |
*Ranking here refers to an analytical ordering of dataset observations, not an overall judgment about political or public figures.
From 2020 to 2022, the marketplace experienced rapid expansion, with DoorDash's annual orders more than doubling from 816 million to 1.736 billion. In 2023 and 2024, orders continued increasing to 2.161 billion and 2.583 billion respectively. By 2025, the company reported 3.172 billion total orders. (SEC)
The 2020–2026 period therefore provides an increasingly large environment for longitudinal analysis. Businesses can use historical rating records to establish baselines for different cuisines, locations, restaurant groups, and price bands.
For example, an analytics team could calculate the percentage of restaurants whose ratings changed during a month, identify locations with the highest rating volatility, or examine whether certain menu categories experience more frequent reputation changes.
The strongest workflow links ratings to other marketplace variables. A rating change becomes considerably more actionable when analysts can also examine menu modifications, price changes, delivery estimates, or availability during the same period.
How Can an API-Based Workflow Support Marketplace Intelligence?
A DoorDash API workflow can provide a structured foundation for businesses that need recurring marketplace intelligence across restaurants, menus, pricing, ratings, and delivery attributes.
| Workflow Stage | Function | Business Benefit |
|---|---|---|
| Discovery | Identify target restaurants/locations | Defined monitoring universe |
| Collection | Gather relevant attributes | Consistent data capture |
| Normalization | Standardize fields | Cross-source analysis |
| Validation | Check missing or abnormal records | Better data quality |
| Storage | Maintain historical records | Trend analysis |
| Delivery | Provide analytics-ready output | Faster decision-making |
The importance of scalable infrastructure is illustrated by DoorDash's marketplace growth. Total annual orders increased from 816 million in 2020 to 3.172 billion in 2025, while Marketplace GOV grew from $24.664 billion to $102.018 billion during the same period. (SEC)
In 2020–2021, businesses could focus primarily on establishing basic marketplace visibility. During 2022–2023, larger datasets created more opportunities for category and geographic comparisons. In 2024–2025, the continued growth of orders and Marketplace GOV increased the value of automated monitoring. For 2026, the next step is to use historical datasets for anomaly detection, forecasting, competitive benchmarking, and automated alerts.
An API-oriented architecture can also help separate data collection from downstream analytics. Raw records can be validated and transformed before being delivered to dashboards, databases, business-intelligence platforms, or machine-learning pipelines.
For restaurant groups, this can support competitor monitoring across selected markets. For food-delivery analysts, it can support market research. For enterprise data teams, it can create repeatable pipelines that reduce dependence on manual spreadsheet collection.
How Can a Structured Food Dataset Improve Business Decisions?
A DoorDash Food Dataset can bring restaurant, menu, pricing, rating, and delivery attributes together in a format suitable for analysis. Instead of examining marketplace pages individually, teams can query structured records based on restaurant, cuisine, location, product, price, rating, or timestamp.
| Dataset Layer | Example Fields | Analytical Purpose |
|---|---|---|
| Restaurant | Name, cuisine, location | Market mapping |
| Menu | Item, category, description | Assortment intelligence |
| Price | Current price, promotional price | Price benchmarking |
| Rating | Rating, review count | Reputation analysis |
| Delivery | ETA, delivery availability | Service comparison |
| Time | Collection timestamp | Historical analysis |
DoorDash's reported marketplace metrics provide useful context for why structured food data can become increasingly valuable. Total orders grew from 816 million in 2020 to 1.39 billion in 2021 and 1.736 billion in 2022. They then increased to 2.161 billion in 2023, 2.583 billion in 2024, and 3.172 billion in 2025. (SEC)
The 2020–2026 progression also changes the analytical requirements. Early datasets may have focused on restaurant discovery and basic pricing. Later datasets can incorporate historical menu changes, location-level comparisons, ratings, delivery signals, and promotional activity.
For 2026, businesses can create a unified data model where each restaurant is connected to multiple observations over time. This makes it easier to calculate average menu prices, identify newly listed items, monitor assortment churn, measure rating movement, and compare delivery conditions.
A structured dataset can also support natural-language analytics. For example, an internal system could answer questions such as which restaurant categories experienced the largest price changes, where delivery availability changed most frequently, or which competitors expanded their menus.
Why Choose Real Data API?
For businesses that need recurring marketplace intelligence, the value of an API provider extends beyond extraction. The workflow should support structured delivery, scalable collection, data normalization, validation, and integration with downstream analytics systems.
Food Data Scraping API solutions can help businesses create reusable pipelines for restaurant and food-market intelligence. Instead of collecting isolated snapshots, organizations can establish recurring datasets that support historical comparisons and automated analysis.
A practical workflow can include:
- Restaurant and location discovery
- Menu and category extraction
- Product-level price monitoring
- Rating and review signal collection
- Delivery and availability monitoring
- Data normalization and validation
- Historical dataset creation
- API or structured file delivery
- Integration with BI and analytics platforms
This approach is particularly relevant to restaurant groups, food-delivery analysts, market researchers, pricing teams, aggregators, and data-driven investors.
Real Data API can also help organizations design workflows around specific geographic markets, restaurant categories, data fields, and collection frequencies. The objective is to create analytics-ready data rather than simply accumulate raw marketplace records.
The resulting dataset can support competitive benchmarking, menu intelligence, pricing analysis, restaurant discovery, geographic comparisons, and customer-experience monitoring.
Conclusion
Competitive intelligence in food delivery increasingly depends on connecting multiple marketplace signals instead of analyzing restaurants, prices, ratings, menus, and delivery conditions separately. A structured DoorDash API workflow can help brands create a repeatable foundation for tracking these variables and transforming them into historical business intelligence.
The 2020–2026 trajectory demonstrates the scale of the opportunity. DoorDash reported 816 million total orders in 2020, 1.736 billion in 2022, 2.161 billion in 2023, 2.583 billion in 2024, and 3.172 billion in 2025. Marketplace GOV similarly increased from $24.7 billion in 2020 to $102.0 billion in 2025. (SEC)
For 2026, the focus can move from simple data collection toward historical intelligence, automated alerts, price benchmarking, menu-change detection, rating analysis, and location-level competitive research.
Turn restaurant marketplace signals into structured, analytics-ready competitive intelligence with Real Data API. Build a scalable data workflow that supports smarter pricing, assortment, rating, and delivery analysis!
FAQs
1. What can businesses collect using DoorDash API?
Businesses can organize publicly accessible restaurant, menu, pricing, rating, availability, and delivery attributes into structured datasets for competitive monitoring, market research, benchmarking, and analytics.
2. What is DoorDash Scraper used for?
A DoorDash Scraper can support recurring collection of restaurant marketplace information, helping businesses monitor menu changes, pricing movements, restaurant availability, ratings, and delivery-related signals.
3. Why use DoorDash restaurant data web scraping?
DoorDash restaurant data web scraping can help businesses build historical restaurant datasets containing locations, cuisines, menus, ratings, availability, and other relevant attributes for competitive intelligence.
4. How does DoorDash pricing data scraping help retailers?
DoorDash pricing data scraping can help teams compare menu prices, promotional changes, delivery-related charges, and price movements across restaurants, categories, locations, and time periods.
5. Can real-time DoorDash rating data API support reputation monitoring?
Yes. real-time DoorDash rating data API workflows can provide structured rating observations for recurring analysis. Real Data API can help integrate such data into broader restaurant intelligence pipelines.
Latest posts
How Ixigo API Helps Businesses Solve Flight, Train, Hotel, Travel, and Pricing Data Challenges

How to Extract Restaurants, Menus, Prices, Ratings, and Business Data for Market Insights
How Brands Track Restaurant, Menu, Pricing, Rating, and Delivery Data for Competitive Intelligence

How Retailers Track Fashion Products, Prices, Brands, and Category Data for Competitive Intelligence Using AJIO API






.png)



