
Introduction
Apartments.com data scraping for rental market analysis can help property managers, real estate investors, brokers, researchers, and rental platforms collect structured information about rental prices, property types, locations, amenities, availability, and market movements. Historical property data helps teams compare neighborhoods, identify pricing patterns, and improve demand forecasts.
An Apartments.com Scraper can similarly support authorized real estate research by organizing publicly accessible property information into structured datasets, subject to applicable website terms, permissions, and legal requirements.
Industry context: The U.S. rental market contains millions of housing units across diverse cities and neighborhoods. Rental prices can vary significantly by location, property size, amenities, season, and local supply. The 2020-2026 figures in this report are illustrative research examples and should not be treated as official Apartments.comor Apartments.com statistics.
The core problem is data fragmentation. Rental listings change frequently. Properties can be added, removed, repriced, or updated. Manual research makes it difficult to maintain consistent market intelligence.
A structured data workflow solves this challenge by creating comparable records. Businesses can track:
- Rental prices.
- Property addresses or locations where permitted.
- Bedrooms and bathrooms.
- Property types.
- Amenities.
- Availability.
- Listing status.
- Neighborhood information.
- Collection dates.
This report focuses on a practical question: how can rental-market data help businesses make better pricing and demand decisions?
How Can Property-Level Data Improve Rental Market Research?
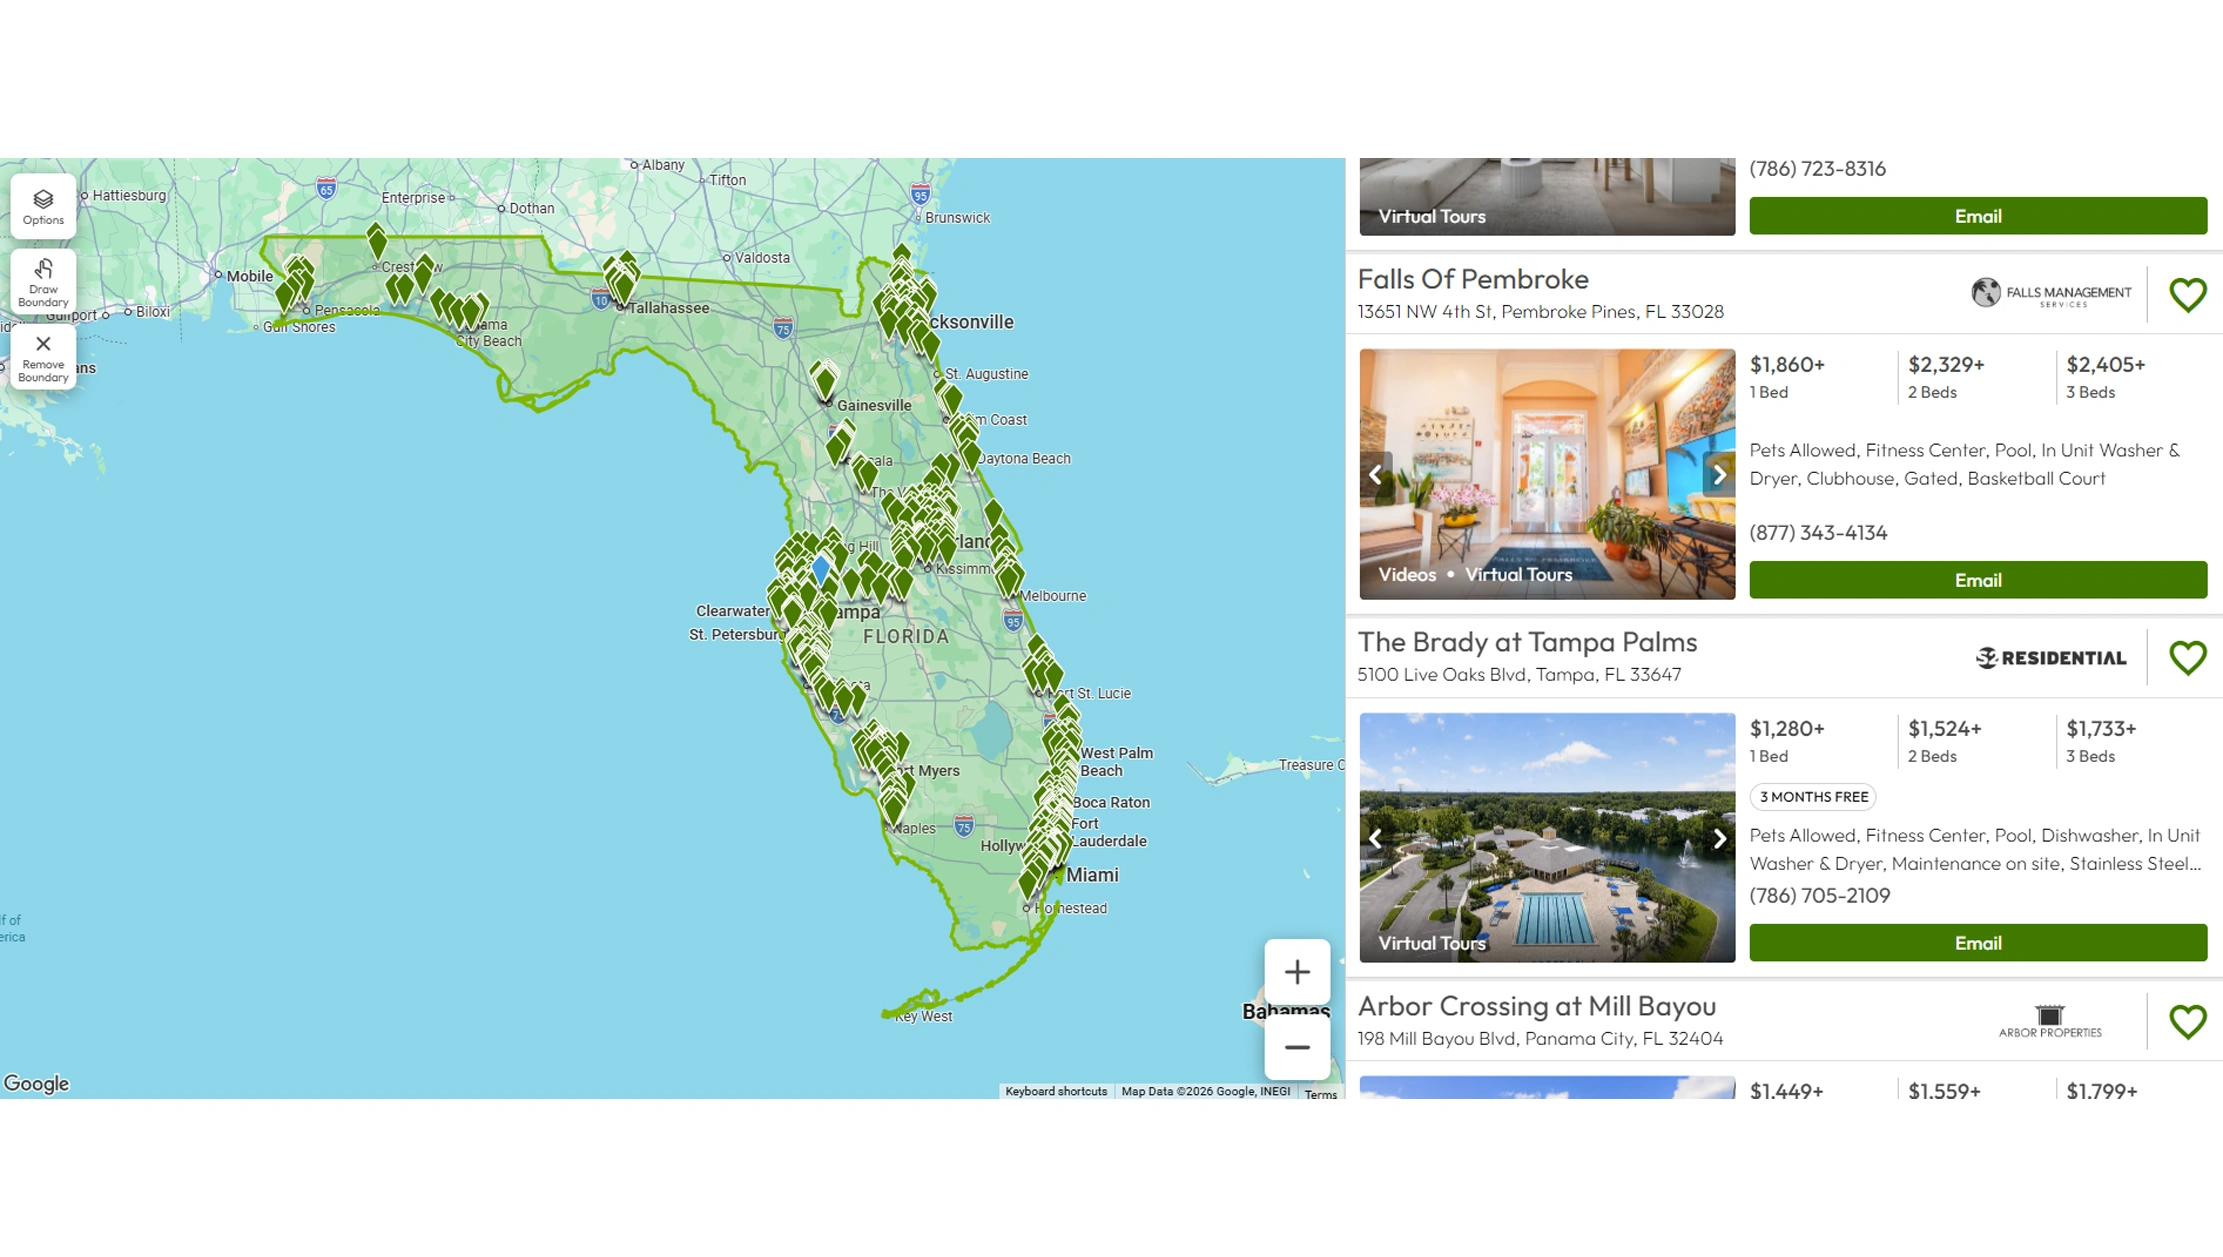
Extract Apartments.comproperty data to create structured records for rental market research, property benchmarking, neighborhood analysis, and pricing intelligence. Property-level information gives analysts a more detailed view than broad city-level averages.
A rental property can have several attributes that influence its market position. Location, bedroom count, bathroom count, property type, amenities, rental price, and availability can all affect how a listing compares with competing properties.
A structured dataset allows analysts to group similar properties together. For example, a two-bedroom apartment with parking in one neighborhood should be compared with similar properties rather than with every listing in the city.
Historical records also make the dataset more valuable. A current rental price shows the present market. Multiple observations reveal whether prices are rising, falling, or remaining stable.
| Year | Hypothetical properties analyzed | Cities covered | Primary use |
|---|---|---|---|
| 2020 | 50,000 | 40 | Market mapping |
| 2021 | 75,000 | 55 | Property comparison |
| 2022 | 110,000 | 75 | Price benchmarking |
| 2023 | 160,000 | 100 | Neighborhood analysis |
| 2024 | 225,000 | 130 | Competitive research |
| 2025 | 310,000 | 165 | Rental intelligence |
| 2026 | 425,000 | 200 | Continuous monitoring |
These figures are hypothetical examples showing how a research program could expand.
Useful property fields include:
- Property name.
- Rental price.
- Bedroom count.
- Bathroom count.
- Property type.
- Amenities.
- Location.
- Availability.
- Listing information.
- Collection timestamp.
This structure helps real estate teams filter properties by specific criteria. Investors can compare neighborhoods. Property managers can benchmark rental rates. Researchers can study supply changes.
The key benefit is consistency. When every property follows the same data structure, analysts can perform comparisons more efficiently and make pricing decisions with greater context.
How Can Frequent Data Updates Support Faster Pricing Decisions?
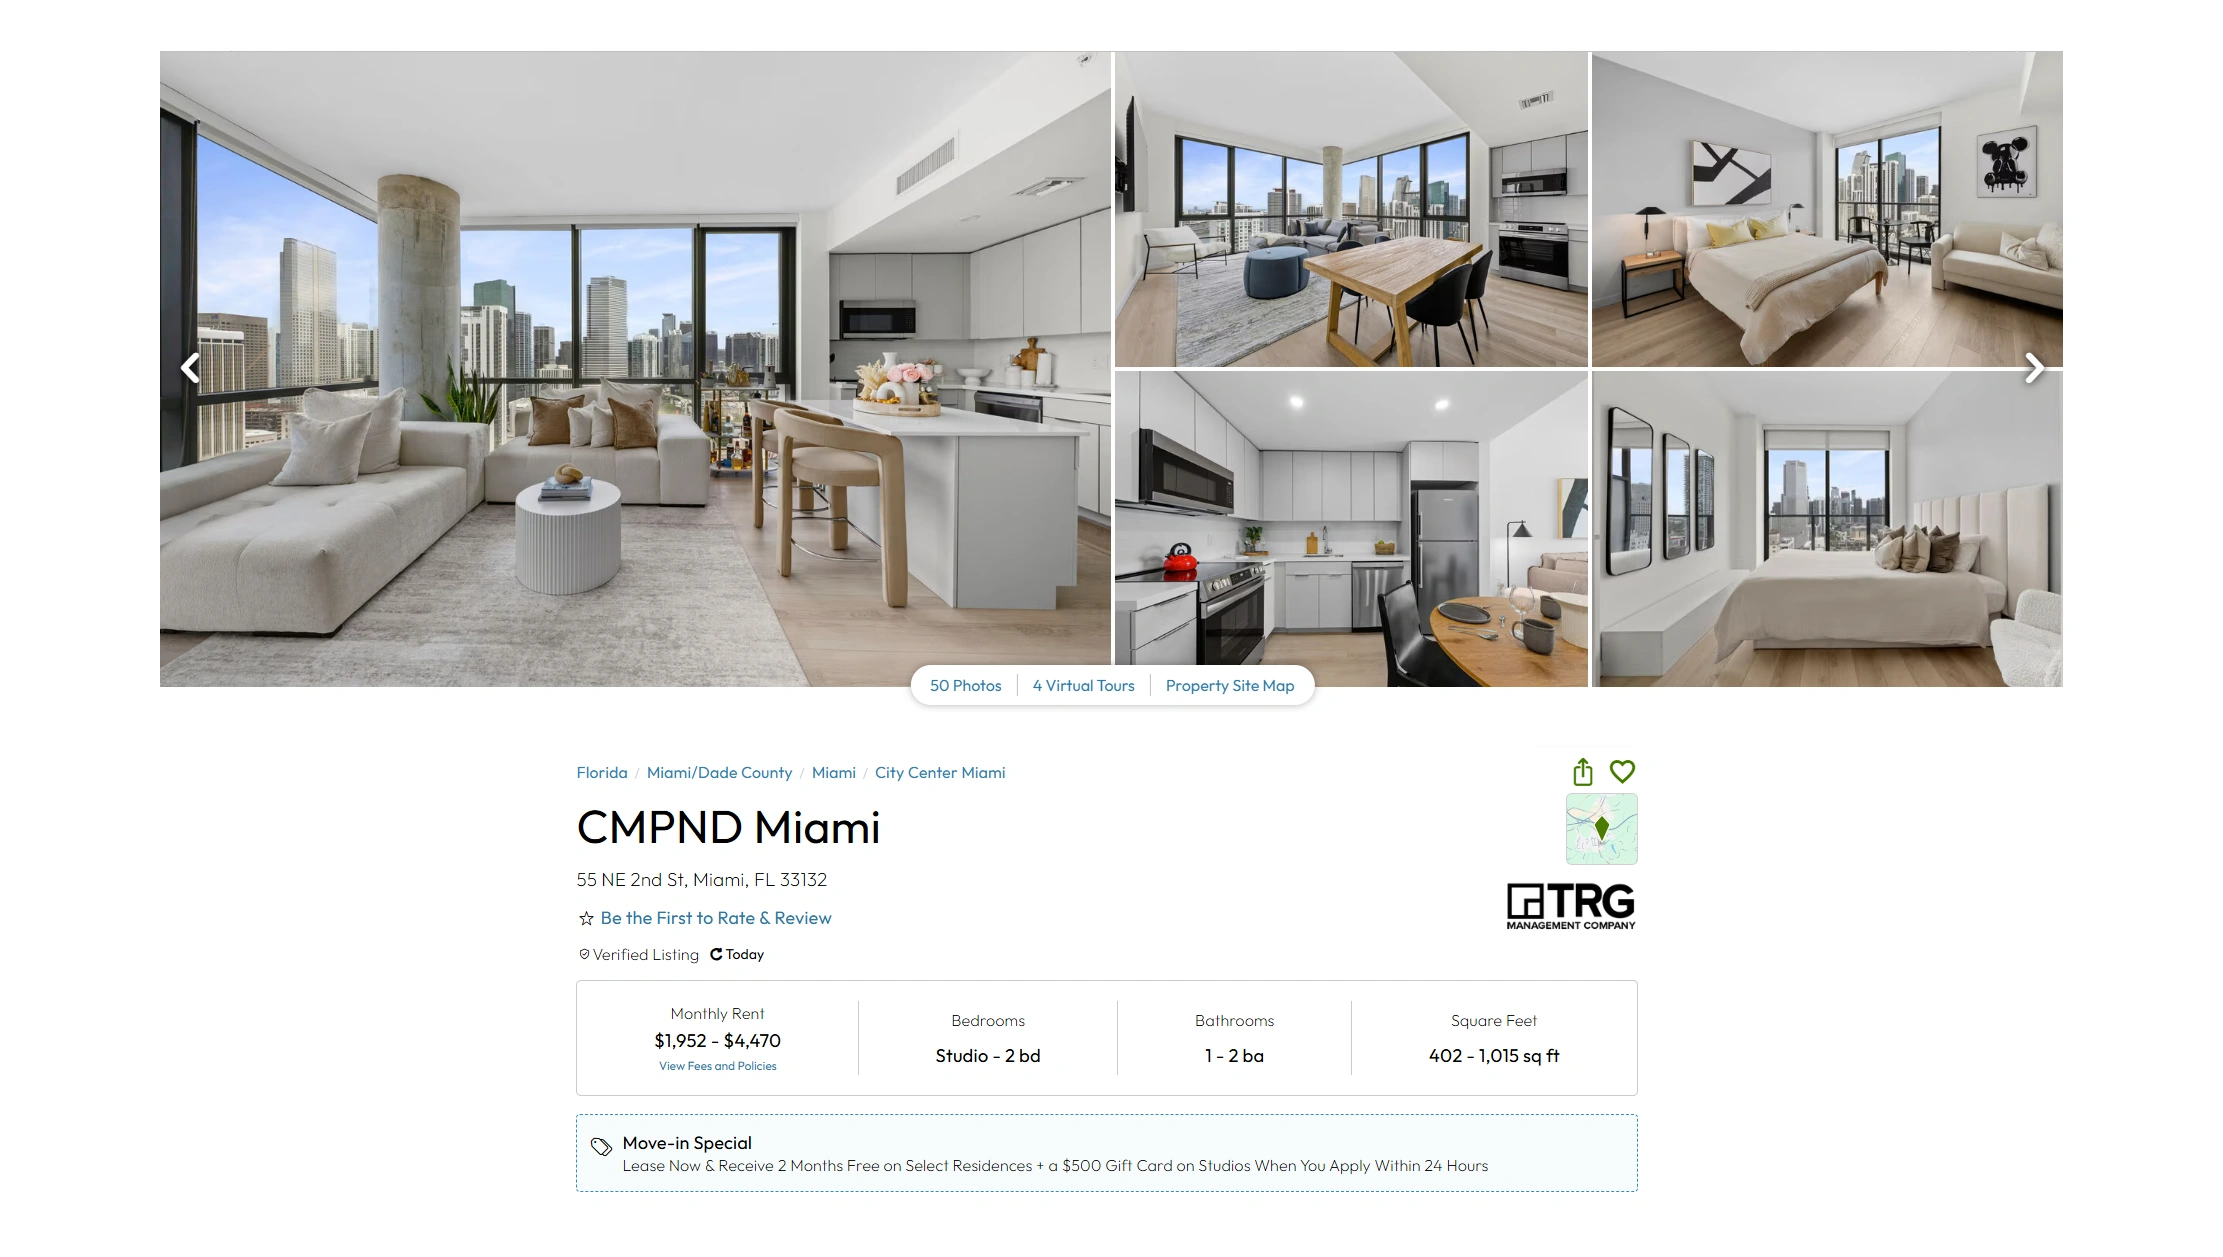
Real-time Apartments.com data extraction API can support recurring rental-market research when authorized data-access methods are available. Frequent data updates can help businesses identify changes in rental prices, listing availability, and property supply.
Rental pricing is not static. A property can change price between research cycles. New listings can enter a neighborhood while other properties disappear. A one-time dataset may therefore become outdated quickly.
A recurring workflow can provide periodic snapshots. Analysts can compare the latest observations with previous records and identify meaningful movements.
For example, a property manager could monitor similar two-bedroom properties within a defined neighborhood. If several competing properties lower their asking prices, the manager can investigate whether the change reflects increased supply or weaker demand.
| Year | Hypothetical records collected | Update cycles | Main application |
|---|---|---|---|
| 2020 | 60,000 | 12 | Baseline research |
| 2021 | 90,000 | 18 | Rental comparison |
| 2022 | 135,000 | 24 | Price monitoring |
| 2023 | 200,000 | 30 | Competitive analysis |
| 2024 | 285,000 | 36 | Market tracking |
| 2025 | 400,000 | 48 | Pricing intelligence |
| 2026 | 550,000 | 60 | Continuous analysis |
These are illustrative figures, not reported API volumes.
A structured API workflow can help integrate property data into internal systems, dashboards, and analytical tools.
Businesses can monitor:
- Price changes.
- New listings.
- Removed listings.
- Availability changes.
- Neighborhood-level movement.
- Property-type trends.
- Competitive pricing.
Frequent updates are especially useful for markets with high price volatility. However, businesses should distinguish observed listing information from confirmed transaction data.
A listing price represents an asking price. It does not necessarily represent the final signed lease value.
Combining marketplace observations with internal leasing data can create a stronger forecasting model.
How Can Real Estate Intelligence Improve Investment Decisions?
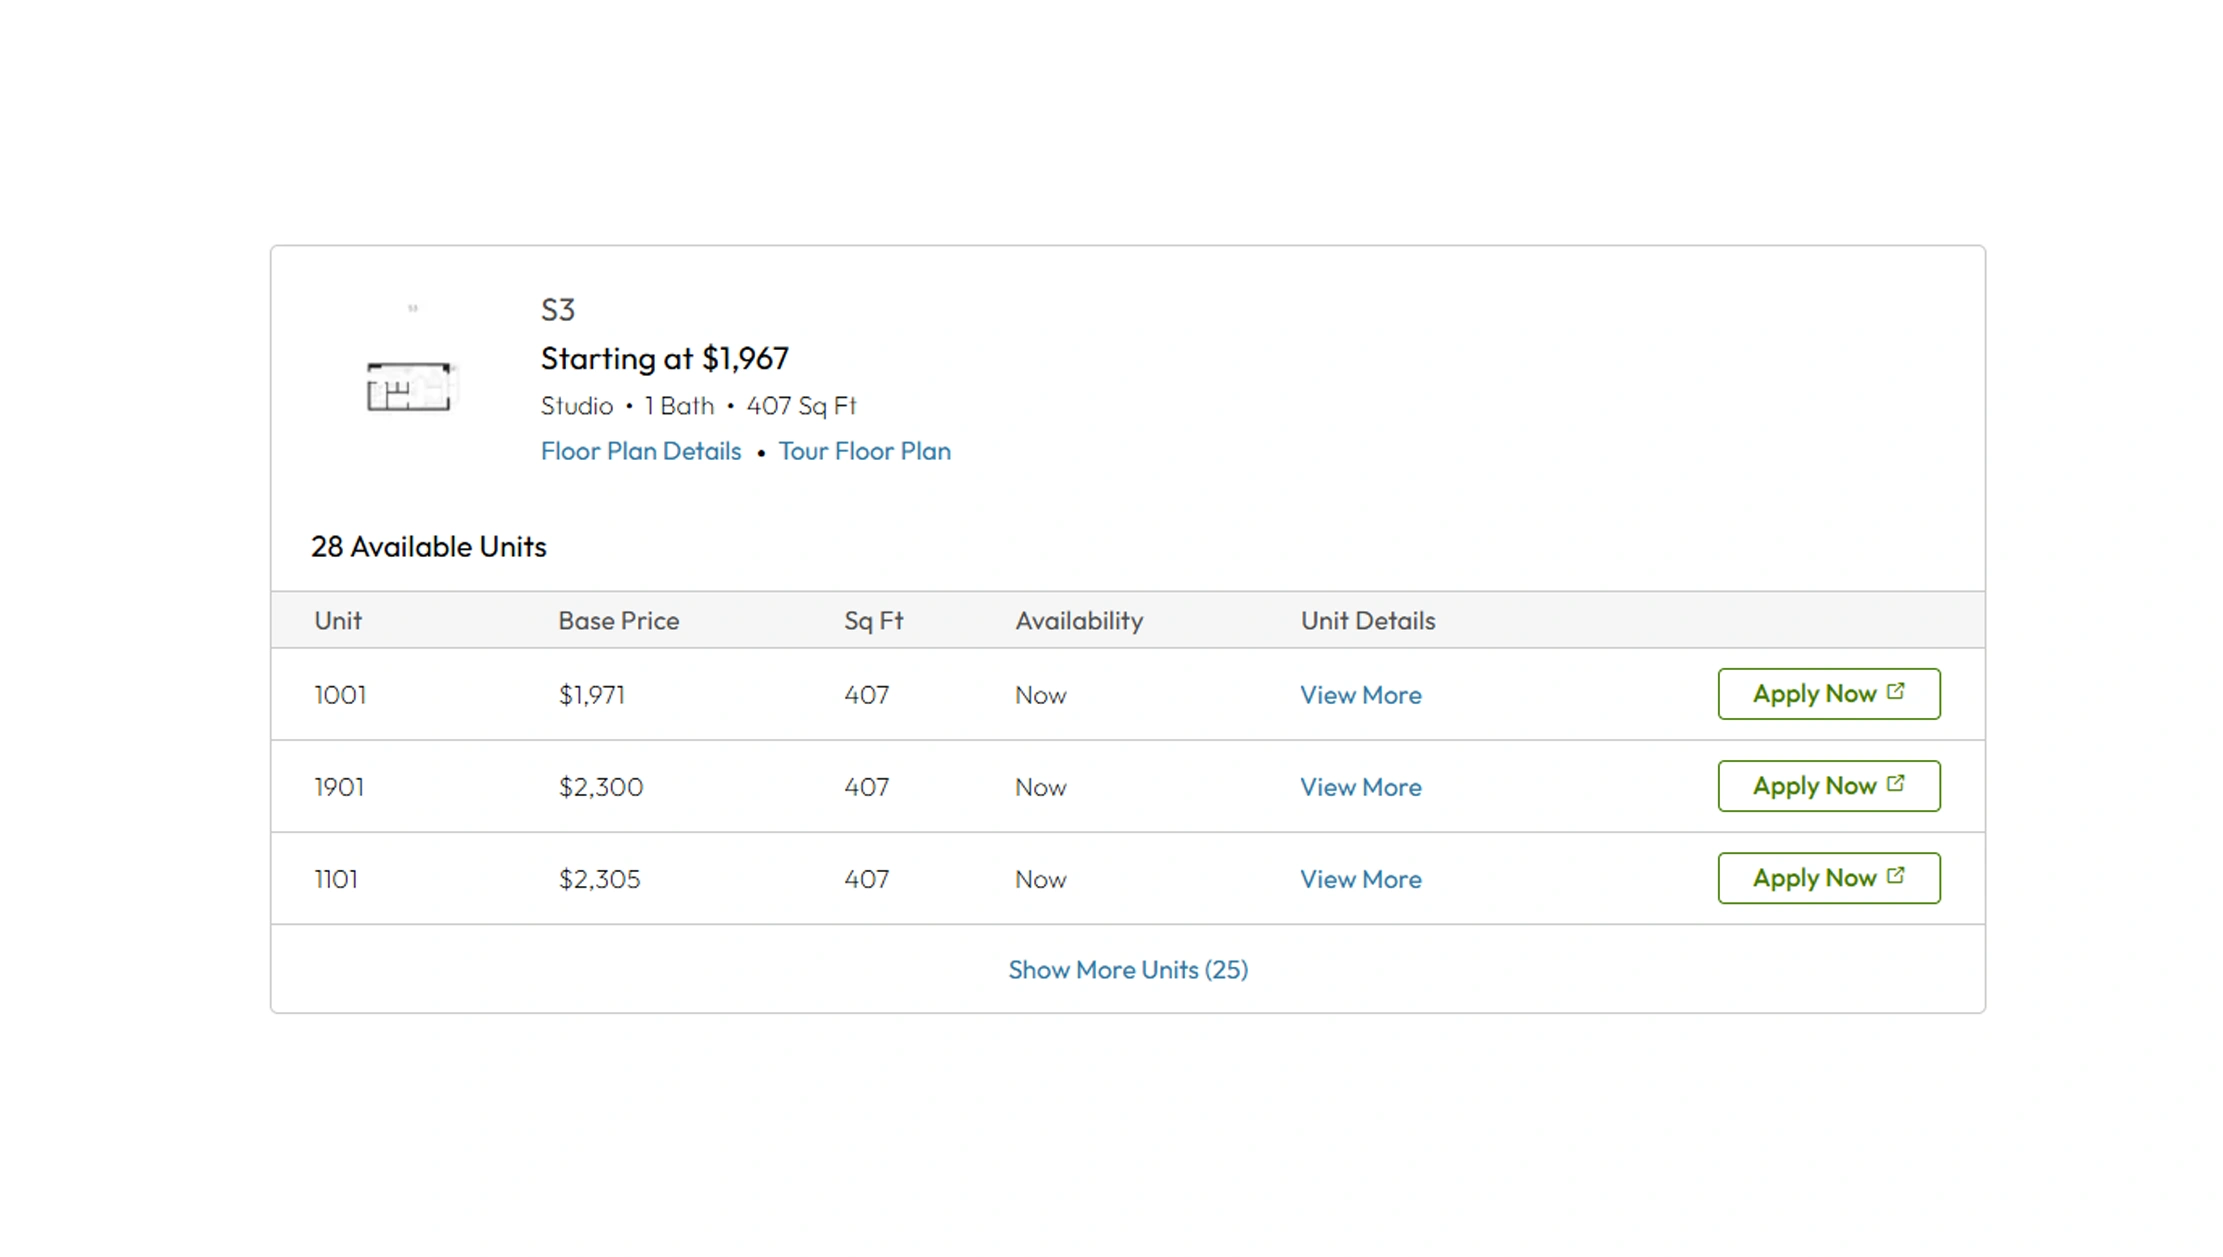
Web scraping Apartments.com data for real estate intelligence can help investors, property managers, and researchers organize rental-market information for competitive analysis and investment research. Authorized data collection can provide a broader view of properties across neighborhoods and cities.
Investment decisions often depend on several variables. Rental prices matter, but so do property types, amenities, location, availability, and competitive supply.
A structured dataset can help investors compare markets using consistent criteria. For example, an analyst can compare rental prices for one-bedroom properties across multiple neighborhoods and identify areas that deserve deeper research.
| Year | Hypothetical listings analyzed | Neighborhoods | Research objective |
|---|---|---|---|
| 2020 | 45,000 | 100 | Market discovery |
| 2021 | 70,000 | 140 | Neighborhood comparison |
| 2022 | 105,000 | 190 | Rental benchmarking |
| 2023 | 155,000 | 250 | Competitive intelligence |
| 2024 | 220,000 | 325 | Investment research |
| 2025 | 305,000 | 400 | Market forecasting |
| 2026 | 420,000 | 500 | Portfolio intelligence |
These figures are hypothetical and demonstrate possible research scale.
Real estate teams can analyze:
- Median observed asking prices.
- Price ranges.
- Bedroom-level pricing.
- Neighborhood supply.
- Property amenities.
- Availability patterns.
- Competitive density.
- Historical price movement.
A market with high asking rents may look attractive, but high prices alone do not guarantee strong investment performance. Analysts should also examine supply, vacancy, demand indicators, operating costs, local regulations, and actual transaction data.
Rental listing data works best as one input within a broader investment model.
It can help answer early-stage research questions. Which neighborhoods have higher asking rents? Where is supply increasing? Which property types appear frequently? Which amenities are common among higher-priced listings?
These insights can help investors prioritize further research.
How Can Automated Rental Data Collection Improve Market Monitoring?
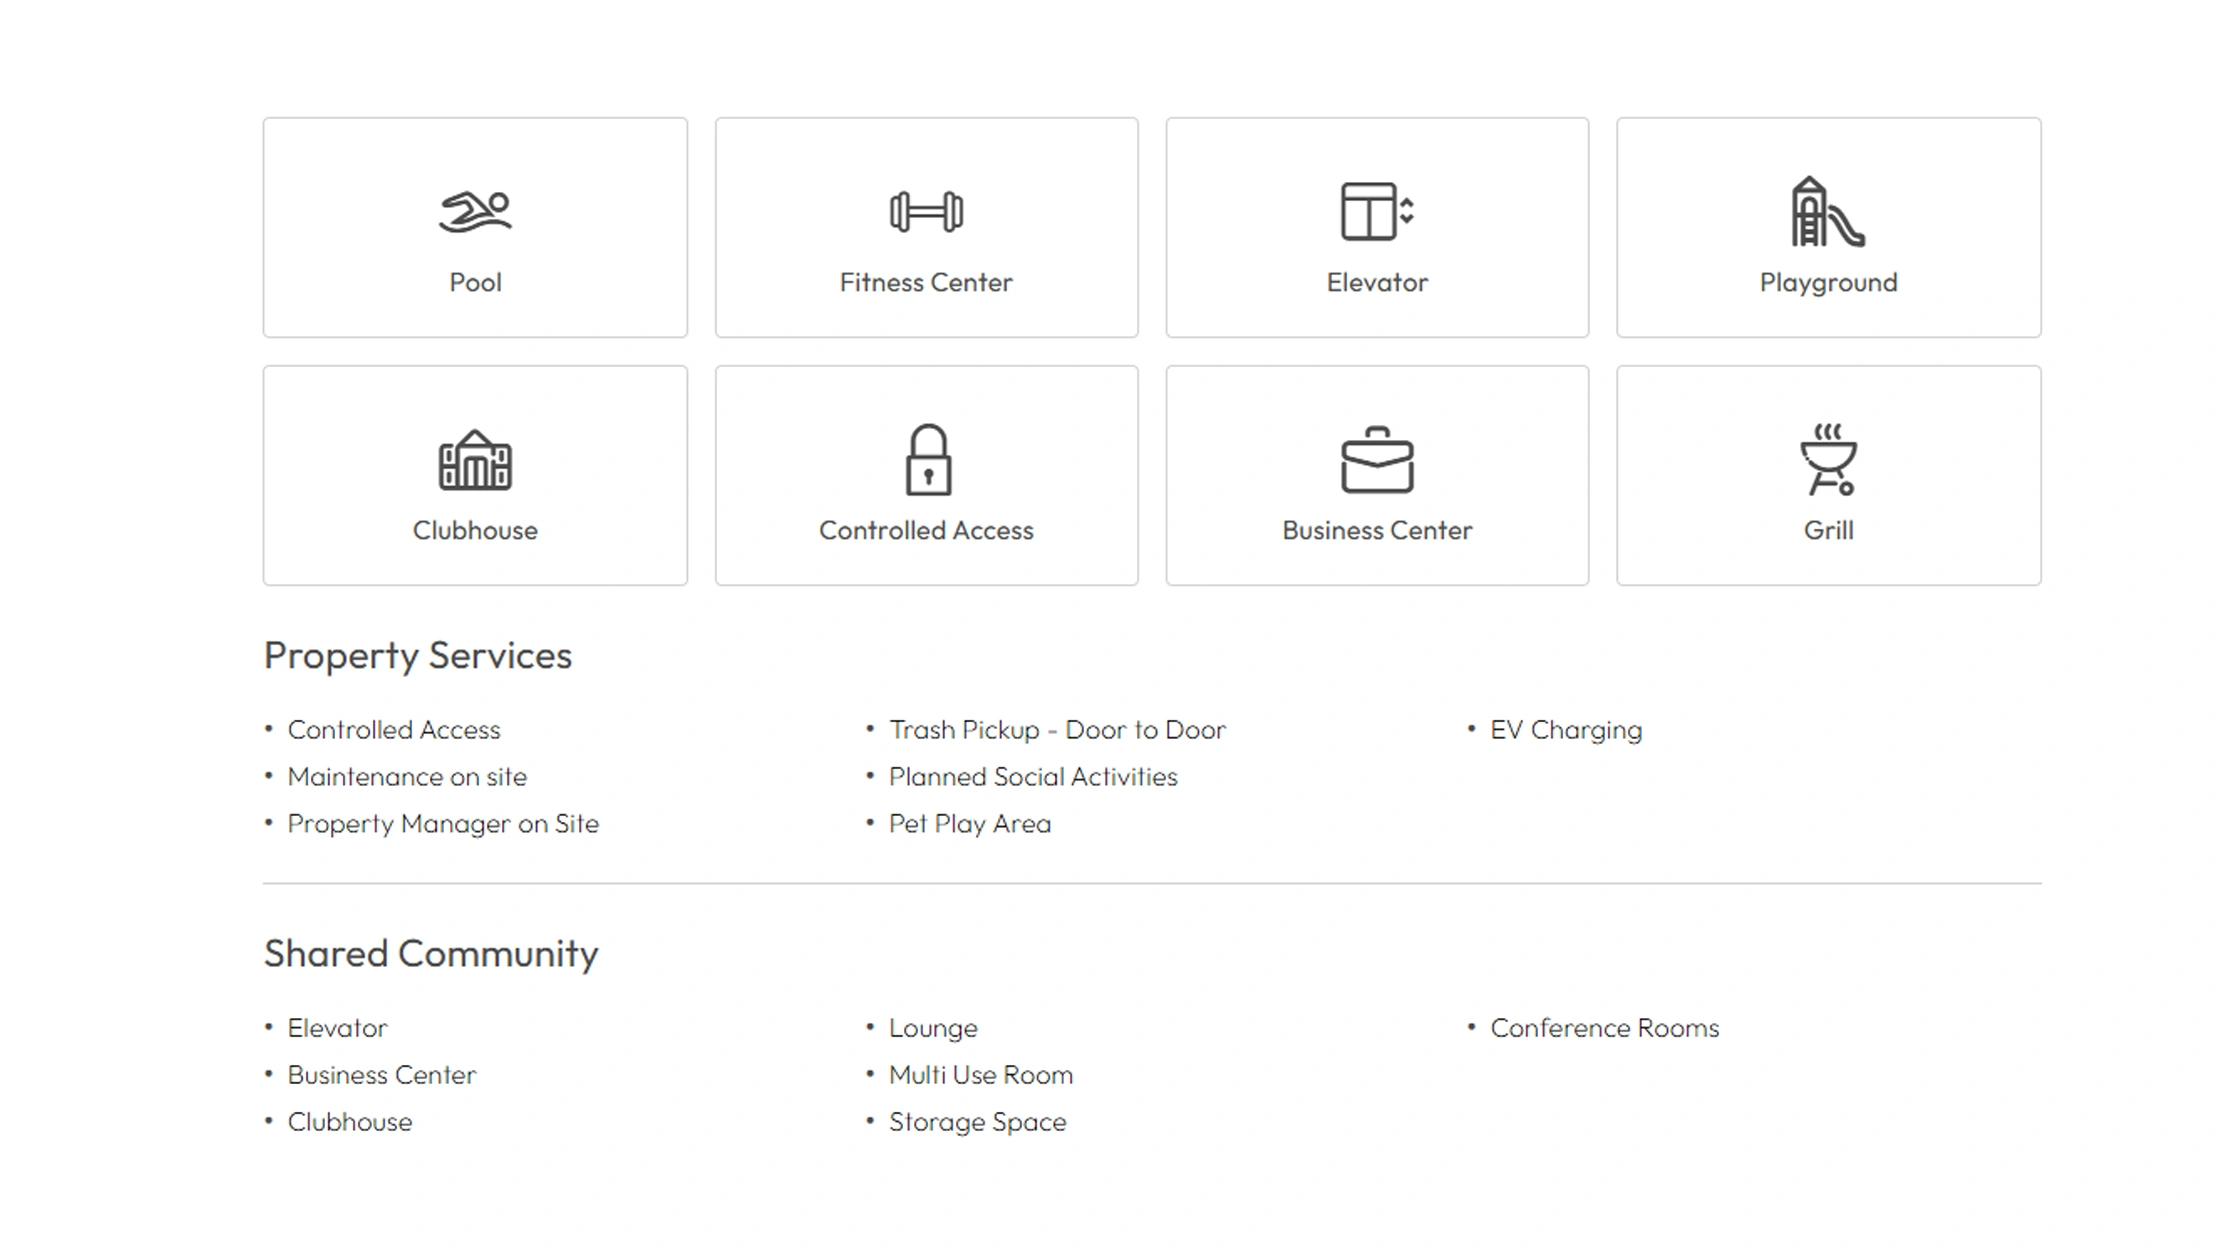
Scrape Apartments.comrental data to create repeatable datasets for rental pricing research, availability monitoring, and competitive analysis, provided the collection method complies with applicable terms and permissions.
Automation can reduce repetitive manual work. Instead of checking individual listings one at a time, businesses can organize relevant property information into structured records.
A scalable collection process should focus on the fields that directly support business decisions.
Important fields may include:
- Property name.
- Location.
- Monthly asking rent.
- Bedrooms.
- Bathrooms.
- Property type.
- Amenities.
- Availability.
- Listing status.
- Collection date.
| Year | Hypothetical rental listings | Price observations | Main focus |
|---|---|---|---|
| 2020 | 40,000 | 160,000 | Market mapping |
| 2021 | 65,000 | 260,000 | Price comparison |
| 2022 | 95,000 | 380,000 | Availability analysis |
| 2023 | 140,000 | 560,000 | Competitive monitoring |
| 2024 | 200,000 | 800,000 | Neighborhood intelligence |
| 2025 | 285,000 | 1.14 million | Pricing research |
| 2026 | 390,000 | 1.56 million | Continuous monitoring |
The figures are hypothetical examples.
Historical snapshots can reveal changes that manual research may miss. Analysts can identify properties that repeatedly change prices or neighborhoods where listing supply changes significantly.
Automated monitoring also makes segmentation easier. Teams can filter properties by bedroom count, location, price band, property type, or amenities.
For example, a property manager may focus only on two-bedroom apartments within a specific radius. An investor may examine listings below a particular price threshold.
Automation provides scale. However, scale should not come at the expense of data quality.
Businesses should validate records, remove duplicates, standardize fields, and preserve collection timestamps.
The result should be a clean dataset that supports repeatable analysis rather than a large collection of unstructured records.
How Can Broader Real Estate Data Improve Market Benchmarking?

Apartments.com Real Estate Dataset can complement rental-market research by providing structured information for property comparisons and broader real estate benchmarking, subject to applicable access permissions and data-use requirements.
Using multiple data sources can help analysts reduce dependence on a single marketplace. Different platforms may have different property coverage, listing structures, and geographic representation.
A combined research strategy can compare property information across sources. Analysts can identify overlapping properties, compare asking prices, and evaluate differences in available amenities or property descriptions.
| Year | Hypothetical properties combined | Markets analyzed | Benchmarking goal |
|---|---|---|---|
| 2020 | 70,000 | 50 | Basic market comparison |
| 2021 | 100,000 | 70 | Property benchmarking |
| 2022 | 150,000 | 95 | Pricing research |
| 2023 | 220,000 | 125 | Competitive analysis |
| 2024 | 310,000 | 160 | Market intelligence |
| 2025 | 430,000 | 200 | Portfolio research |
| 2026 | 575,000 | 250 | Cross-market analysis |
These figures are hypothetical examples rather than official platform statistics.
A multi-source dataset can support:
- Rental price benchmarking.
- Property coverage analysis.
- Neighborhood comparison.
- Amenity research.
- Listing availability analysis.
- Market trend research.
Data matching becomes important when combining sources. The same property may appear with different names or descriptions. Analysts should use consistent identifiers and validation rules where possible.
Multi-source research also provides additional context. If one platform shows a price movement, another source may help confirm whether the trend appears broader.
The goal is not to assume that every source will match perfectly. The goal is to build a richer market picture.
Real estate analysts can then compare multiple signals before making investment, pricing, or expansion decisions.
How Can Historical Data Improve Rental Market Forecasting?
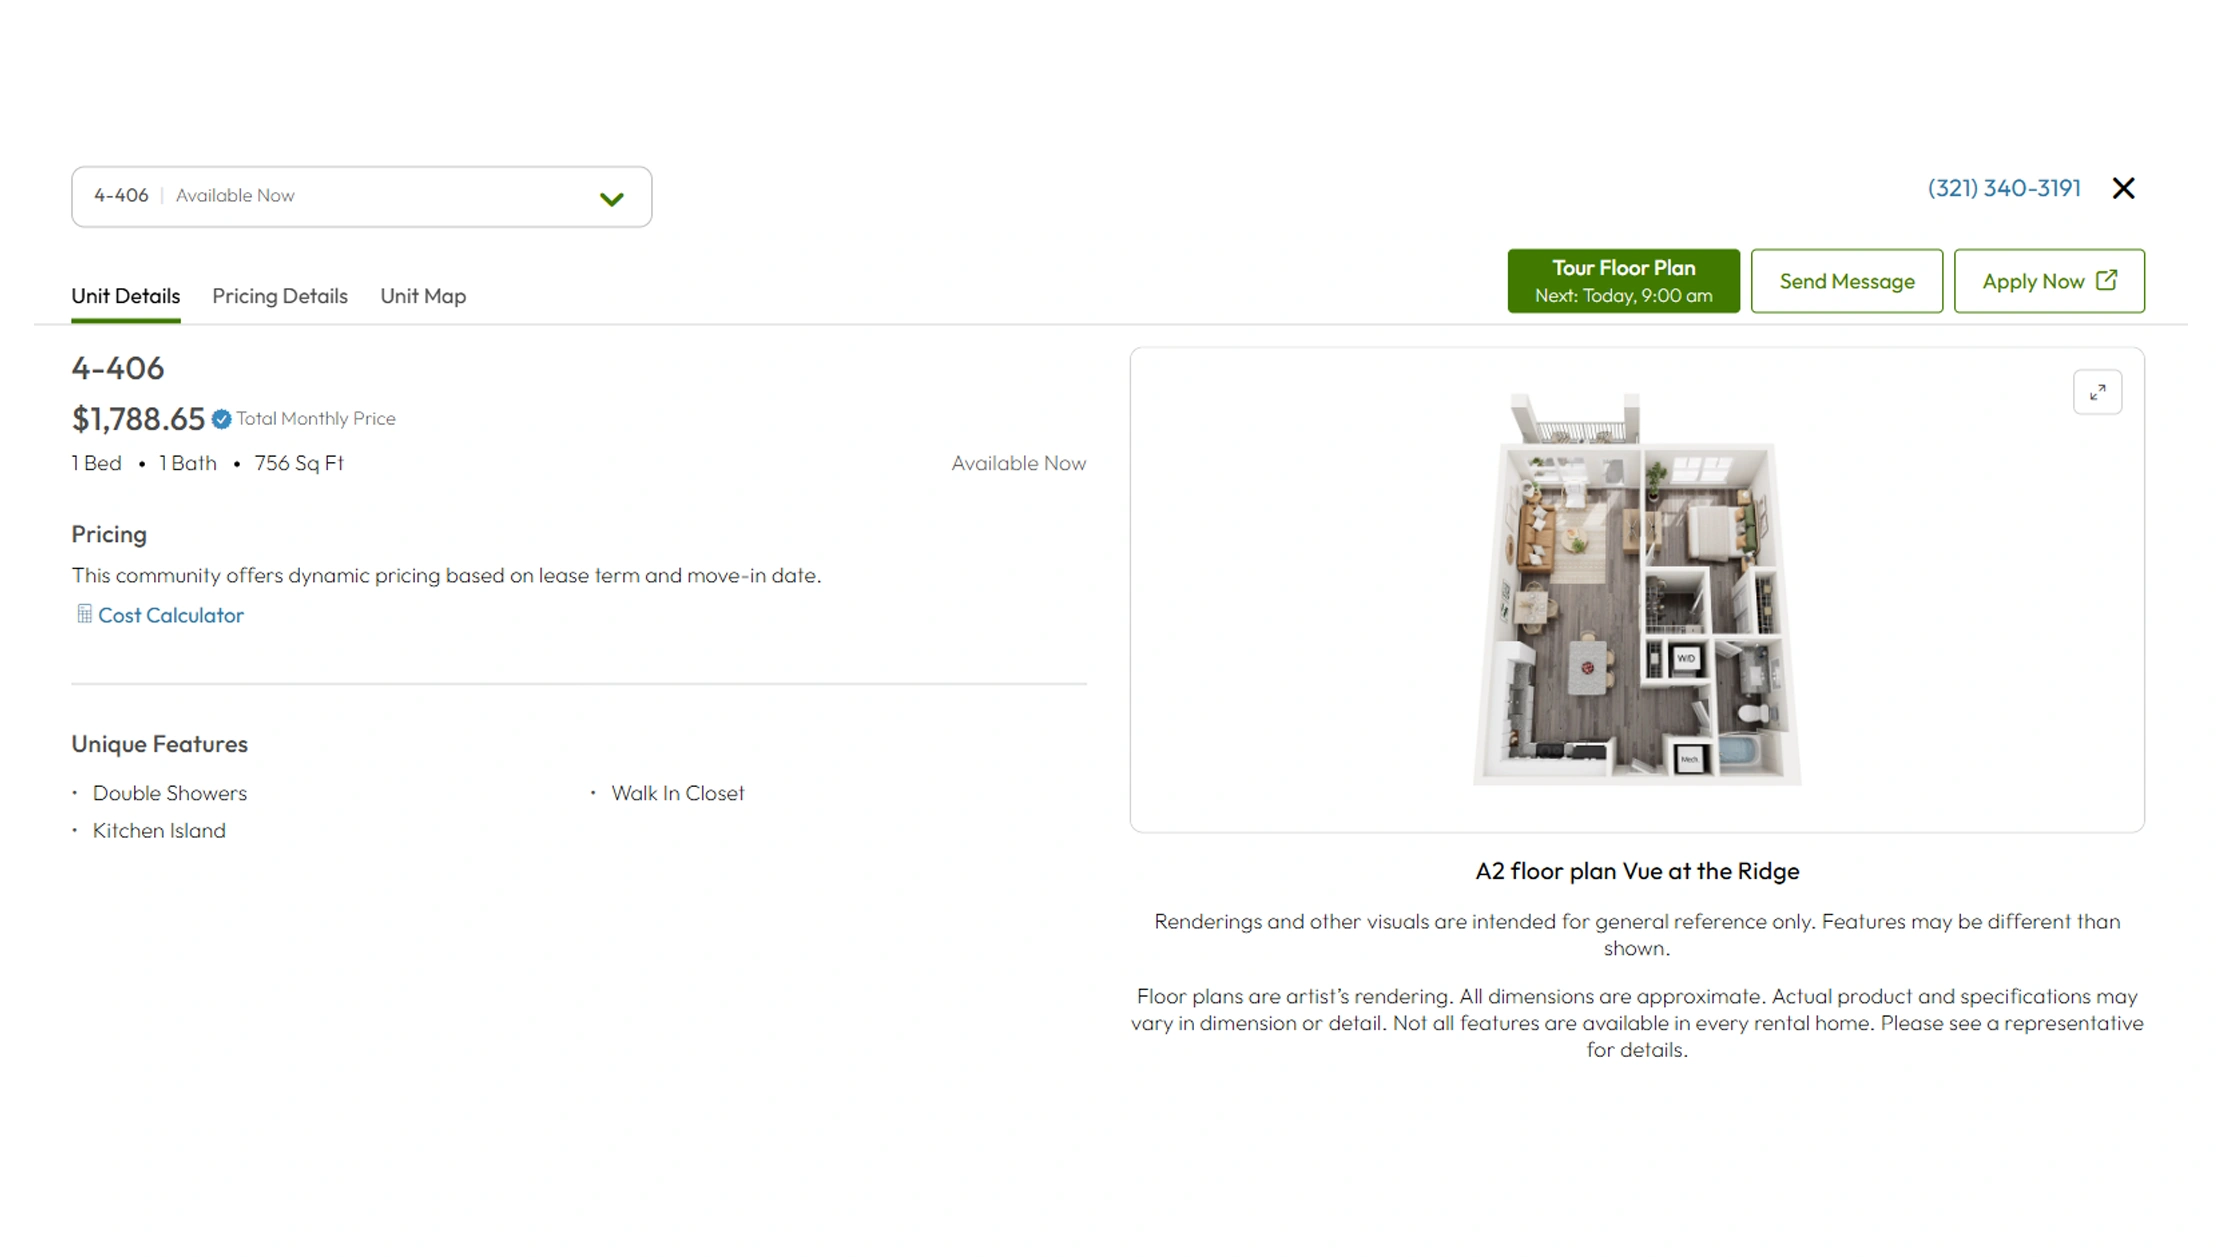
A Real Estate Dataset, Apartments.com data scraping for rental market analysis can provide a historical foundation for studying rental prices, property availability, and neighborhood-level market movements.
Forecasting requires context. A current asking rent does not reveal whether the market recently experienced a sharp increase or decrease.
Historical records allow analysts to compare rental conditions across multiple periods. They can study price changes, listing volume, property categories, and neighborhood-level trends.
| Year | Hypothetical historical records | Markets monitored | Forecasting focus |
|---|---|---|---|
| 2020 | 50,000 | 40 | Baseline conditions |
| 2021 | 80,000 | 60 | Recovery patterns |
| 2022 | 120,000 | 85 | Rental growth |
| 2023 | 175,000 | 115 | Market expansion |
| 2024 | 250,000 | 150 | Price forecasting |
| 2025 | 350,000 | 190 | Demand modeling |
| 2026 | 475,000 | 240 | Advanced forecasting |
These are illustrative research figures.
Historical rental datasets can help identify:
- Seasonal pricing patterns.
- Neighborhood changes.
- Property supply movements.
- Price volatility.
- Bedroom-level trends.
- Amenity-related price differences.
- Competitive shifts.
Businesses should avoid treating historical listing prices as guaranteed future outcomes. Forecasting should also consider economic conditions, local employment, housing supply, interest rates, migration, and actual leasing activity.
However, historical marketplace observations can provide useful external signals.
For example, if asking rents rise consistently while available listings decline, an analyst may investigate whether demand is strengthening. If listings increase while prices soften, the market may warrant additional research.
A strong forecasting model combines multiple data sources.
Rental listing data provides one important layer. Internal leasing data and broader economic indicators provide others.
Why Choose Real Data API?
Real Data API provides a structured approach to real estate data collection and market intelligence. It can help businesses organize rental listings, property attributes, pricing information, availability signals, and historical observations for analysis.
A scalable workflow can reduce repetitive manual research and make recurring market monitoring easier. Analysts can focus on interpreting market movements rather than manually checking large numbers of property listings.
Web Scraping Real Estate Data API capabilities can support structured real estate research across pricing, property availability, neighborhood comparisons, and competitive intelligence, subject to applicable access permissions and requirements.
For property managers, investors, brokers, and research teams, consistent datasets can support better benchmarking and market analysis.
Apartments.com data scraping for rental market analysis can form part of a broader research strategy that combines property-level observations with internal leasing information and other market indicators.
Conclusion
Rental markets change continuously. New properties enter the market. Existing listings change prices. Availability shifts. Neighborhoods develop at different rates.
Structured property data gives businesses a clearer way to monitor these changes. Historical records help analysts identify pricing trends, supply movements, neighborhood differences, and competitive opportunities.
Property managers can use these insights to review pricing. Investors can use them to prioritize markets for further research. Brokers and analysts can use them to understand competitive conditions.
Apartments.com data scraping for rental market analysis can support this process by turning large volumes of rental-market information into structured, comparable records, provided collection follows applicable platform terms, permissions, and legal requirements.
The strongest research strategy combines marketplace observations with internal leasing data and broader economic indicators.
Start building smarter rental-market intelligence with Real Data API and transform structured property data into actionable insights for pricing, demand forecasting, and competitive analysis!
Latest posts
How Web Scraping Wine Market Data Via Wine-Searcher Helps Extract Real-Time Wine Market Data For Competitive Pricing?

How To Use Automated Zara Web Scraping For Fashion Market Research To Analyze Pricing, Products, And Consumer Demand?
How Meesho Marketplace Data Extraction For Businesses Solves Inventory, Pricing, And Product Assortment Problems?
How To Solve Product Data Tracking Challenges At Scale with Costco Web Data Scraper For Product Information






.png)



