Introduction
Wine retailers, distributors, producers, marketplaces, and market-research teams can improve competitive pricing by turning marketplace listings into structured, timestamped datasets. web scraping wine market data via Wine-Searcher can help businesses monitor wine prices, vintages, merchants, availability, ratings, regions, and product attributes at scale, creating a stronger foundation for pricing intelligence and market analysis.
Wine-Searcher describes itself as a search engine and ecommerce marketplace for wine and spirits. Its official platform currently states that it handles 240 million consumer searches annually, has 19.1 million wine, beer, and spirit listings, and reaches 5.2 million monthly active users. It also provides industry data services covering retail demand, pricing, distribution, regions, grape varieties, and price categories.
The pricing challenge is straightforward: wine prices can differ substantially by merchant, geography, vintage, bottle size, availability, and market conditions. A business that relies on occasional manual checks can miss important movements. Automated collection provides historical observations that can be compared over time.
A Wine API can further support structured integration when businesses need marketplace information inside their own applications, analytics systems, dashboards, or pricing workflows. Wine-Searcher itself advertises API functionality for automatically checking prices.
For businesses using Real Data API, the objective should not simply be collecting more wine records. The objective is to build a reliable data layer that answers practical questions: Which wines are becoming more expensive? Where are price gaps emerging? Which vintages have limited availability? Which merchants are consistently above or below the market benchmark? Which regions or categories are attracting attention?
How Can Current Marketplace Signals Improve Pricing Decisions?
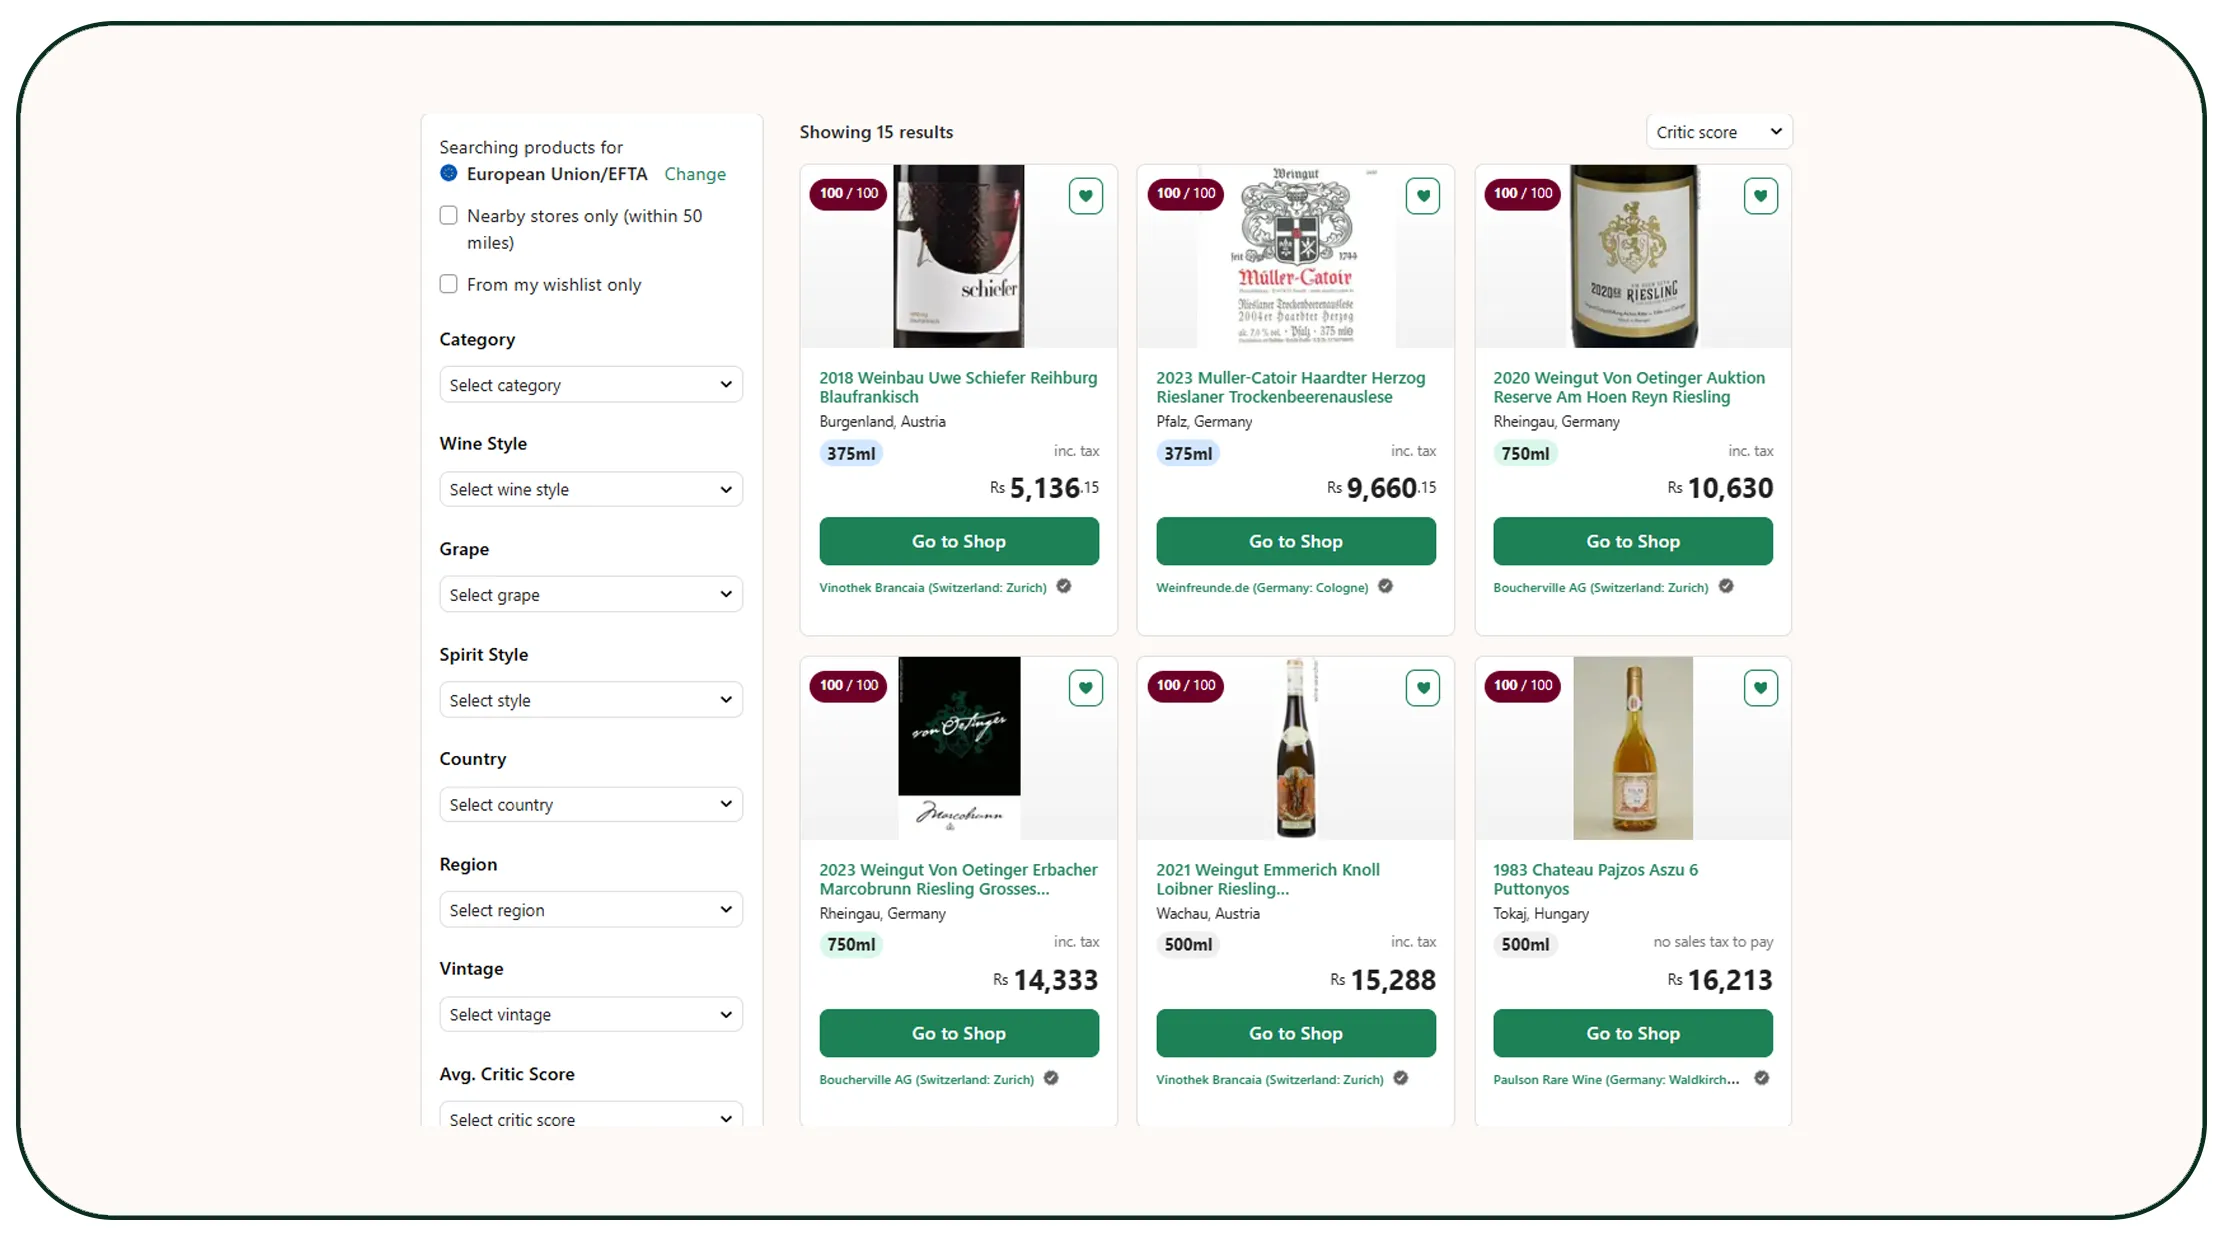
real-time Wine-Searcher data extraction can give pricing teams a continuously refreshed view of marketplace conditions. The useful fields may include wine name, producer, vintage, region, grape variety, bottle size, merchant, listed price, currency, availability, rating, review count, and product URL.
Wine-Searcher states that it collects price lists from wine and spirit businesses worldwide, including retail stores, auction houses, brokers, and producers. Its professional valuation service uses current market prices and can benchmark inventory against average, minimum, and maximum prices for the same product in a market.
That creates an important distinction between simply seeing a price and understanding a price. A single listing may not represent the market. A dataset containing multiple merchants can show the price distribution. A historical dataset can show whether the current price is normal, unusually high, or unusually low for that product.
For example, a distributor can monitor a premium Bordeaux vintage across several countries. If the average price remains stable while the number of offers falls, the business may investigate whether supply is tightening. Conversely, if offer counts rise while prices decline, the company may investigate whether merchants are discounting or inventory is becoming more abundant.
Wine-market production context, 2020-2026
The following table uses OIV data to provide real market context. It is not Wine-Searcher listing data; it illustrates why pricing teams need current marketplace observations alongside supply-side information. OIV reported 225.6 million hectolitres of global wine production in 2024, the lowest level since 1961. Its 2025 outlook estimated approximately 227 million hectolitres.
| Year | Global wine production, mhl | Data status |
|---|---|---|
| 2020 | 263.0 | OIV |
| 2021 | 260.8 | OIV |
| 2022 | 263.8 | OIV |
| 2023 | 237.3 | OIV |
| 2024 | 225.6 | OIV |
| 2025 | ~227 | Preliminary OIV |
| 2026 | N/A | Not yet available as a comparable annual figure |
The decline from 263.0 million hectolitres in 2020 to 225.6 million in 2024 demonstrates why market supply can become an important variable in pricing analysis. Businesses can combine these macro indicators with marketplace-level price and availability observations to build more useful pricing models.
The practical approach is to timestamp every observation. Instead of storing only "Wine X = $120," store the product, vintage, market, merchant, price, currency, availability, and collection timestamp. This makes the dataset useful for historical comparison and anomaly detection.
What Makes Large-Scale Price Monitoring More Effective?
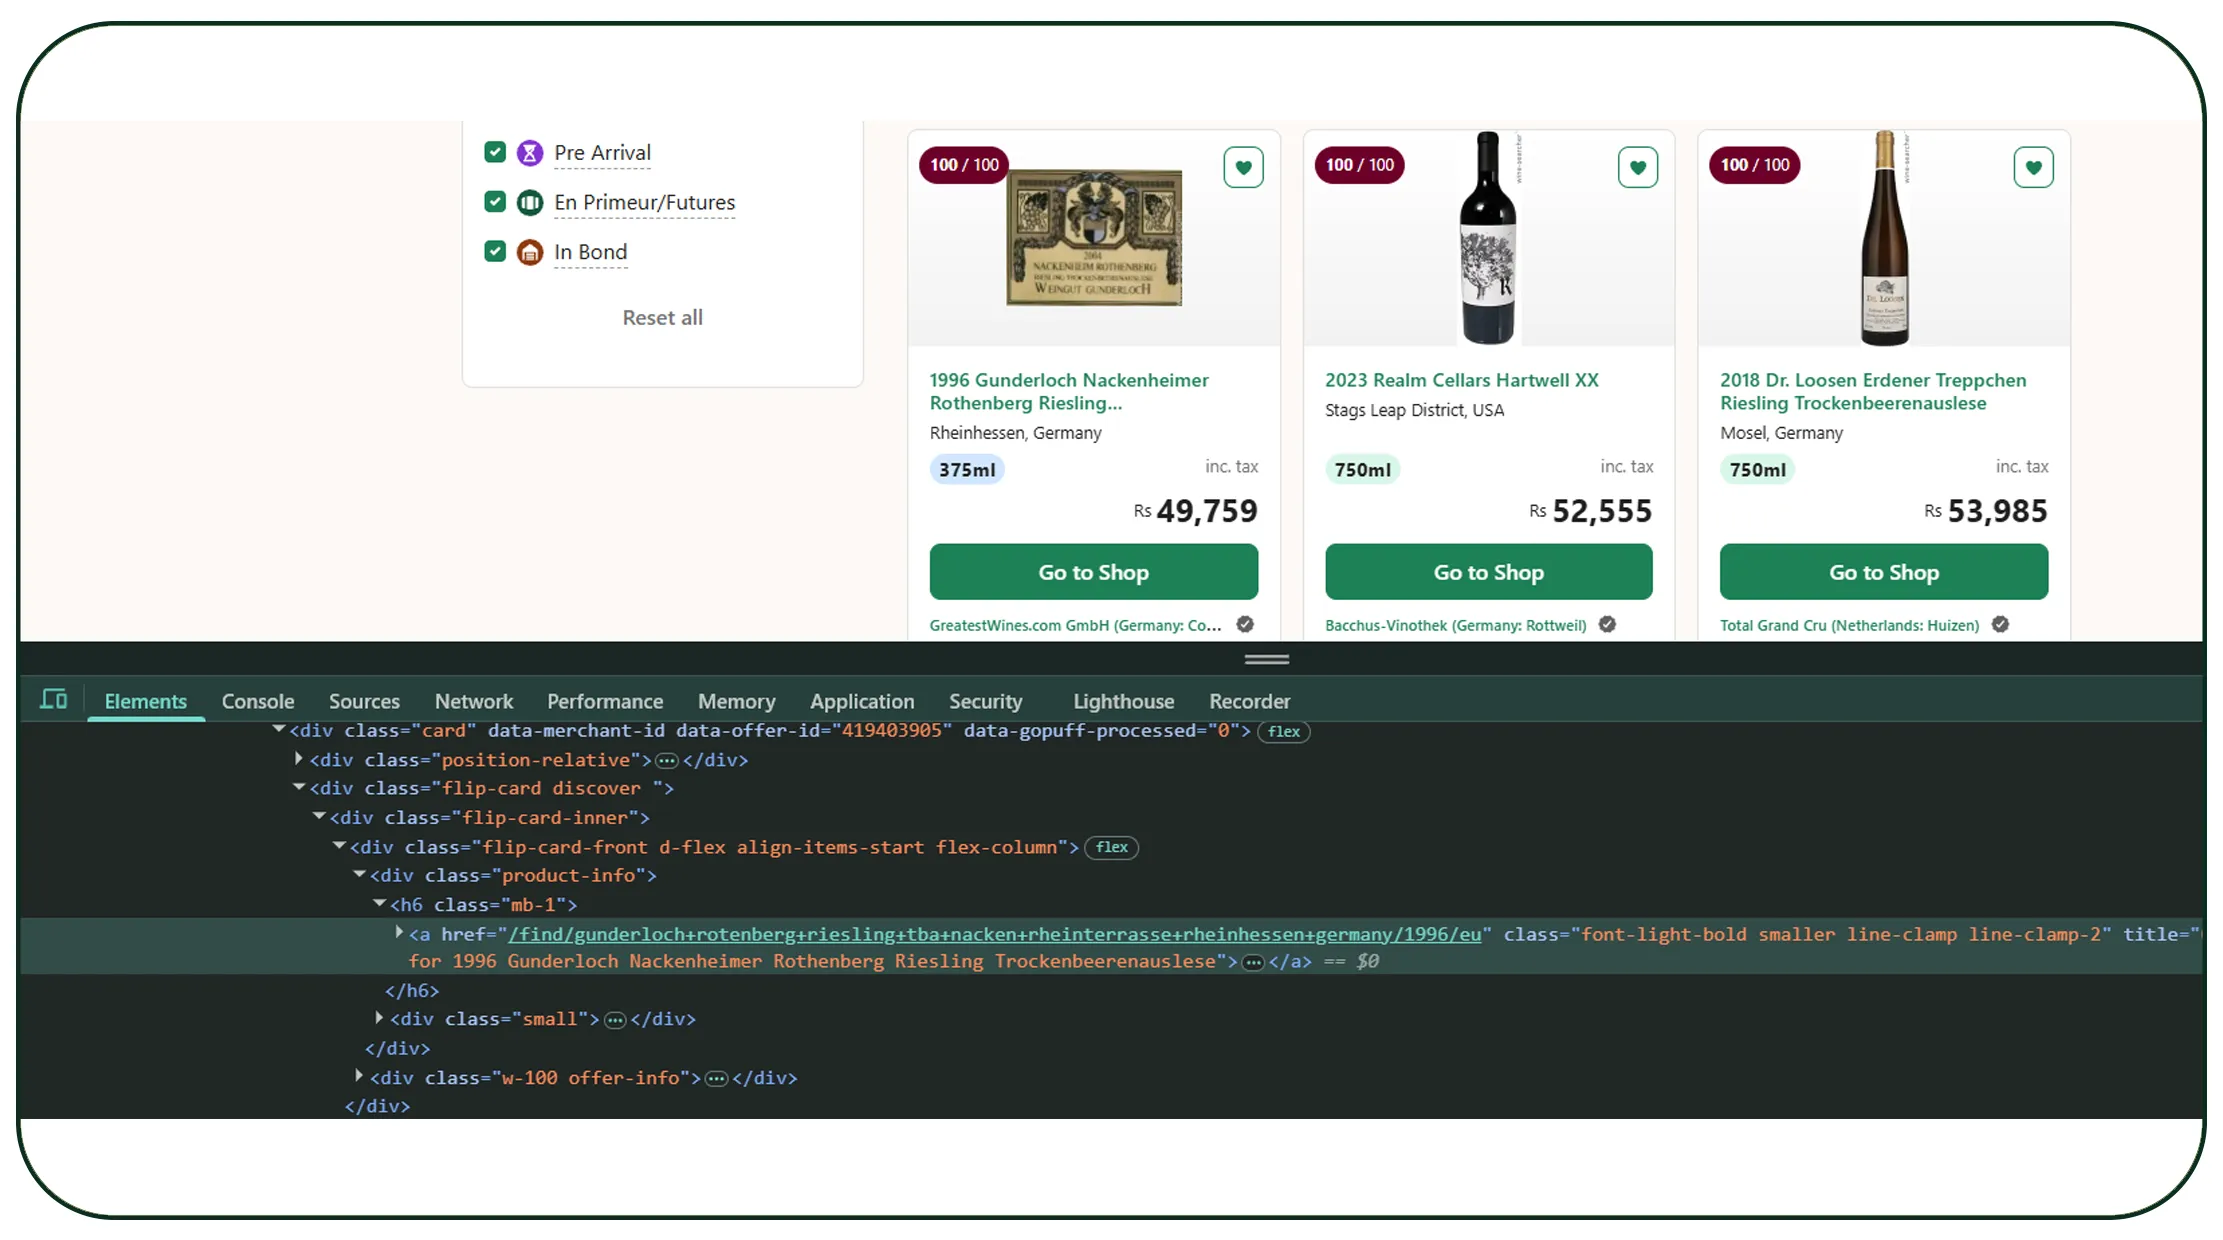
Businesses that scrape Wine-Searcher pricing data at scale can move beyond individual price checks and build category-wide competitive intelligence. This is particularly valuable for retailers and distributors managing hundreds or thousands of SKUs.
At scale, the data can be organized by producer, region, vintage, grape variety, price band, merchant, country, and bottle size. Analysts can then calculate market ranges and identify outliers. A retailer could establish an internal rule such as "review any product priced more than 15% above the observed market median." The exact threshold should depend on category economics rather than being treated as a universal benchmark.
Wine-Searcher's professional valuation documentation shows that its market-price workflows can provide average, minimum, and maximum prices and compare inventory with market conditions. Its sample distribution report also demonstrates analysis of offers, merchants, countries, vintages, and price variance.
Why historical monitoring matters
| Year | Global wine-production trend | Pricing-data implication |
|---|---|---|
| 2020 | 263.0 mhl | Establish baseline |
| 2021 | 260.8 mhl | Compare supply and price changes |
| 2022 | 263.8 mhl | Identify stable-market periods |
| 2023 | 237.3 mhl | Monitor supply pressure |
| 2024 | 225.6 mhl | Watch availability and price dispersion |
| 2025 | ~227 mhl | Compare preliminary supply conditions |
| 2026 | N/A | Use current marketplace observations |
The data shows that global production dropped sharply after 2022. For a pricing team, this does not automatically mean every wine should become more expensive. Wine is heterogeneous, and price depends on producer reputation, vintage, region, inventory, demand, currency, taxes, and merchant strategy.
That is why product-level marketplace data matters. A global production statistic gives context; individual listing data gives commercial specificity.
A scalable workflow should also deduplicate products. The same wine may appear under slightly different naming conventions, while vintage and bottle size can materially affect comparability. Normalizing these fields before analysis prevents incorrect price comparisons.
Real Data API can structure the collection process around these dimensions so businesses can create dashboards that show current market price, historical price, price range, merchant count, and availability trends.
Can API-Based Collection Simplify Wine Intelligence Workflows?
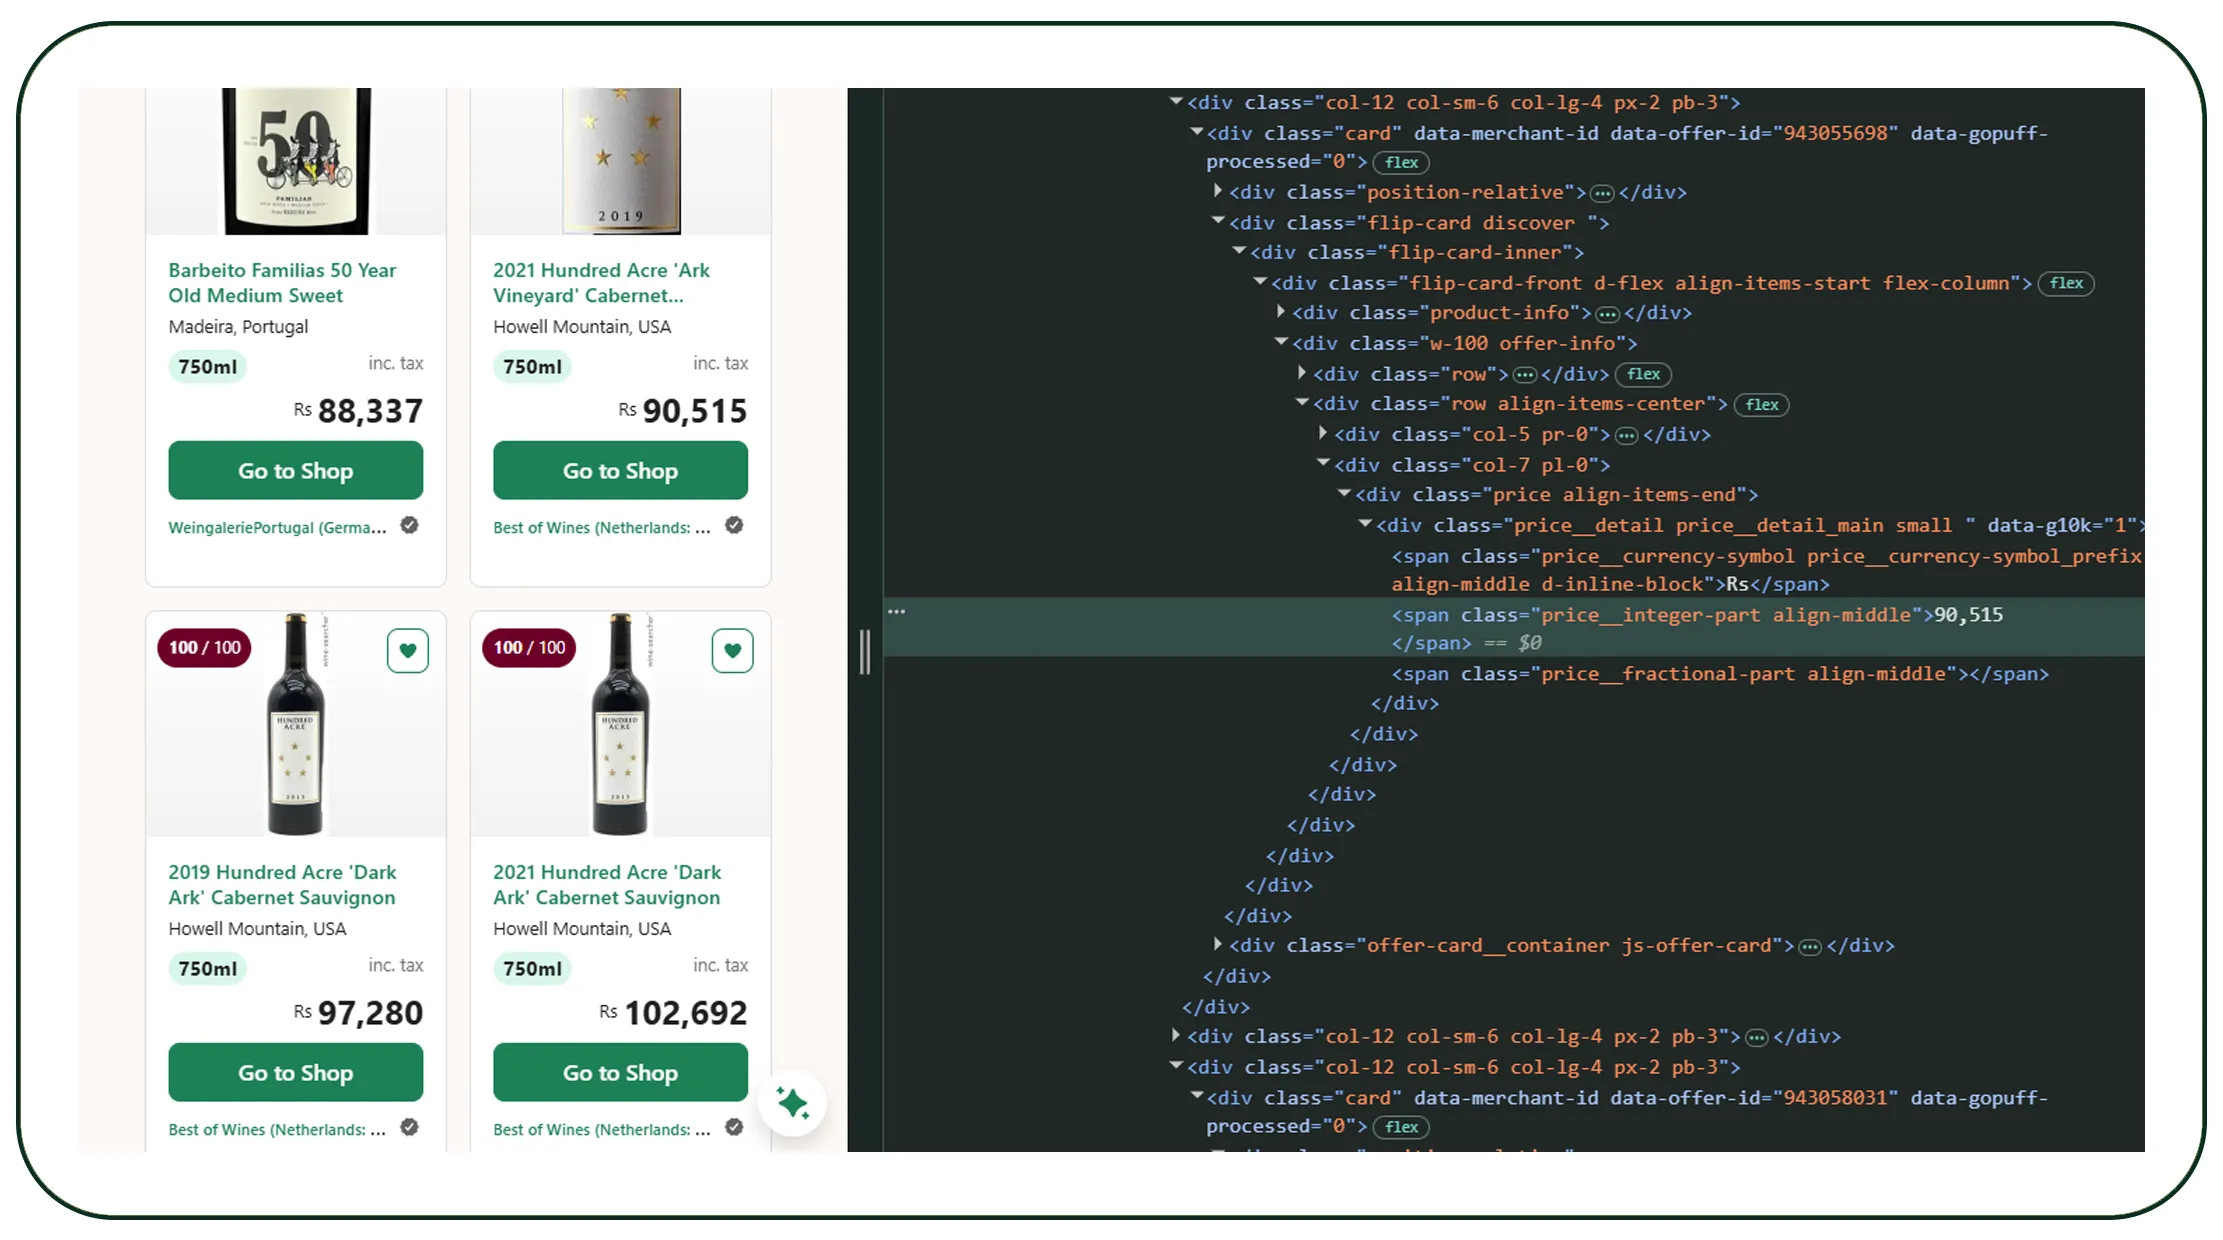
Businesses that extract Wine-Searcher wine data using API can integrate structured wine information into internal applications rather than relying entirely on manual research.
API-based workflows are particularly useful for technology companies building wine marketplaces, pricing applications, inventory systems, investment tools, analytics platforms, or research dashboards. A structured response can be transformed into a database record and linked with internal product identifiers.
Publicly documented API information associated with Wine-Searcher describes endpoints for wine checks and market prices, including parameters for wine name, vintage, currency, location, state, offer type, and response format. Businesses should use the provider's current documentation and applicable permissions rather than assuming that an API endpoint or field will remain unchanged.
Market indicators that can be joined with wine data
| Year | Global production, mhl | Example business use |
|---|---|---|
| 2020 | 263.0 | Baseline market comparison |
| 2021 | 260.8 | Historical pricing reference |
| 2022 | 263.8 | Stable-supply benchmark |
| 2023 | 237.3 | Supply-change analysis |
| 2024 | 225.6 | Availability monitoring |
| 2025 | ~227 | Preliminary market planning |
| 2026 | N/A | Current API observations |
OIV describes its statistics as internationally comparable data intended for policymakers and analysts. Combining such macro data with marketplace observations can improve interpretation.
An API workflow might capture a product record every day or at another business-defined interval. The resulting history can then answer questions such as whether a price change is temporary or persistent.
The strongest architecture normally includes four layers: extraction, normalization, storage, and analytics. Extraction retrieves the relevant records. Normalization standardizes names, currencies, vintages, units, and categories. Storage preserves historical snapshots. Analytics calculates price ranges, changes, rankings, and alerts.
For example, a wine retailer could compare today's merchant price with the previous 30-day median. A distributor could identify products with falling availability. A producer could analyze international price positioning across multiple markets.
The important point is that APIs reduce the friction between data collection and business applications. They can turn marketplace observations into reusable data assets rather than one-time research outputs.
How Can Structured Collection Support Market Research?
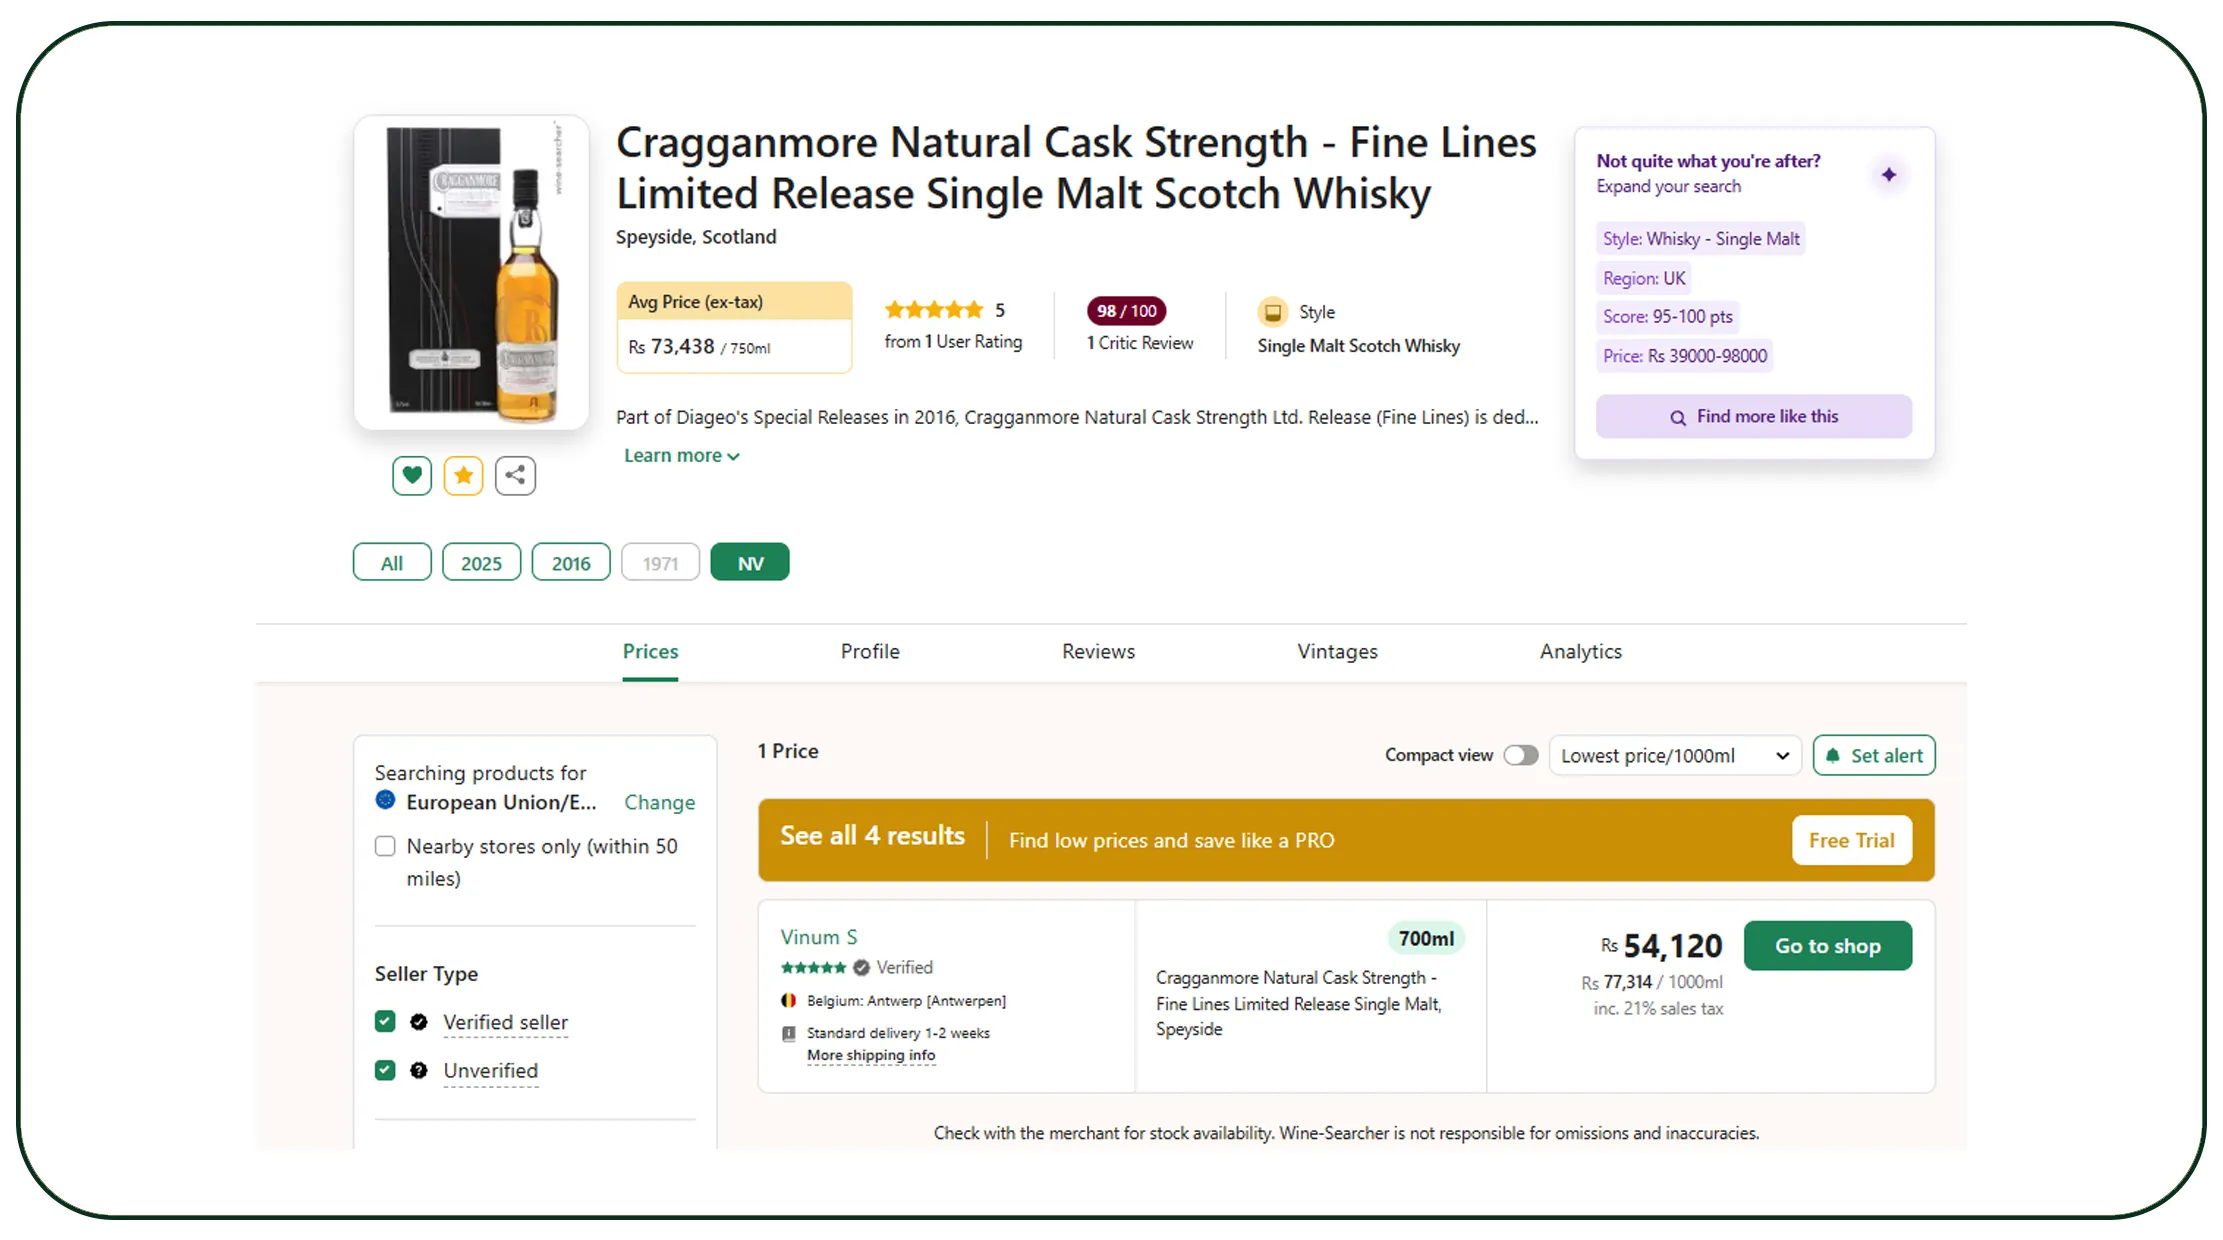
web scraping data collection services for wine market research can help research teams study the market at a level that manual browsing cannot easily support. Researchers may want to analyze thousands of products across regions, vintages, merchant types, price bands, or product categories.
Wine-Searcher itself states that its data services can help producers measure international reach, identify where wines are sold, examine pricing, track promotions, assess distribution, and identify consumer search demand by location, price category, product type, grape variety, and producer.
This creates several useful research dimensions. A category analyst can examine whether premium products are becoming more prevalent. A distributor can compare regional price positioning. A producer can investigate whether its products are widely represented across target markets. A retailer can identify products with unusually high or low merchant coverage.
Market-research context
| Year | Global production, mhl | Research question |
|---|---|---|
| 2020 | 263.0 | What was the pre-change baseline? |
| 2021 | 260.8 | Which categories gained visibility? |
| 2022 | 263.8 | Which price bands remained stable? |
| 2023 | 237.3 | Did reduced supply coincide with availability changes? |
| 2024 | 225.6 | Which markets showed stronger price dispersion? |
| 2025 | ~227 | Which trends continued? |
| 2026 | N/A | What are current marketplace signals? |
The OIV data shows three consecutive years of relatively low global production through 2025, with 2024 reaching 225.6 million hectolitres.
However, researchers should avoid claiming that marketplace price movements are caused by production alone. A credible analysis should distinguish correlation from causation. Other variables can include exchange rates, transportation costs, tariffs, taxes, promotions, inventory cycles, weather, consumer preferences, and merchant strategy.
This is where structured datasets become especially valuable. They allow analysts to test hypotheses rather than relying on assumptions.
For Real Data API clients, the research dataset can be designed around the questions the client wants to answer. Instead of collecting every available field, the project can prioritize the attributes required for pricing, assortment, competitor analysis, market-entry research, or demand intelligence.
What Can a Historical Dataset Reveal About Wine Pricing?
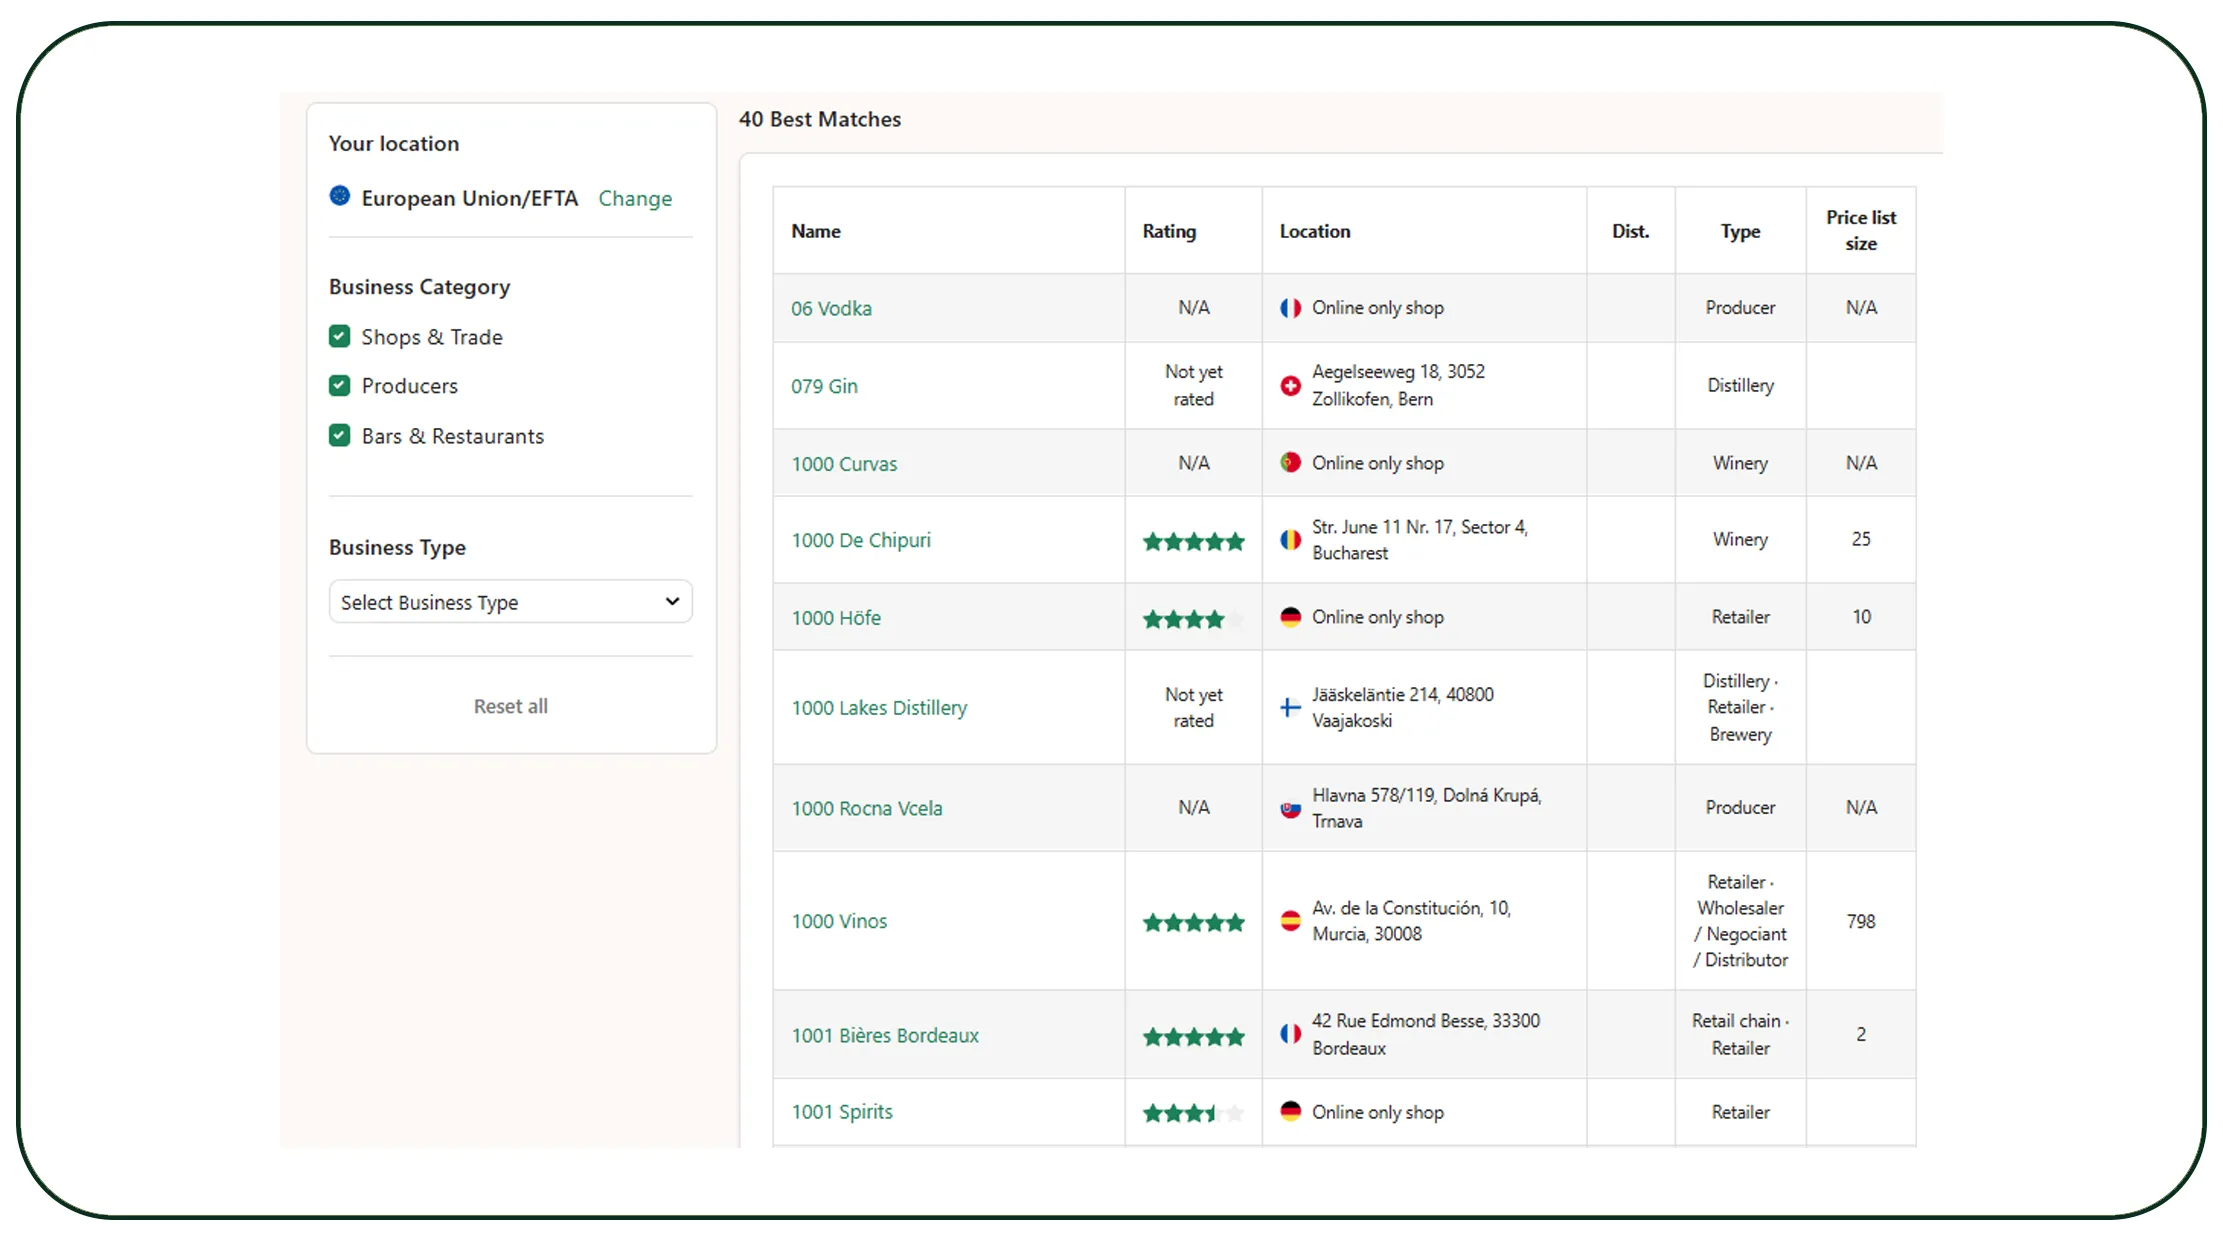
A Wine-Searcher Liquor Dataset can be structured to include wine and broader beverage information where permitted and relevant to the research scope. The exact fields should be determined by the target use case and applicable data-access terms.
Historical data is particularly useful because wine pricing is not static. Vintage changes, supply constraints, merchant inventory, promotions, and regional differences can create substantial variation.
Wine-Searcher provides price-history and market-data functionality through its professional offerings. Its product pages can show historical price and availability information, while PRO features include access to price trends.
Historical market context, 2020-2026
| Year | Global production, mhl | Historical-data opportunity |
|---|---|---|
| 2020 | 263.0 | Build initial baseline |
| 2021 | 260.8 | Compare price and availability |
| 2022 | 263.8 | Identify stable benchmarks |
| 2023 | 237.3 | Track response to supply decline |
| 2024 | 225.6 | Analyze constrained-production period |
| 2025 | ~227 | Compare preliminary recovery |
| 2026 | N/A | Capture current observations |
OIV's 2024 report says global production fell 5% from 2023 and was the lowest since 1961. This makes historical comparison particularly useful for researchers studying whether supply-side disruption is reflected in product availability and pricing.
A robust dataset can support several analytical methods. Price indices can measure category movement. Median prices can reduce the influence of extreme outliers. Merchant counts can indicate distribution breadth. Availability rates can help identify potential supply pressure. Vintage-level analysis can separate product-age effects from general market movement.
For example, suppose a particular vintage has fewer active offers in 2026 than in previous observations while its median listed price increases. That combination deserves investigation. It may indicate scarcity, but it could also result from changes in merchant participation or regional coverage.
Researchers should therefore preserve raw observations alongside calculated metrics. This makes the analysis auditable and allows teams to revisit assumptions later.
Can Competitor Data Be Compared Across Wine Platforms?
A Wine.com Scraper can be useful when a business wants to compare marketplace observations from multiple sources, subject to each platform's terms, access methods, and applicable permissions. Cross-platform comparison can help identify differences in product availability, pricing, promotions, and assortment.
The key challenge is product matching. Wine names can vary between platforms, and vintage, bottle size, producer, and region can determine whether two listings are genuinely comparable.
Cross-market data framework
| Year | Global production, mhl | Recommended comparison |
|---|---|---|
| 2020 | 263.0 | Establish cross-platform baseline |
| 2021 | 260.8 | Compare category coverage |
| 2022 | 263.8 | Benchmark price positioning |
| 2023 | 237.3 | Track changes during lower production |
| 2024 | 225.6 | Compare availability and price dispersion |
| 2025 | ~227 | Review continued market effects |
| 2026 | N/A | Compare current marketplace snapshots |
The broader wine market has experienced significant production fluctuations. OIV's 2025 sector assessment states that global production remained low for a third consecutive year and that global wine trade value remained significantly above pre-COVID levels even though both volume and value declined in 2025.
For competitive pricing, this means businesses should not compare products only by headline price. A better framework includes:
- Product and vintage matching.
- Bottle-size normalization.
- Currency conversion.
- Tax and shipping treatment.
- Merchant location.
- Availability status.
- Rating and review signals.
- Price history.
- Promotion or discount indicators.
This allows a business to calculate a comparable effective price rather than treating every displayed price as directly equivalent.
The same methodology can be applied to regional analysis. A producer entering a new market could compare its own positioning with comparable products in the target country. A distributor could identify products that are significantly cheaper in one geography than another, then investigate the commercial reasons.
The role of automated extraction is therefore to create the underlying observation layer. The business intelligence system determines how those observations are interpreted.
Why Choose Real Data API?
Real Data API can help wine businesses create scalable data pipelines for competitive intelligence, pricing research, assortment monitoring, and market analysis. The focus should be on structured, repeatable, decision-ready information rather than unprocessed page captures.
Web Scraping Vintage Wines Prices can support historical price benchmarking when the required data is legally and technically accessible. Vintage-level pricing is especially valuable for collectors, retailers, distributors, insurers, producers, and investment-research teams because vintage differences can materially affect comparability.
Wine-Searcher's professional valuation service demonstrates the commercial value of benchmarking wine inventory against average, minimum, and maximum market prices. It states that its valuation process references current prices from a global database and identifies matching wines, spirits, and vintages.
Real Data API can structure projects around fields such as:
| Data layer | Example fields | Business purpose |
|---|---|---|
| Product | Producer, wine, region, grape | Product matching |
| Vintage | Vintage year, bottle size | Comparable pricing |
| Pricing | Current price, currency, price range | Competitive monitoring |
| Merchant | Store, country, location | Seller benchmarking |
| Availability | In-stock/listed status | Supply monitoring |
| Reputation | Ratings, critic scores, reviews | Product positioning |
| History | Timestamped observations | Trend analysis |
The resulting dataset can feed dashboards, spreadsheets, BI platforms, internal databases, or analytical models. Validation rules can identify missing vintages, duplicate products, inconsistent currencies, or unexpected price changes before the information reaches decision-makers.
A good data pipeline should also preserve collection timestamps. Without timestamps, a price dataset becomes a static snapshot. With timestamps, it becomes a market-history resource.
Conclusion
web scraping wine market data via Wine-Searcher can help businesses transform fragmented wine marketplace observations into structured competitive intelligence. The strongest use cases combine product identification, vintage information, merchant listings, prices, availability, ratings, geography, and historical observations.
The commercial value comes from context. A single price does not explain a market. A dataset showing the minimum, median, maximum, merchant count, availability, and historical movement provides a much stronger basis for pricing decisions.
Public data also demonstrates why this matters. OIV estimates show global wine production falling from 263.0 million hectolitres in 2020 to 225.6 million in 2024, with 2025 preliminary production around 227 million hectolitres. Meanwhile, Wine-Searcher reports millions of listings and extensive global search activity, while its trade services explicitly support price benchmarking, distribution analysis, and market intelligence.
For retailers, the opportunity is better price positioning. For distributors, it is stronger market and assortment intelligence. For producers, it is improved visibility into distribution and international positioning. For researchers, it is the ability to analyze historical marketplace signals at scale.
The best implementation should combine automated collection, product matching, data validation, timestamped storage, analytics, and business-specific alerts. It should also respect the applicable website terms, API agreements, access controls, and legal requirements.
Build a scalable wine-market intelligence pipeline with Real Data API and turn structured marketplace data into faster, evidence-based competitive pricing decisions!
Latest posts
How Web Scraping Wine Market Data Via Wine-Searcher Helps Extract Real-Time Wine Market Data For Competitive Pricing?

How To Use Automated Zara Web Scraping For Fashion Market Research To Analyze Pricing, Products, And Consumer Demand?
How Meesho Marketplace Data Extraction For Businesses Solves Inventory, Pricing, And Product Assortment Problems?
How To Solve Product Data Tracking Challenges At Scale with Costco Web Data Scraper For Product Information






.png)



