Introduction
Businesses can solve inventory, pricing, and assortment challenges by converting marketplace listings into structured, comparable datasets. Meesho marketplace data extraction for businesses helps brands, retailers, sellers, and market-research teams monitor product prices, seller activity, availability, ratings, reviews, and catalog changes at scale. A Meesho Scraper can automate repetitive collection so decision-makers spend less time manually checking listings and more time acting on market signals.
The scale of Meesho makes this particularly important. Its official investor information reports 274 million+ annual transacting users, 1.04 million+ annual transacting sellers, and 2.83 billion+ placed orders for the quarter ended June 30, 2026. Earlier filings show placed orders increased from 1.02 billion in FY2023 to 1.34 billion in FY2024 and 1.83 billion in FY2025.
For businesses, this means marketplace intelligence cannot depend on occasional manual checks. Automated product data collection creates a repeatable foundation for competitive pricing, assortment planning, seller benchmarking, inventory monitoring, and demand analysis.
How Can Product-Level Intelligence Improve Competitive Decisions?
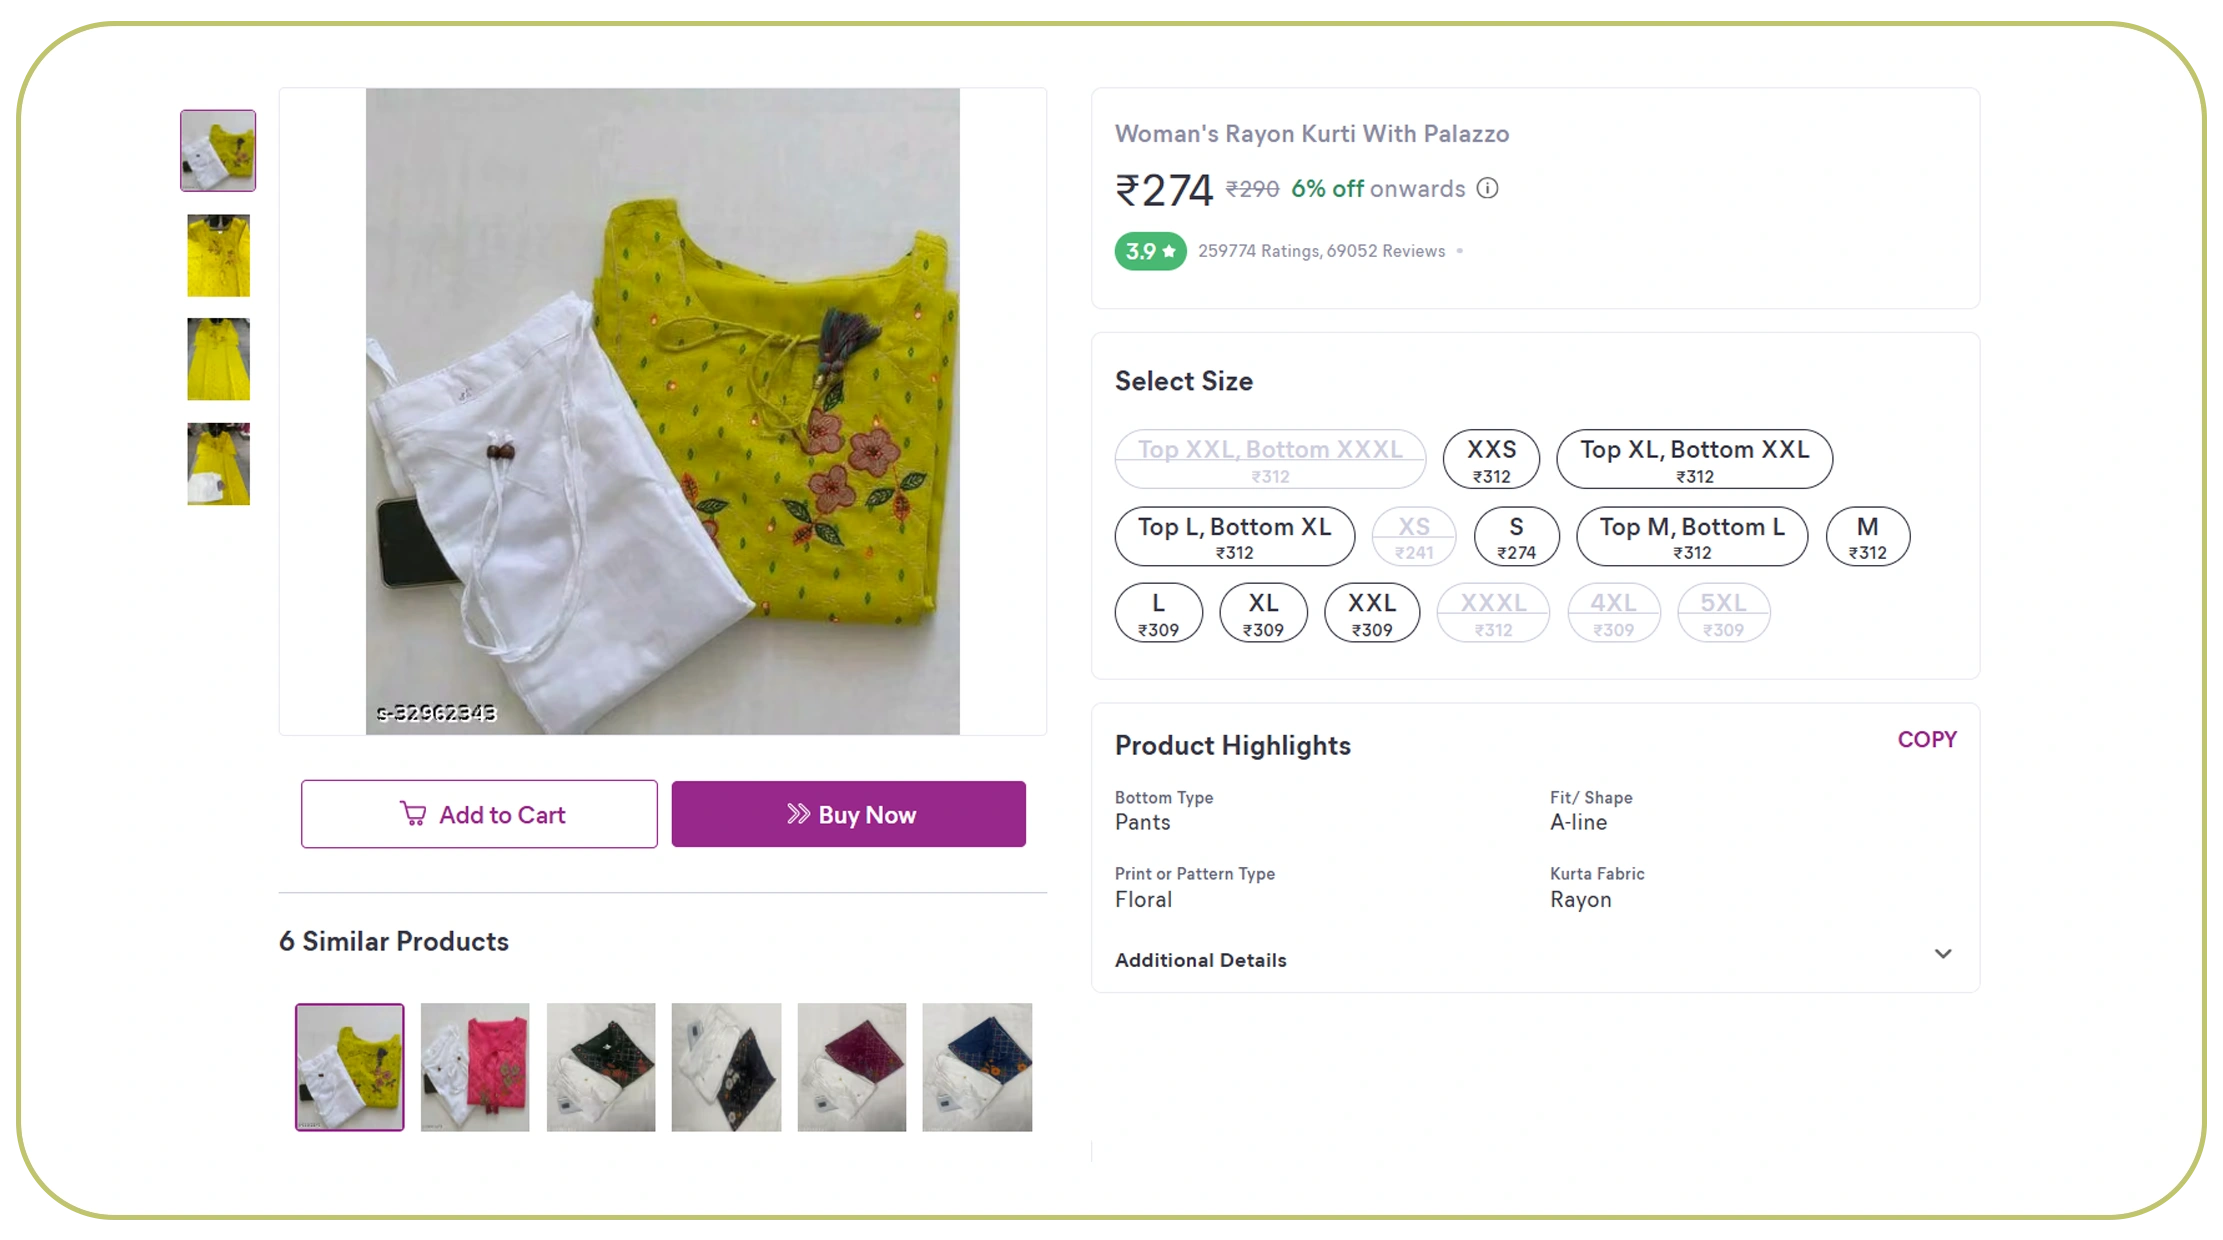
Meesho product data scraping for competitive analysis enables businesses to convert marketplace listings into structured intelligence. Instead of checking individual product pages, teams can collect fields such as product name, SKU or product identifier, category, brand, seller, price, discount, rating, review count, availability, and product attributes.
This is particularly useful for businesses operating in categories where multiple sellers compete around similar products. A retailer can compare its own price against comparable listings, identify unusually aggressive competitors, and determine whether a product is becoming crowded. Product-level data can also reveal assortment gaps. If several competing sellers introduce similar products while a company's catalog remains unchanged, the business can investigate whether demand is shifting.
Meesho's scale reinforces the need for systematic analysis. Its disclosed data shows 198.77 million annual transacting users and 513,757 annual transacting sellers in FY2025. The platform therefore represents a substantial source of competitive signals rather than a small marketplace sample.
Data-coverage table — 2020-2026:
Historical figures below are limited to publicly disclosed Meesho metrics; "N/D" means the cited source does not disclose a comparable figure.
| Year | Annual transacting users | Annual transacting sellers | Placed orders |
|---|---|---|---|
| 2020 | N/D | N/D | N/D |
| 2021 | N/D | N/D | N/D |
| 2022 | N/D | N/D | N/D |
| 2023 | 136.40M | 449,966 | 1.024B |
| 2024 | 155.64M | 423,749 | 1.342B |
| 2025 | 198.77M | 513,757 | 1.834B |
| 2026* | 274M+ | 1.04M+ | 2.83B+ |
*2026 figures are for the quarter ended June 30, 2026 and are not directly comparable with full-year figures.
The practical outcome is better competitor benchmarking. Businesses can identify pricing clusters, monitor assortment expansion, compare seller positioning, and build category-level dashboards. This supports faster commercial decisions without relying on subjective browsing.
How Does Automated Collection Make Marketplace Monitoring More Scalable?

A web data scraper for Meesho marketplace data can help businesses move from manual observation to systematic monitoring. Manual research becomes difficult when product catalogs contain thousands of listings and prices change frequently. Even when analysts can collect information accurately, repeating the exercise every day or week consumes considerable operational time.
Automated extraction can capture standardized records according to a defined schedule. A business might collect product information daily, while a pricing team could monitor selected categories more frequently. The resulting dataset can then feed dashboards, spreadsheets, databases, analytics systems, or internal applications.
This approach also improves consistency. Every extraction cycle can follow the same fields and business rules, making historical comparisons easier. For example, a retailer can compare current prices with previous observations, identify products that disappeared from listings, or flag sellers whose ratings changed significantly.
Meesho's operational growth illustrates why scalable monitoring matters. Annual transacting users rose from 136.40 million in FY2023 to 198.77 million in FY2025, while placed orders increased from 1.024 billion to 1.834 billion.
| Year | Orders | Order-frequency context |
|---|---|---|
| 2020 | N/D | N/D |
| 2021 | N/D | N/D |
| 2022 | N/D | N/D |
| 2023 | 1.024B | 7.51 |
| 2024 | 1.342B | 8.62 |
| 2025 | 1.834B | 9.23 |
| 2026* | 2.83B+ | N/D |
*2026 is the official investor-reported figure for the quarter ended June 30, 2026; the frequency metric is not presented as a comparable full-year figure.
For a business, the value is not simply collecting more records. It is creating a dependable observation layer. Teams can establish thresholds for price changes, seller additions, product availability, review growth, and catalog movement. These alerts can then trigger further analysis.
The strongest implementations connect extracted data to business workflows. Pricing teams can receive exception reports, category managers can review assortment changes, and analysts can study historical trends without manually rebuilding datasets.
Can Automated Listing Extraction Improve Inventory and Assortment Planning?
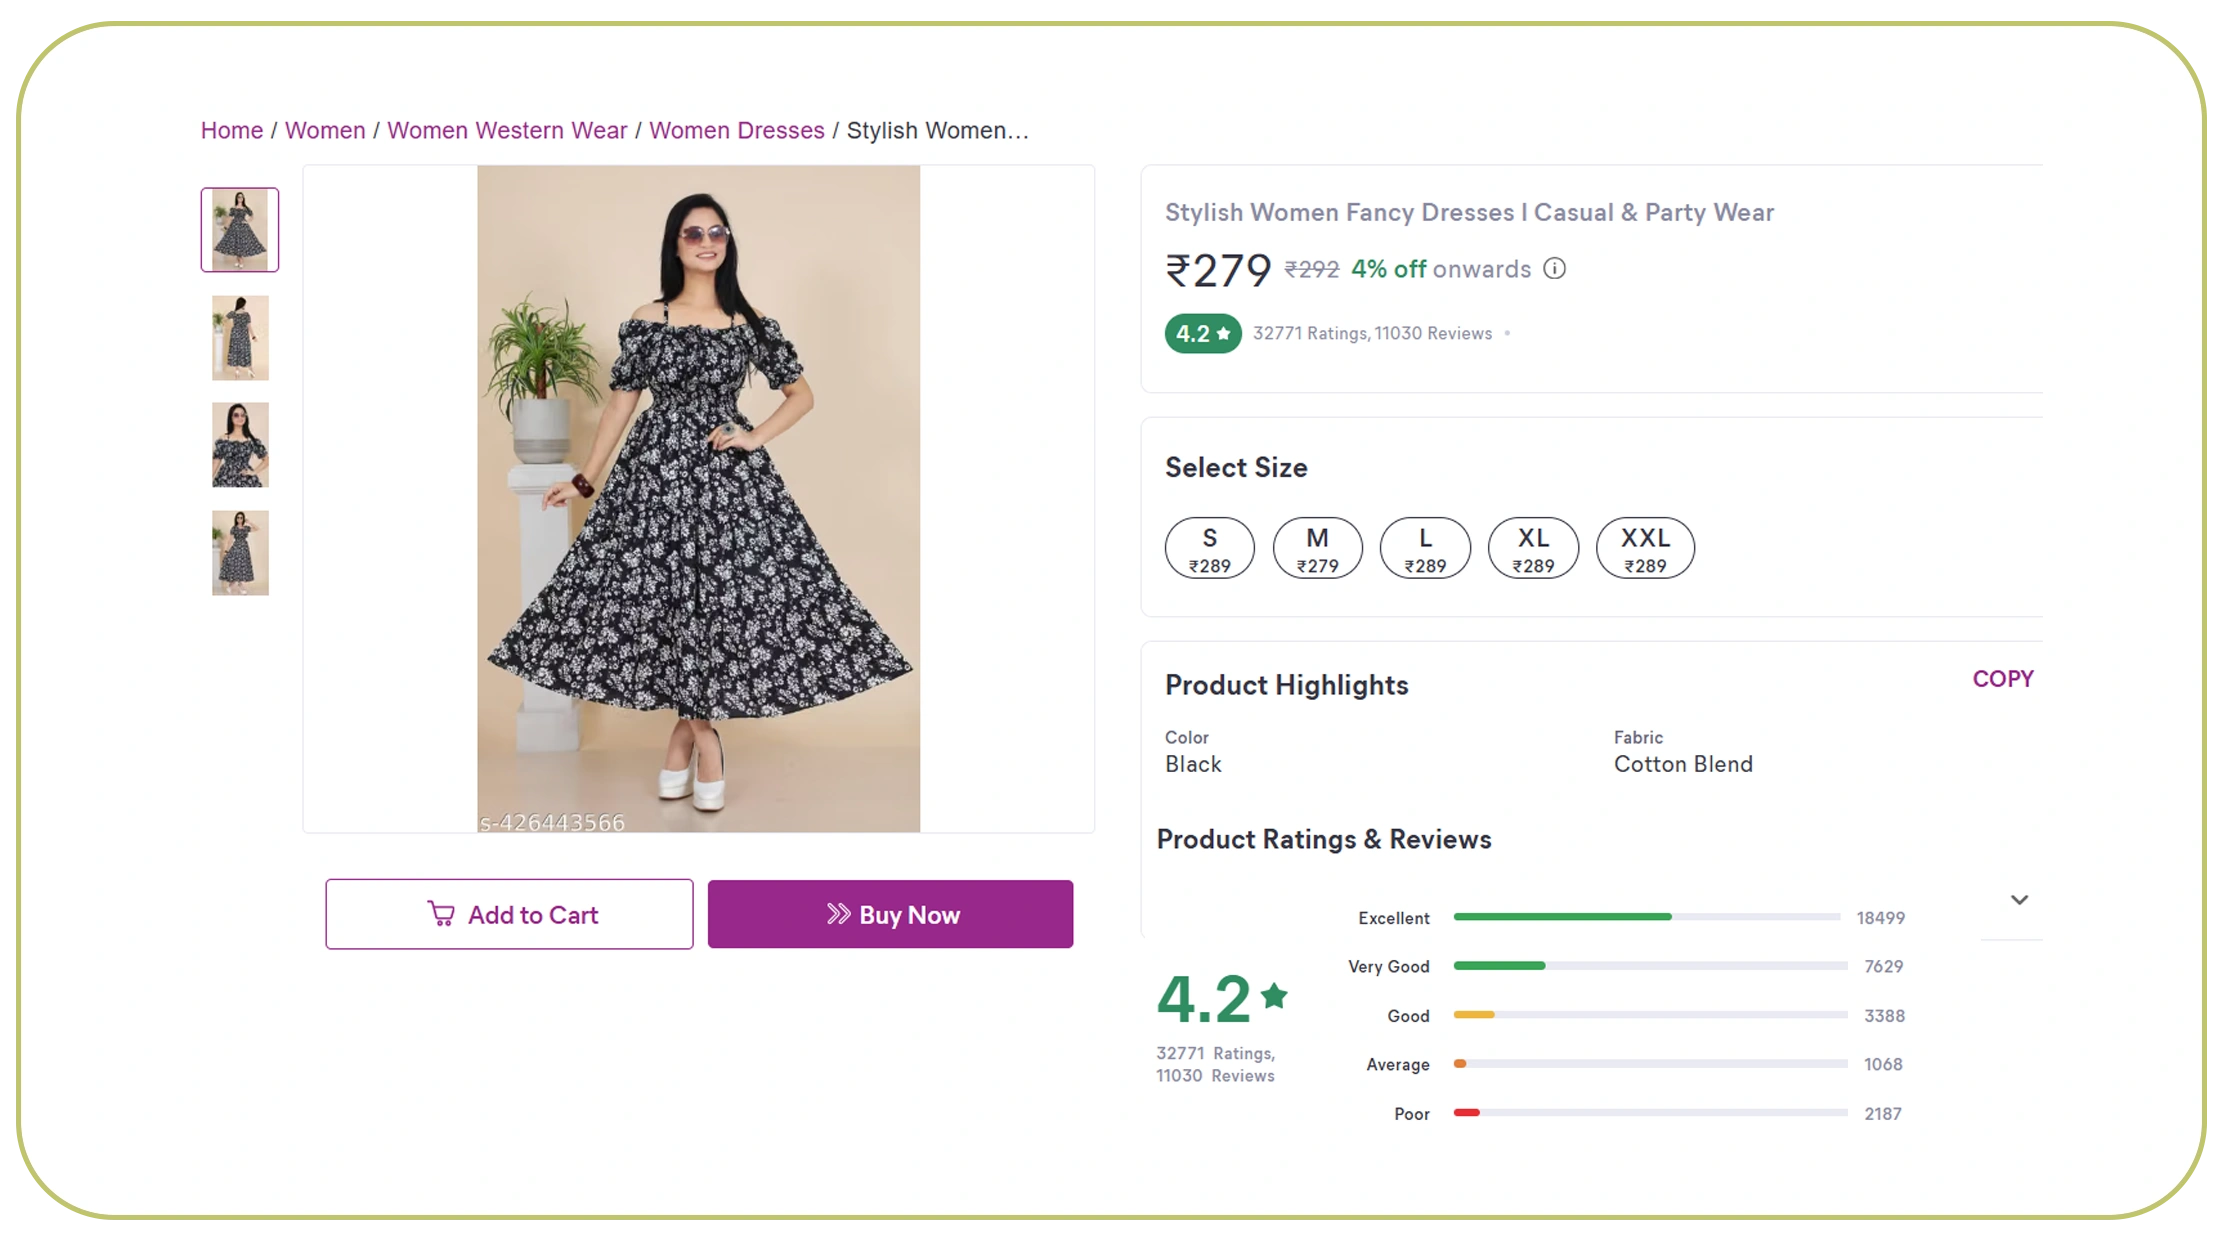
Businesses frequently struggle to determine which products deserve more attention, which items are becoming less competitive, and where new assortment opportunities exist. extract Meesho product listings automatically can address this by creating a structured historical view of marketplace assortment.
Consider a business monitoring women's fashion, beauty, home products, or accessories. It can track the number of comparable products, price ranges, seller counts, ratings, review volumes, and availability status. Over time, these observations can reveal whether a category is expanding or contracting and whether competition is becoming more concentrated.
Meesho's own filings show how quickly transaction activity has expanded. Placed orders grew 36.70% from FY2024 to FY2025, reaching 1.834 billion in FY2025. The six months ended September 30, 2025 recorded 1.261 billion placed orders, up 52.94% year over year from 824.59 million in the comparable period.
| Period | Placed orders | YoY growth |
|---|---|---|
| 2020 | N/D | N/D |
| 2021 | N/D | N/D |
| 2022 | N/D | N/D |
| FY2023 | 1.024B | --- |
| FY2024 | 1.342B | 31.01% |
| FY2025 | 1.834B | 36.70% |
| H1 FY2026 | 1.261B | 52.94% |
Source: Meesho disclosed operational KPIs. H1 FY2026 refers to the six months ended September 30, 2025.
These numbers demonstrate why static assortment research can quickly become outdated. Businesses can use historical listing data to identify products that repeatedly remain available, products that frequently disappear, and products where competitor activity accelerates.
For inventory planning, the extracted dataset should not be treated as a direct sales forecast. Marketplace availability is only one signal. Instead, it should be combined with internal sales, inventory, advertising, seasonality, and demand data. This produces a stronger decision framework while avoiding unsupported assumptions about actual marketplace sales.
How Can Real-Time Data Support Faster Pricing Decisions?

A real-time Meesho marketplace data API can give businesses a structured mechanism for integrating marketplace observations into their own technology stack. Rather than waiting for analysts to download reports, companies can design workflows where relevant product, pricing, seller, and availability information becomes available to internal systems according to their operational requirements.
Pricing is one of the clearest applications. Suppose a retailer sells products that compete with several Meesho listings. A monitoring system can compare observed prices, discounts, ratings, and seller information against predefined thresholds. When a meaningful change occurs, the business can investigate whether its own pricing or assortment needs attention.
Meesho's average order value declined from ₹336.71 in FY2023 to ₹298.36 in FY2024 and ₹274.27 in FY2025, while placed orders increased during the same period. This combination highlights why businesses should monitor both price-related signals and transaction-scale indicators rather than relying on a single metric.
| Year/period | Marketplace AOV | GMV |
|---|---|---|
| 2020 | N/D | N/D |
| 2021 | N/D | N/D |
| 2022 | N/D | N/D |
| FY2023 | ₹336.71 | ₹344.91B |
| FY2024 | ₹298.36 | ₹400.38B |
| FY2025 | ₹274.27 | ₹503.12B |
| H1 FY2026 | ₹265.50 | ₹334.83B |
H1 FY2026 covers six months ended September 30, 2025 and therefore should not be directly compared with a full fiscal year.
For technology teams, the API layer can also support centralized storage, scheduled extraction, transformation, validation, and downstream analytics. For commercial teams, it can translate into cleaner dashboards and faster alerts.
The key principle is that "real-time" should be defined according to the business requirement. Not every category requires second-by-second monitoring. Some businesses need daily snapshots; others may need more frequent checks for highly volatile pricing. Matching extraction frequency to business value keeps the system efficient.
What Can Businesses Build With Marketplace APIs?
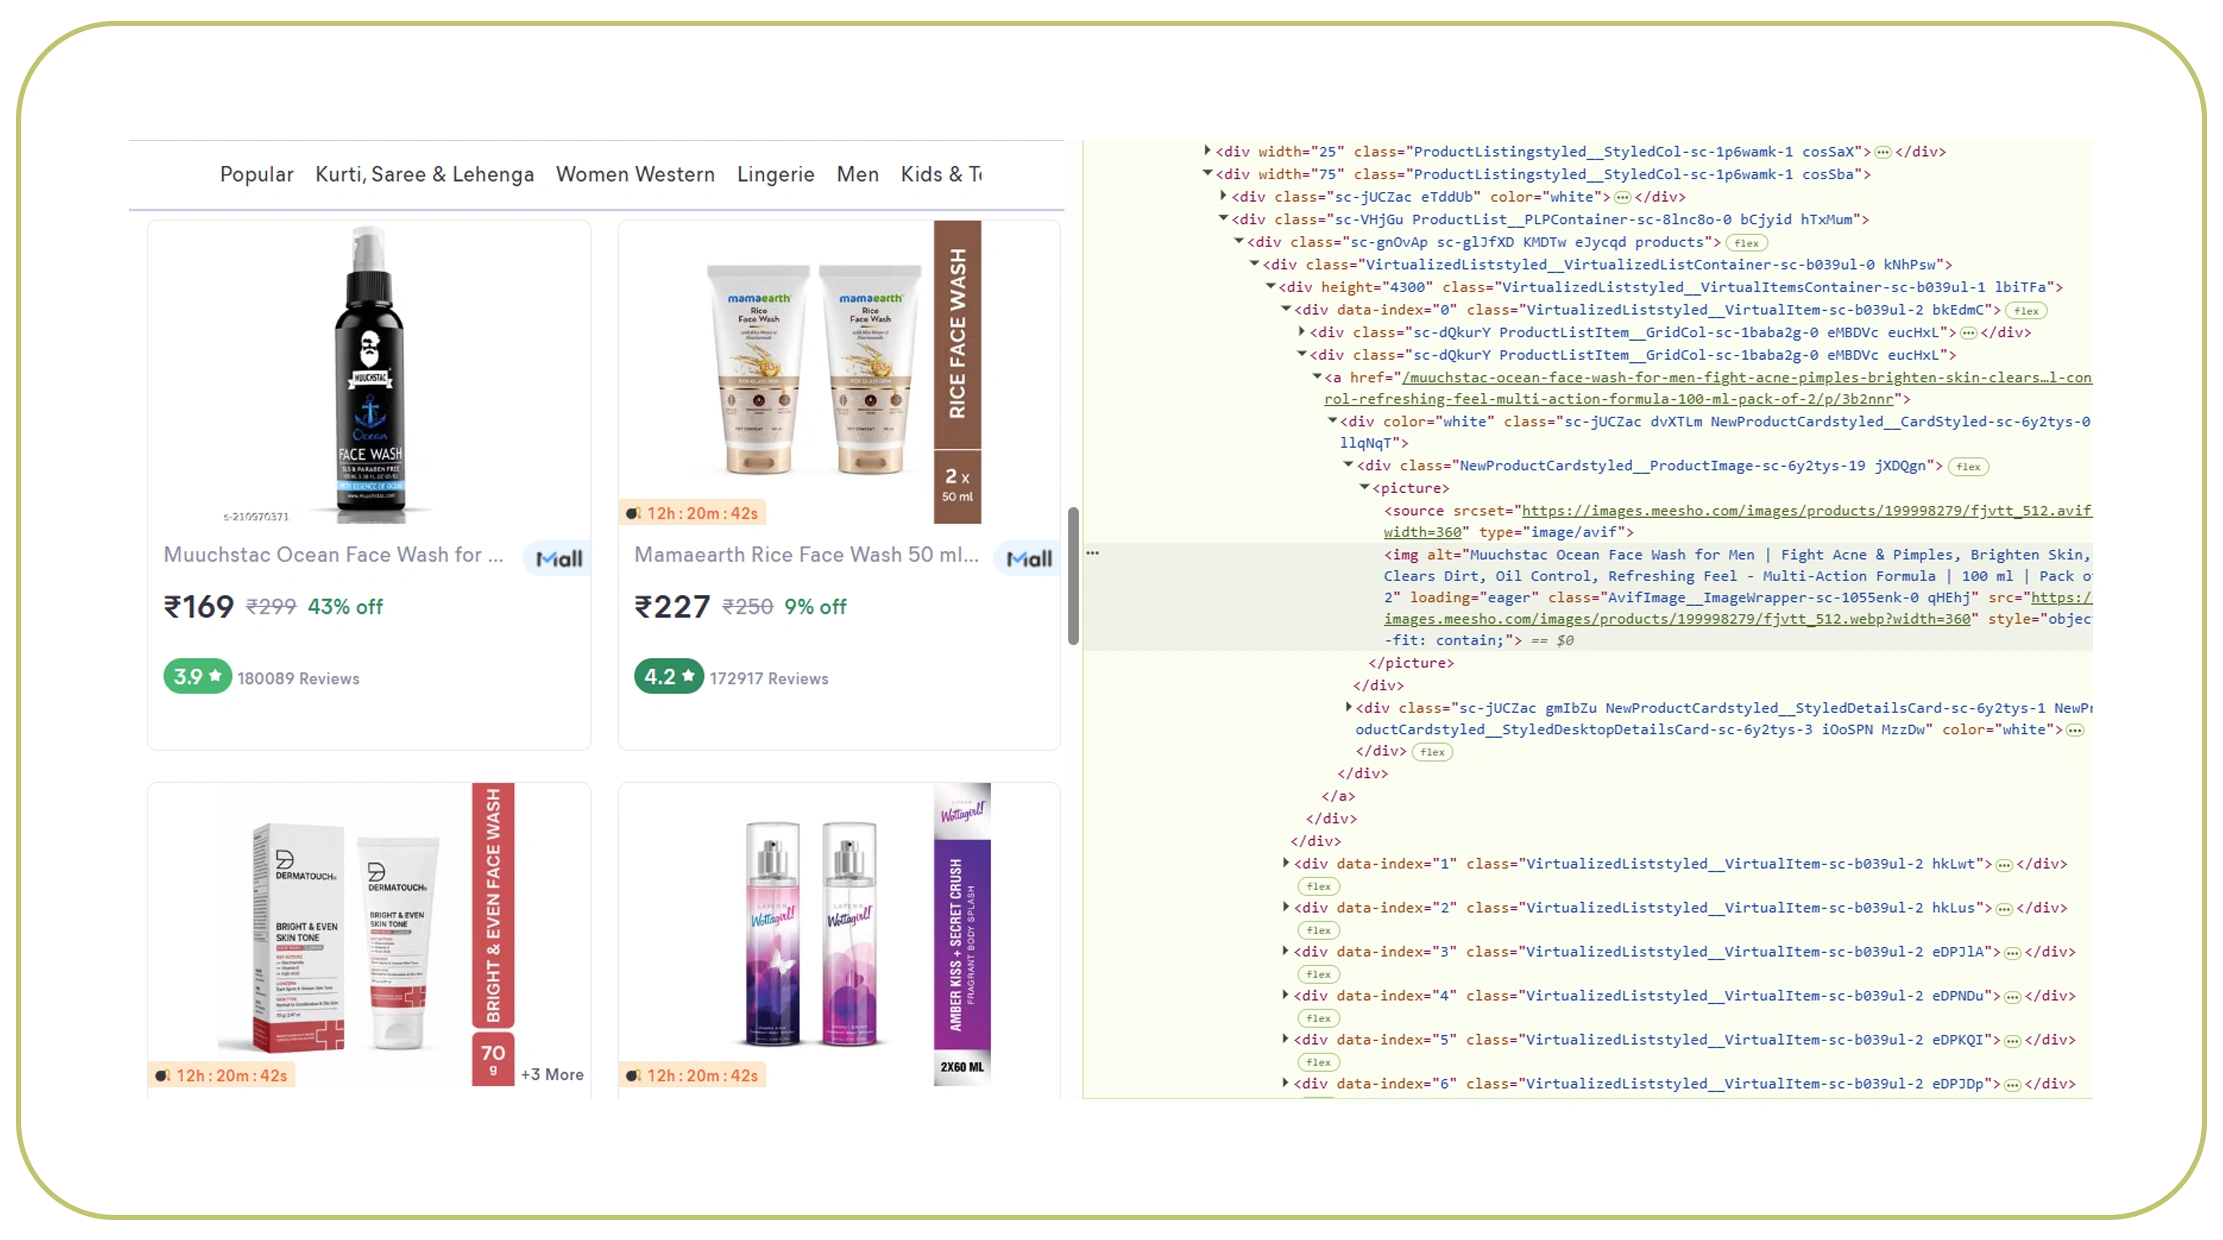
A Meesho API can become part of a broader marketplace intelligence architecture when businesses need repeatable access to structured data for analytics. The important consideration is not simply acquiring raw records but designing a workflow that transforms those records into decisions.
A typical architecture can include collection, validation, normalization, storage, analytics, and reporting layers. Product records can be standardized around identifiers and categories, while pricing observations can be timestamped to create historical series. Seller information can be analyzed separately to understand competitive density.
The scale of Meesho makes this architecture increasingly relevant. FY2025 marketplace GMV was ₹503.12 billion, compared with ₹400.38 billion in FY2024 and ₹344.91 billion in FY2023.
| Year | Marketplace GMV | Marketplace NMV |
|---|---|---|
| 2020 | N/D | N/D |
| 2021 | N/D | N/D |
| 2022 | N/D | N/D |
| FY2023 | ₹344.91B | ₹192.33B |
| FY2024 | ₹400.38B | ₹232.41B |
| FY2025 | ₹503.12B | ₹299.88B |
| H1 FY2026 | ₹334.83B | ₹191.94B |
The H1 FY2026 figures cover six months ended September 30, 2025.
Businesses can use the resulting dataset for competitor dashboards, price-history analysis, assortment comparison, seller benchmarking, product discovery, category research, and anomaly detection. A useful implementation also maintains timestamps because marketplace information is dynamic.
Data quality deserves equal attention. Duplicate listings, missing attributes, inconsistent product names, seller changes, unavailable pages, and temporary price fluctuations can distort analysis. Validation rules should therefore be incorporated before data reaches decision-making dashboards.
The objective should be a trusted marketplace data layer rather than an oversized collection of unprocessed listings. When data is normalized and historically stored, analysts can compare current marketplace conditions with previous observations and identify meaningful changes.
How Can an API-Based Scraping System Bring Everything Together?

A Meesho Scraping API can provide the automation layer required to collect and structure marketplace information at scale. For companies evaluating Meesho marketplace data extraction for businesses, the most useful approach is to connect extraction with clearly defined commercial questions.
For pricing, the system should capture current and historical prices, discounts, and comparable products. For assortment planning, it should track product categories, attributes, seller counts, and availability. For competitive intelligence, it should monitor seller activity, ratings, reviews, and catalog changes.
The business case becomes stronger when the extracted dataset is connected to internal information. Marketplace pricing can be compared with a company's own prices. Competitor assortment can be compared with inventory. Product popularity signals can be assessed alongside internal sales performance.
| Year/period | Users | Sellers | Orders |
|---|---|---|---|
| 2020 | N/D | N/D | N/D |
| 2021 | N/D | N/D | N/D |
| 2022 | N/D | N/D | N/D |
| FY2023 | 136.40M | 449,966 | 1.024B |
| FY2024 | 155.64M | 423,749 | 1.342B |
| FY2025 | 198.77M | 513,757 | 1.834B |
| Q1 FY2027* | 274M+ | 1.04M+ | 2.83B+ |
*Q1 FY2027 refers to the quarter ended June 30, 2026. The official investor page reports these figures as platform-scale metrics and they are not directly comparable with annual fiscal-year figures.
This scale creates three practical priorities. First, businesses need standardized extraction so data from different categories can be compared. Second, they need historical snapshots so price and assortment changes can be measured. Third, they need delivery mechanisms that make the data accessible to analytics and business systems.
A robust implementation should also include validation, retry handling, duplicate detection, timestamps, structured schemas, and monitoring for changes in marketplace page structures. These technical safeguards improve dataset reliability and reduce the risk of basing decisions on incomplete observations.
For decision-makers, the final output should be simple: identify what changed, quantify the change, explain why it matters, and recommend what requires investigation.
Why Choose Real Data API?
Real Data API can help businesses build a structured marketplace intelligence workflow instead of relying on manual browsing. The focus should be on usable data, scalable extraction, consistent schemas, and integration-ready outputs.
Extract Product, Pricing, and Seller Data from Meesho workflows can support product research, competitor benchmarking, price monitoring, assortment analysis, seller intelligence, and historical marketplace studies. The resulting information can be organized according to the fields and frequency required by the business.
For organizations evaluating Meesho marketplace data extraction for businesses, scalability is especially important because marketplace catalogs can contain large numbers of products and sellers. Automated collection reduces repetitive research and provides a foundation for recurring analysis.
The strongest implementation combines marketplace observations with internal business data. Product availability can be compared with inventory. Competitor pricing can be compared with internal prices. Seller activity can be evaluated alongside category performance. Historical datasets can then reveal changes that individual snapshots cannot show.
Conclusion
Meesho marketplace data extraction for businesses gives brands, retailers, sellers, analysts, and technology teams a scalable way to monitor marketplace conditions. Structured product, pricing, seller, availability, rating, and review data can support better competitive analysis, pricing decisions, inventory planning, and assortment optimization.
The most effective strategy is not simply collecting the largest possible dataset. Businesses should define the decisions they want to improve, select the relevant marketplace fields, establish appropriate extraction frequency, maintain historical records, validate data quality, and connect the resulting information with internal analytics.
Publicly disclosed Meesho metrics demonstrate the scale and growth of the marketplace, with 1.834 billion placed orders and ₹503.12 billion marketplace GMV in FY2025, followed by further reported platform growth in 2026.
Build a reliable marketplace intelligence pipeline with Real Data API and turn Meesho marketplace data into actionable pricing, inventory, and assortment insights!
Latest posts
How To Solve Product Data Tracking Challenges At Scale with Costco Web Data Scraper For Product Information
Truthsocial Data Scraping For Real-Time Social Media Insights

Zara Web Data Scraper For Fashion Trend Analysis - How Retailers Overcome Fast-Changing Fashion Demand & Inventory Challenges
How Real Estate Web Scraping Using Bayut API Solves Rental Pricing and Property Tracking Problems?






.png)



