Introduction
The fastest way to solve large-scale product tracking is to replace manual catalog research with a structured, automated data pipeline. Costco web data scraper for product information can help brands, retailers, market researchers, and e-commerce teams collect product attributes, pricing, availability, reviews, and category information consistently at scale.
Costco is a particularly useful source for retail intelligence because its digital business has expanded significantly. Costco reported fiscal 2025 net sales of $269.9 billion, up 8.1% year over year, while e-commerce comparable sales increased 15.6%. In fiscal 2026, Costco continued reporting strong digitally enabled sales growth, with 20.9% growth for May and 21.1% for the first 39 weeks.
For a buyer persona such as an e-commerce intelligence manager, pricing analyst, marketplace researcher, retail consultant, or data-product company, the core challenge is not finding one Costco product. The challenge is maintaining accurate information across thousands of products while prices, inventory, descriptions, reviews, and assortments change.
A Costco Scraping API can address that problem by providing a repeatable mechanism for collecting structured product information and delivering it into databases, dashboards, analytics systems, or research workflows.
The sections below explain how a scalable approach can solve common product tracking problems, from competitor analysis and price monitoring to review datasets and real-time intelligence.
How Can Retailers Improve Competitive Research With Structured Product Data?
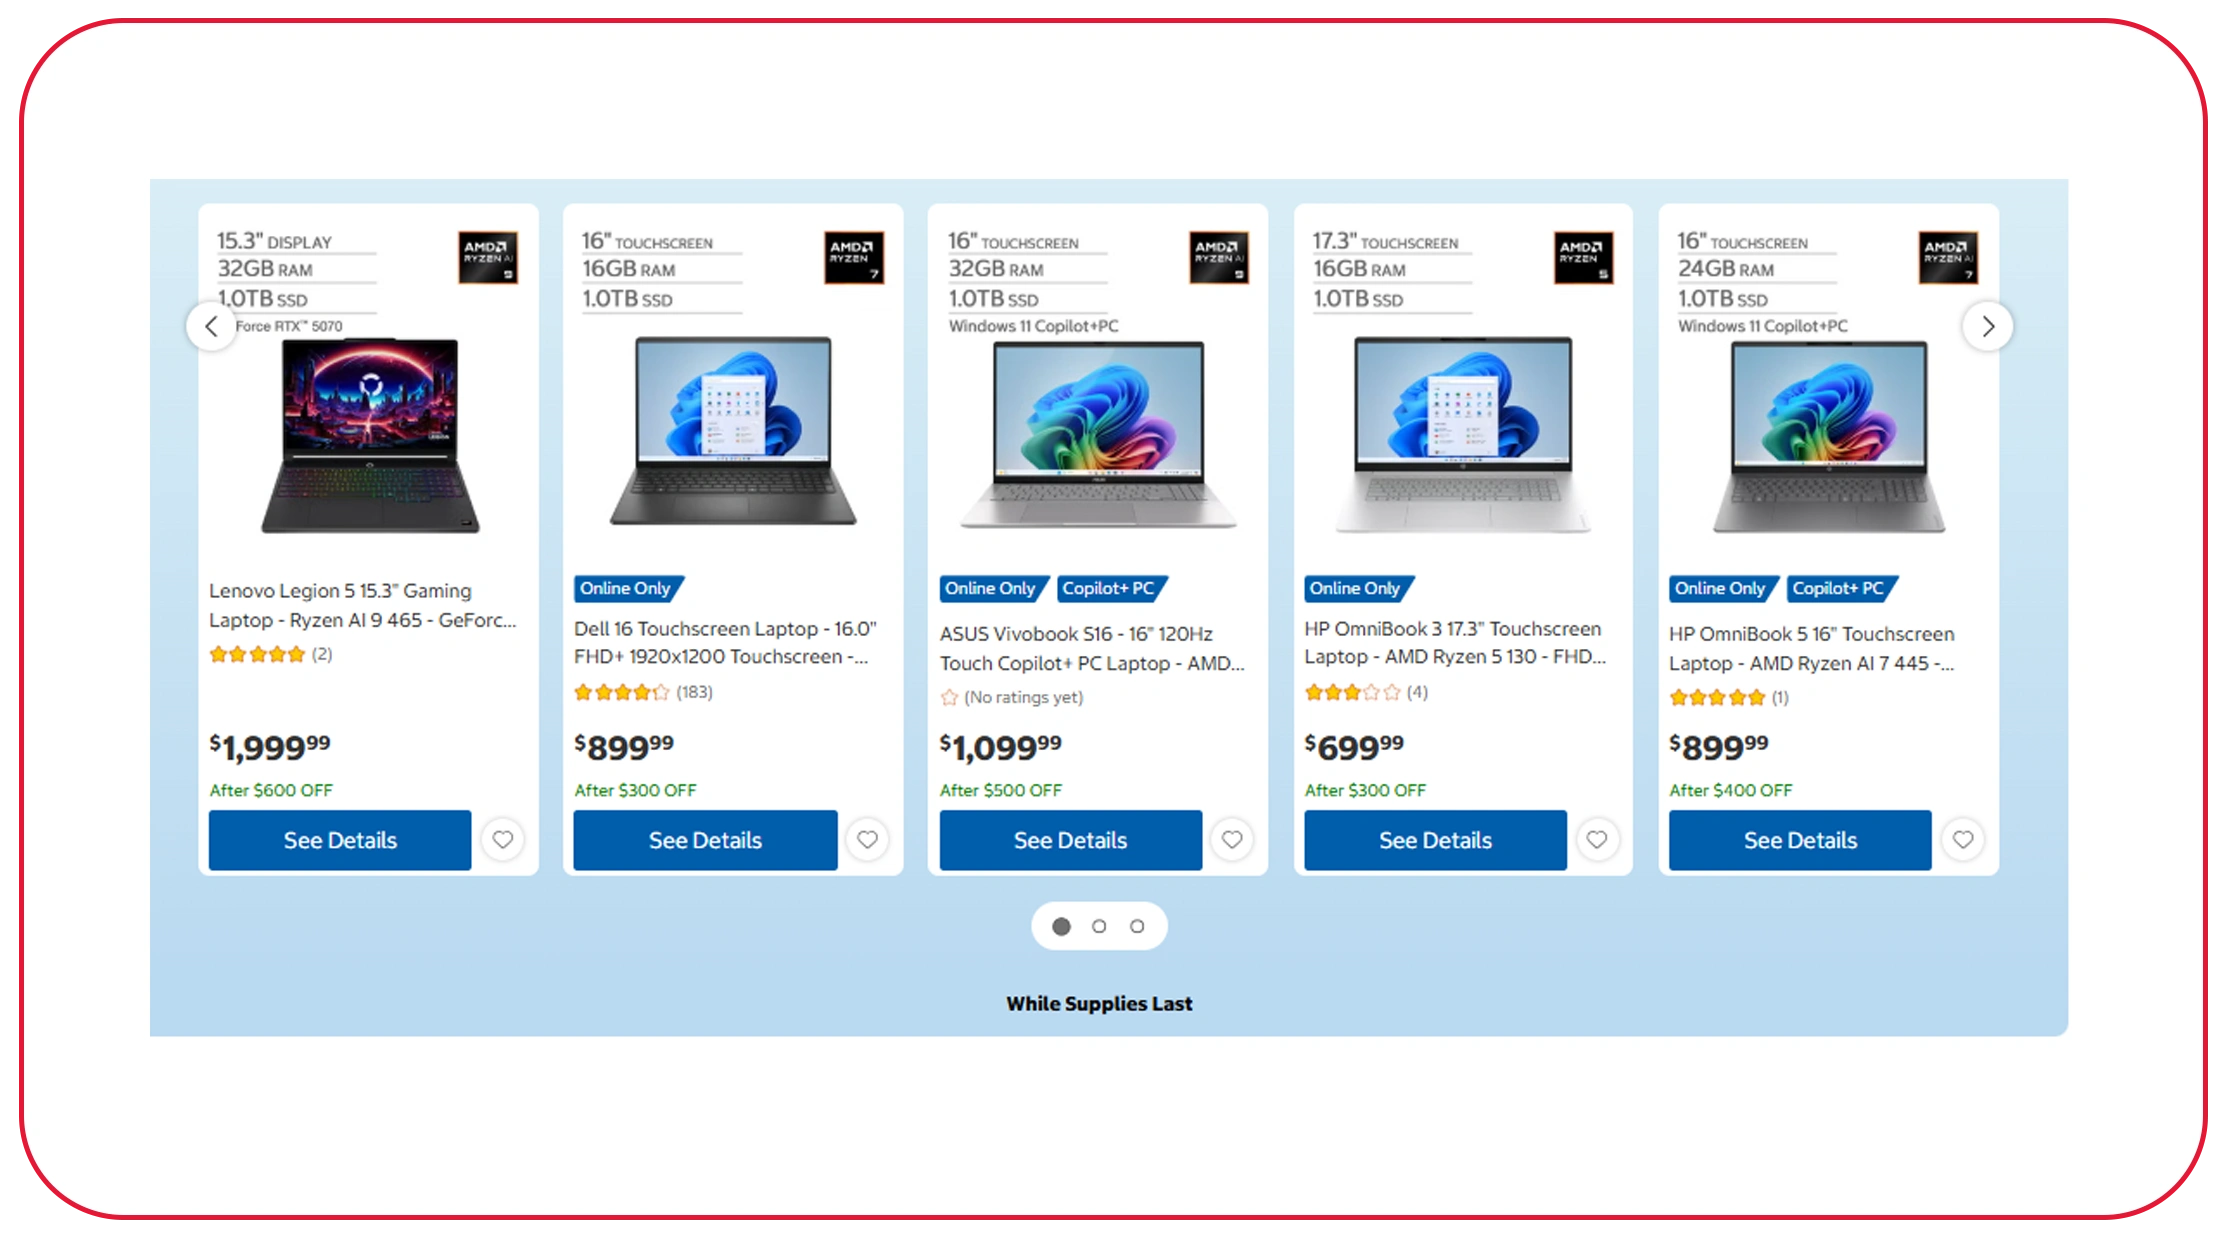
Costco ecommerce data scraping for competitive analysis gives businesses a way to turn a large online catalog into structured market intelligence. Instead of manually checking individual product pages, analysts can organize information by product name, SKU or identifier where available, category, brand, price, promotional price, availability, rating, review count, and product URL.
This is particularly useful when a retailer wants to benchmark its assortment against Costco. A structured dataset can reveal which categories overlap, where competitors have wider assortment coverage, and which products are positioned at different price points.
Costco's financial growth illustrates why retail data tracking has become more important. Net sales increased from $163.22 billion in fiscal 2020 to $192.05 billion in 2021 and $222.73 billion in 2022.
| Fiscal Year | Costco Net Sales | Competitive Research Relevance |
|---|---|---|
| 2020 | $163.22B | Establish a baseline |
| 2021 | $192.05B | Monitor accelerated retail demand |
| 2022 | $222.73B | Expand category benchmarking |
| 2023 | $237.71B | Compare assortment and pricing |
| 2024 | $249.63B | Track mature-market competition |
| 2025 | $269.91B | Strengthen ongoing intelligence |
| 2026 | Ongoing | Monitor current market movement |
2020-2025 figures are Costco fiscal-year net sales. Fiscal 2026 is an ongoing period and should not be treated as a completed annual result.
For a competitive intelligence team, the actionable insight comes from comparing records over time. A retailer can identify products that repeatedly appear in Costco's assortment, compare price bands, monitor promotional activity, and identify gaps in its own catalog.
The key is consistency. A one-time dataset can answer a narrow research question, but recurring collection creates a historical layer that supports trend analysis, benchmarking, and strategic planning.
How Can Businesses Track Retail Prices More Efficiently?
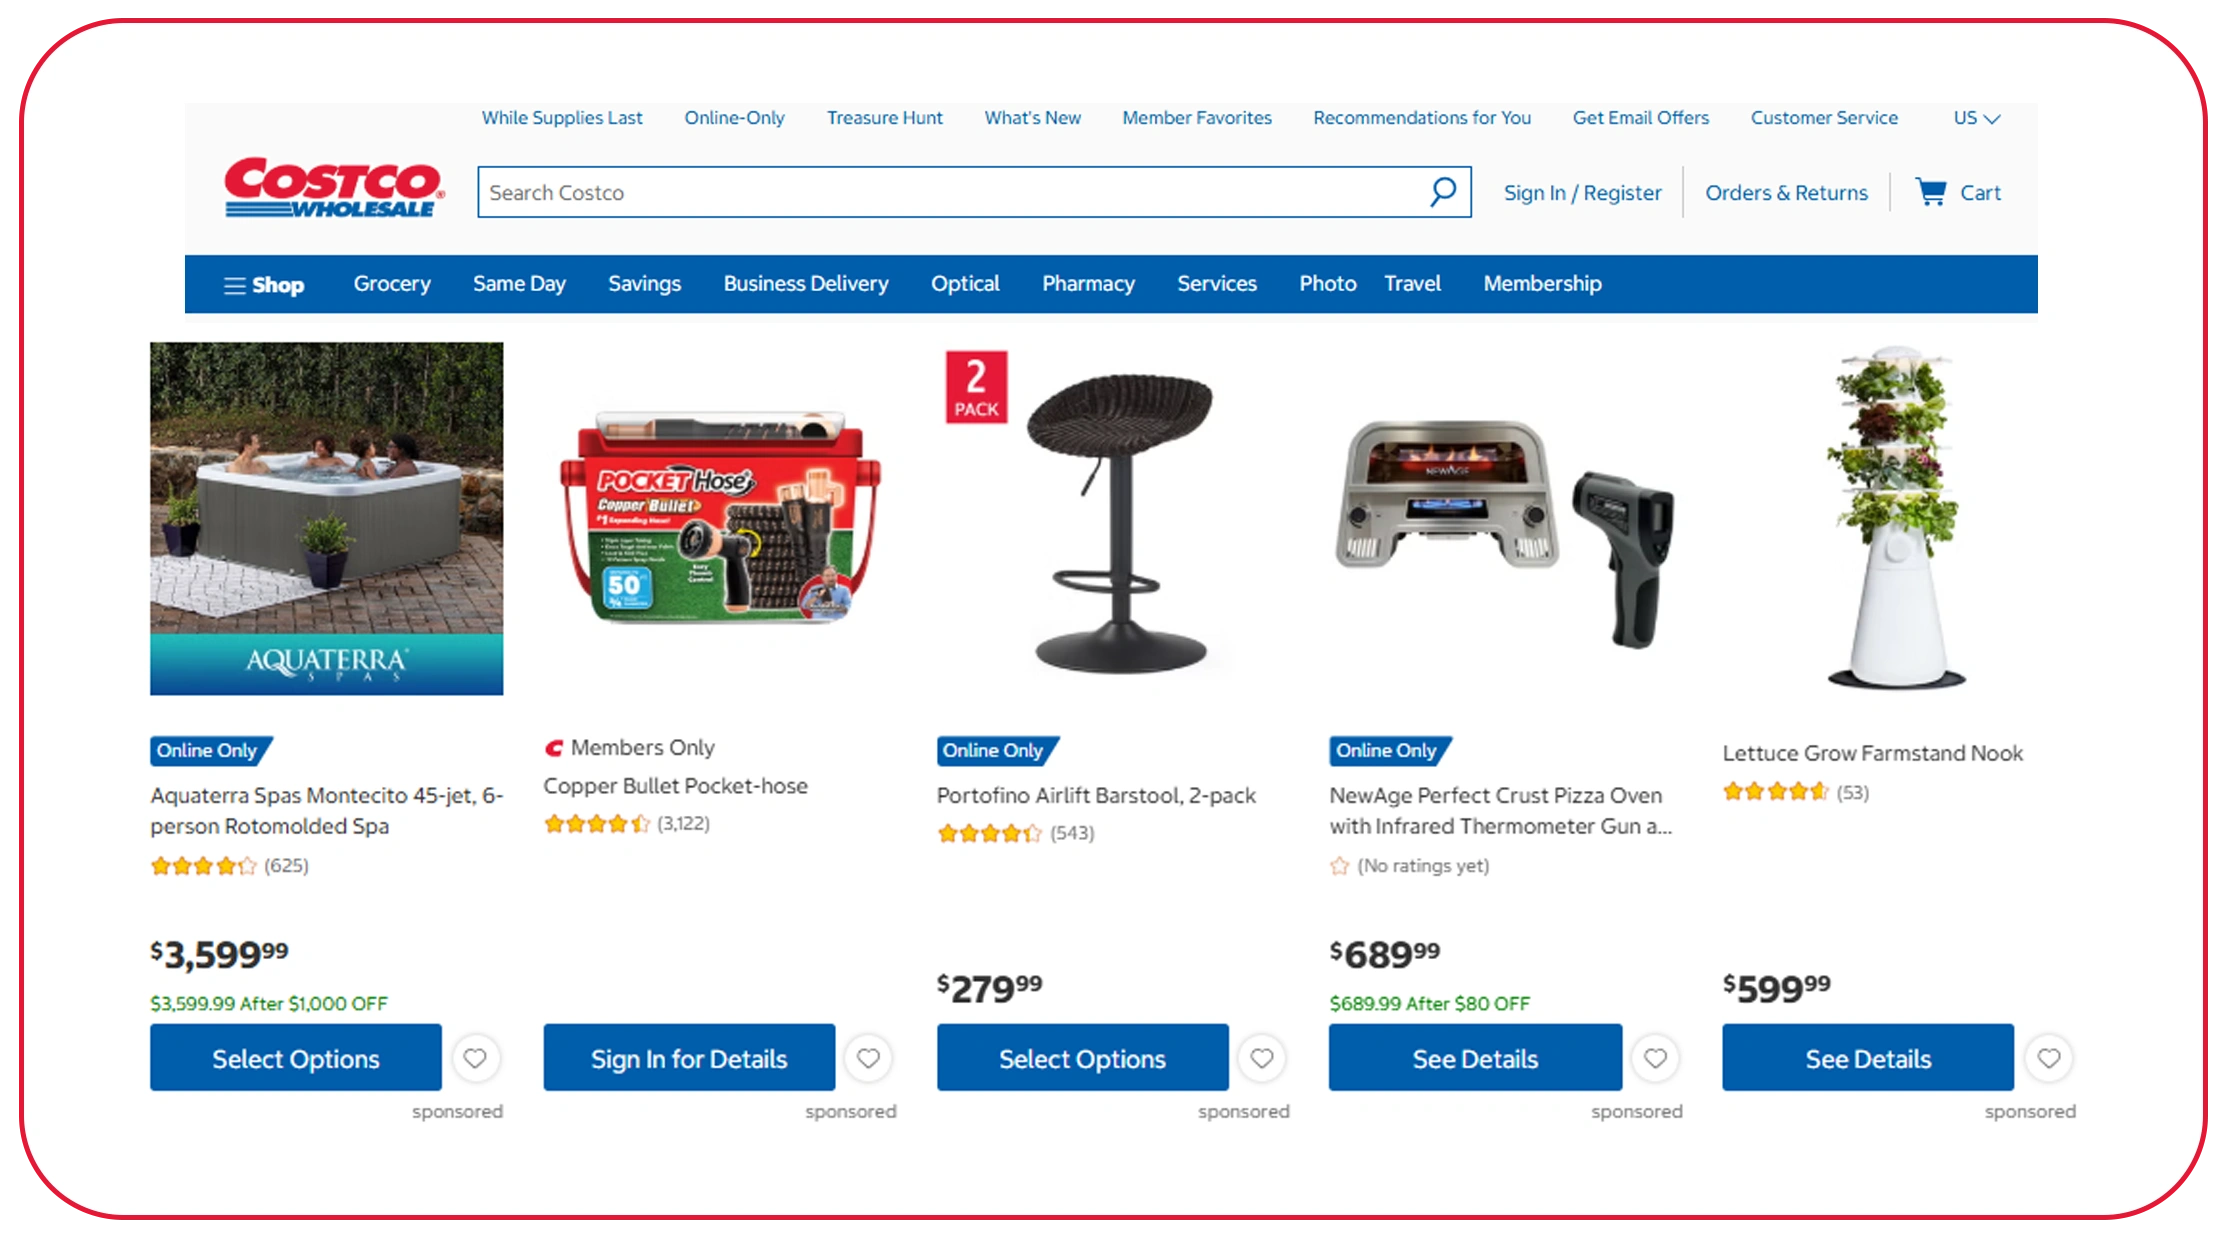
A web data scraper for Costco product prices can help pricing teams monitor product-level price movements without relying on manual page-by-page research. The objective is not simply to capture today's price. It is to build a historical record showing how pricing changes across products and time.
A useful dataset can include regular price, sale price where displayed, discount information, product identifier, category, collection date, availability, and product URL. With these fields, analysts can calculate price changes and identify products that experience repeated adjustments.
Costco's digital growth makes this type of monitoring increasingly relevant. In fiscal 2024, Costco reported 16.1% e-commerce comparable sales growth. In fiscal 2025, e-commerce comparable sales increased 15.6%.
| Fiscal Year | E-commerce Comparable Sales Growth | Pricing Monitoring Opportunity |
|---|---|---|
| 2020 | 50.1% | Establish digital baseline |
| 2021 | 44.4% | Monitor rapid online expansion |
| 2022 | 10.1% | Track normalized growth |
| 2023 | -5.7% | Investigate price and demand shifts |
| 2024 | 16.1% | Increase monitoring frequency |
| 2025 | 15.6% | Maintain competitive price tracking |
| 2026 | 21.1% YTD* | Monitor current digital momentum |
*2026 figure is the digitally enabled comparable-sales growth reported for the first 39 weeks of fiscal 2026, not a full-year result. Costco changed the terminology of this metric in fiscal 2026.
For pricing analysts, historical observations are more valuable than isolated snapshots. If a product is collected weekly, for example, the resulting dataset can reveal whether a price reduction is temporary, recurring, or part of a broader category movement.
This can support price benchmarking, promotional analysis, competitive positioning, and assortment decisions. Real Data API can provide the extraction infrastructure needed to make such monitoring repeatable rather than dependent on manual spreadsheets.
What Product Attributes Should Businesses Collect for Better Retail Intelligence?
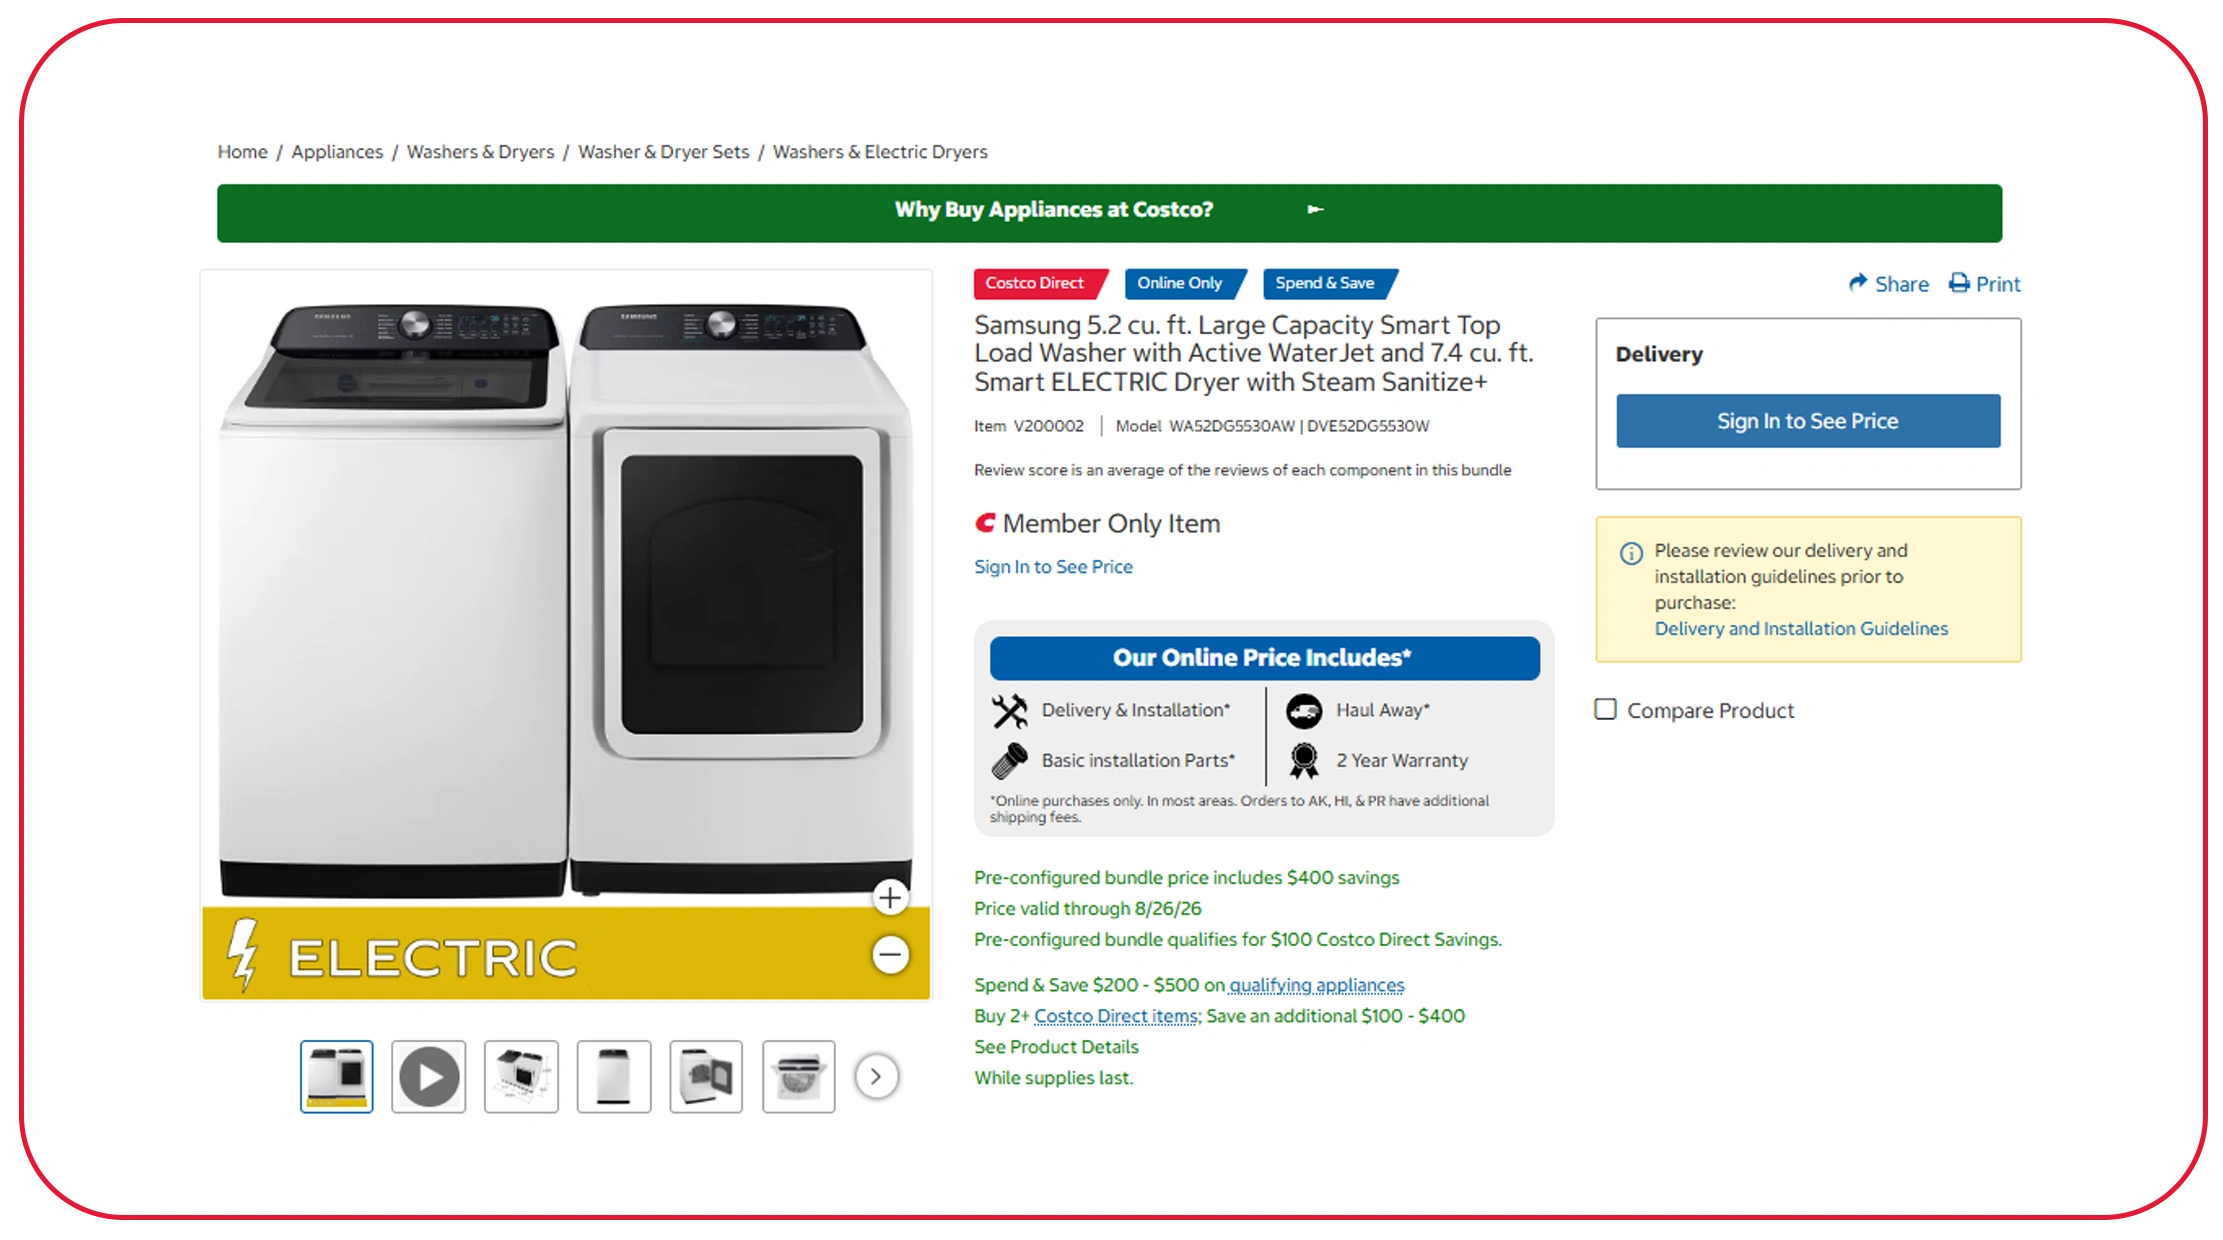
Businesses looking to extract Costco product information using web scraping should focus on collecting fields that directly support their research objectives. Capturing only product names and prices creates a limited dataset. Combining commercial, catalog, and customer-facing attributes produces significantly more analytical value.
A practical product record may include:
- Product title
- Category
- Brand
- Product URL
- Product identifier where publicly available
- Current price
- Promotional price
- Availability
- Product description
- Specifications
- Rating
- Review count
- Images or image URLs where appropriate
- Extraction timestamp
These fields can be normalized into a consistent schema. For example, prices should be stored numerically rather than as unstructured text, while timestamps should follow a standardized format. Product categories should also be mapped consistently so that category-level analysis remains reliable.
Costco's expanding warehouse footprint provides additional context for why product intelligence can become complex. The company reported 817 warehouses in 2021, compared with 923 in January 2026 and 931 by May 2026.
| Year | Costco Warehouses* | Data Collection Implication |
|---|---|---|
| 2020 | 795 | Establish retail footprint baseline |
| 2021 | 817 | Expand market coverage |
| 2022 | 838 | Broaden category monitoring |
| 2023 | 861 | Increase competitive coverage |
| 2024 | 882 | Track wider retail footprint |
| 2025 | 914 | Scale product intelligence |
| 2026 | 931 | Support broader current-market analysis |
*Warehouse counts represent reported year-end or period-end figures and may vary by reporting date.
For businesses, this means product research should be designed as a data system rather than a collection of isolated files. Timestamped records make it possible to understand what changed, when it changed, and how frequently it changed.
That historical context is essential for building reliable retail intelligence.
How Can Companies Detect Pricing Changes Faster?
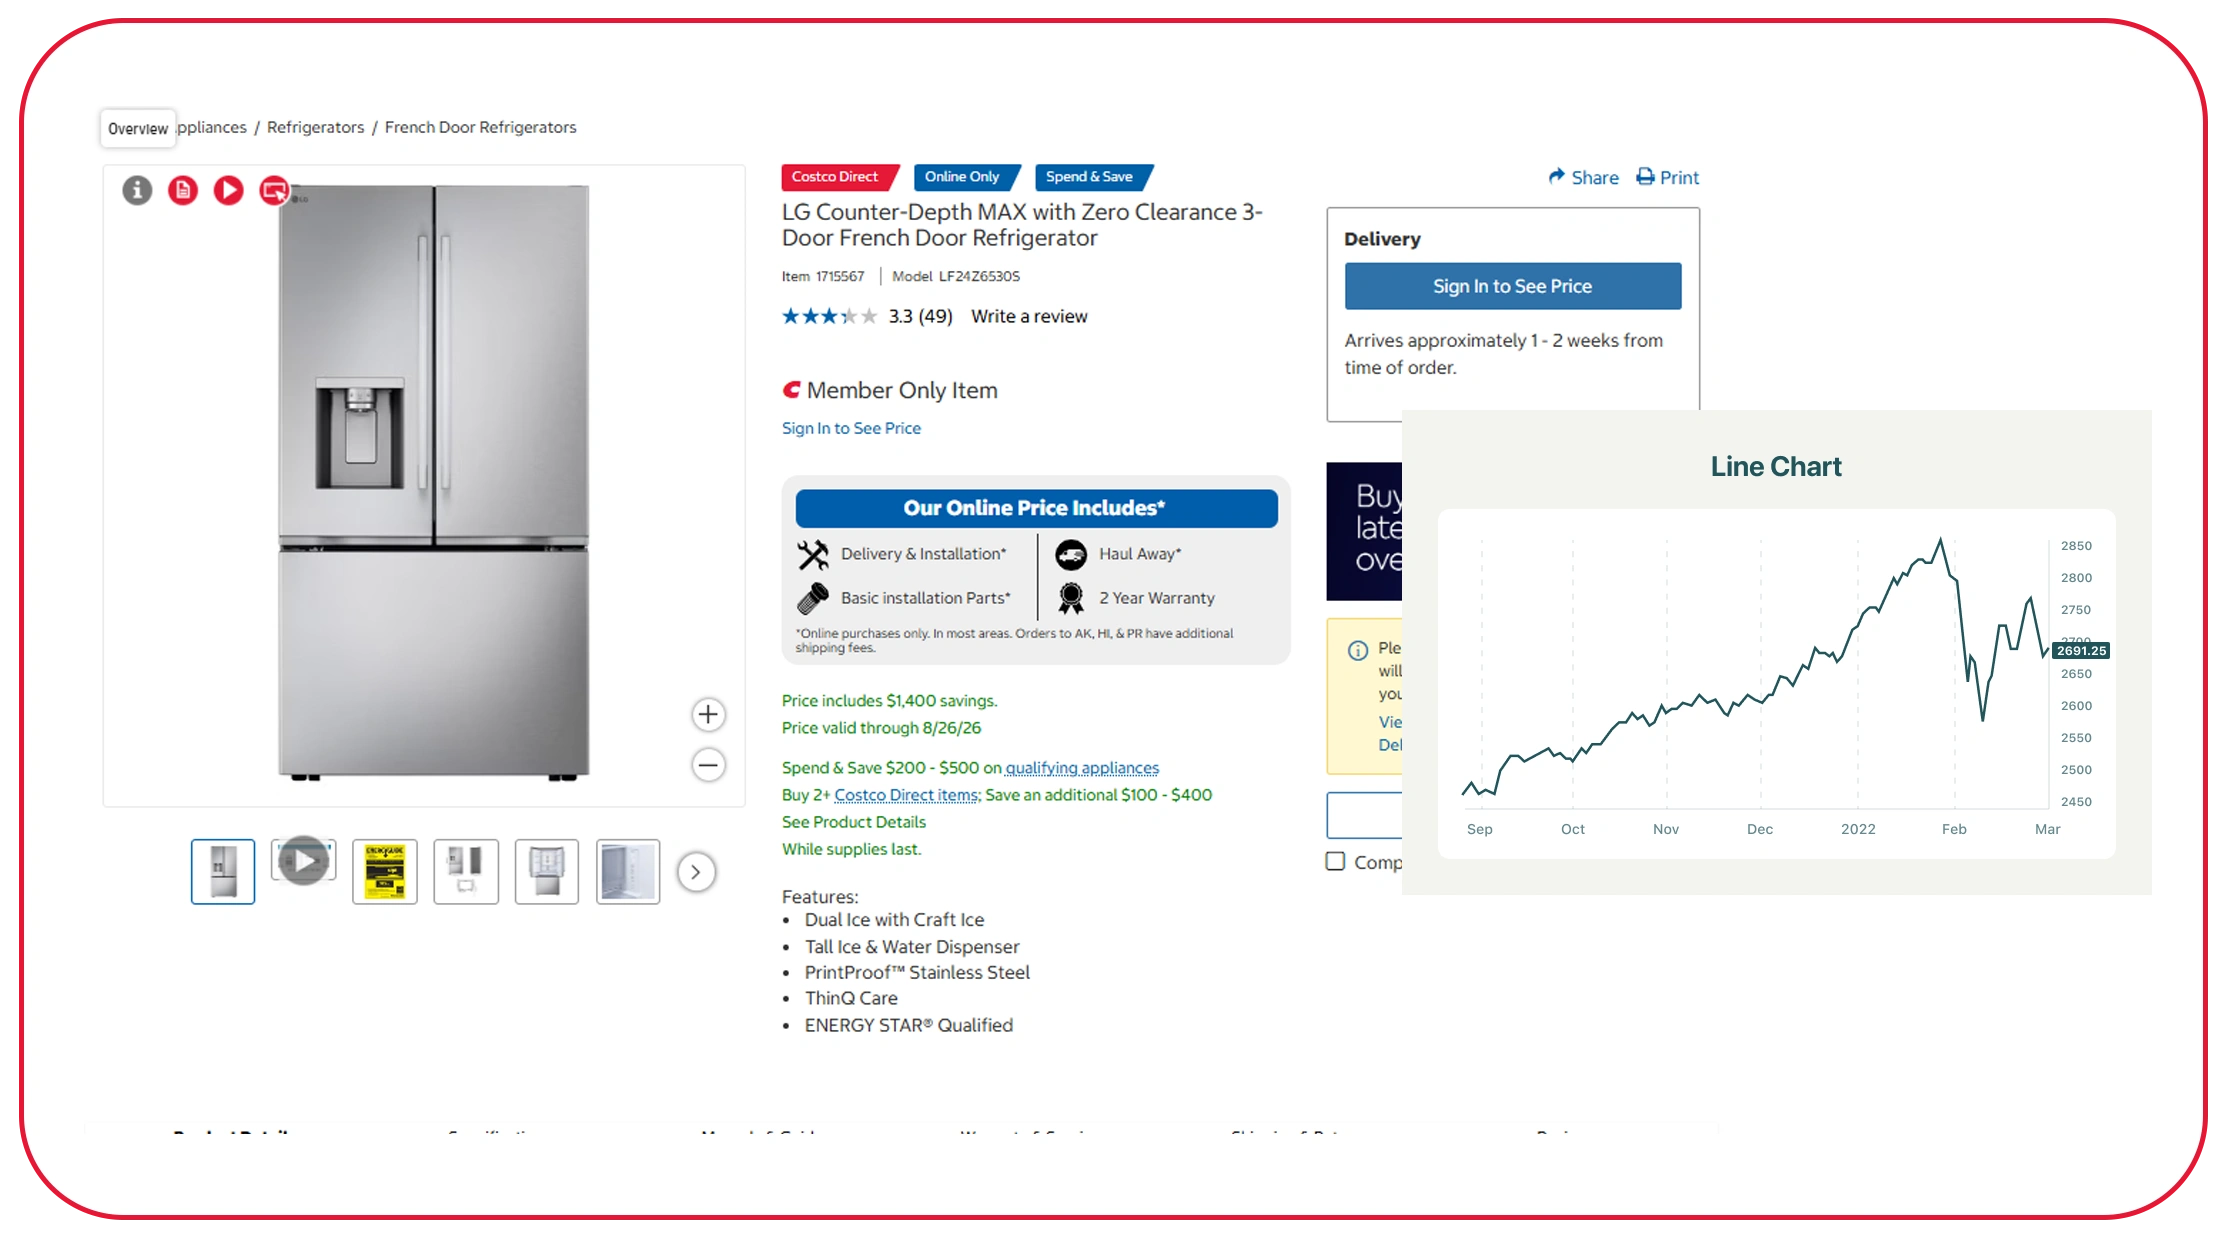
A real-time Costco pricing data API can help businesses reduce the delay between a market change and its detection. For pricing teams, speed matters when competitors change prices, promotions begin, or product availability shifts.
A monitoring workflow can compare newly collected records with historical observations. When the system detects a material change, it can flag the product for further review. This allows analysts to focus their attention on exceptions instead of manually checking every product.
Costco's recent digital performance reinforces the need for timely monitoring. In July 2025, Costco reported e-commerce comparable sales growth of 15.1% for the month and 15.3% for the first 48 weeks. In April 2026, its digitally enabled comparable sales increased 18.4% for the month and 21.1% year to date.
| Period | Digital/E-commerce Growth | Potential Monitoring Response |
|---|---|---|
| 2020 | 49.5% fiscal-year growth | Establish frequent collection |
| 2021 | 44.4% | Increase digital catalog coverage |
| 2022 | 10.1% | Maintain historical monitoring |
| 2023 | -5.7% | Investigate market changes |
| 2024 | 16.1% | Increase competitive tracking |
| 2025 | 15.6% | Monitor pricing continuously |
| 2026 | 21.1% YTD | Prioritize real-time intelligence |
The figures use Costco's reported e-commerce or digitally enabled comparable-sales metrics; the terminology changed in fiscal 2026.
A real-time architecture does not necessarily mean collecting every product every minute. A more efficient strategy is to assign collection frequencies based on business value. High-priority products can be checked more frequently, while stable products can follow a lower-frequency schedule.
This reduces unnecessary processing while preserving the ability to detect important changes quickly.
How Can Product and Review Data Improve Consumer Analysis?
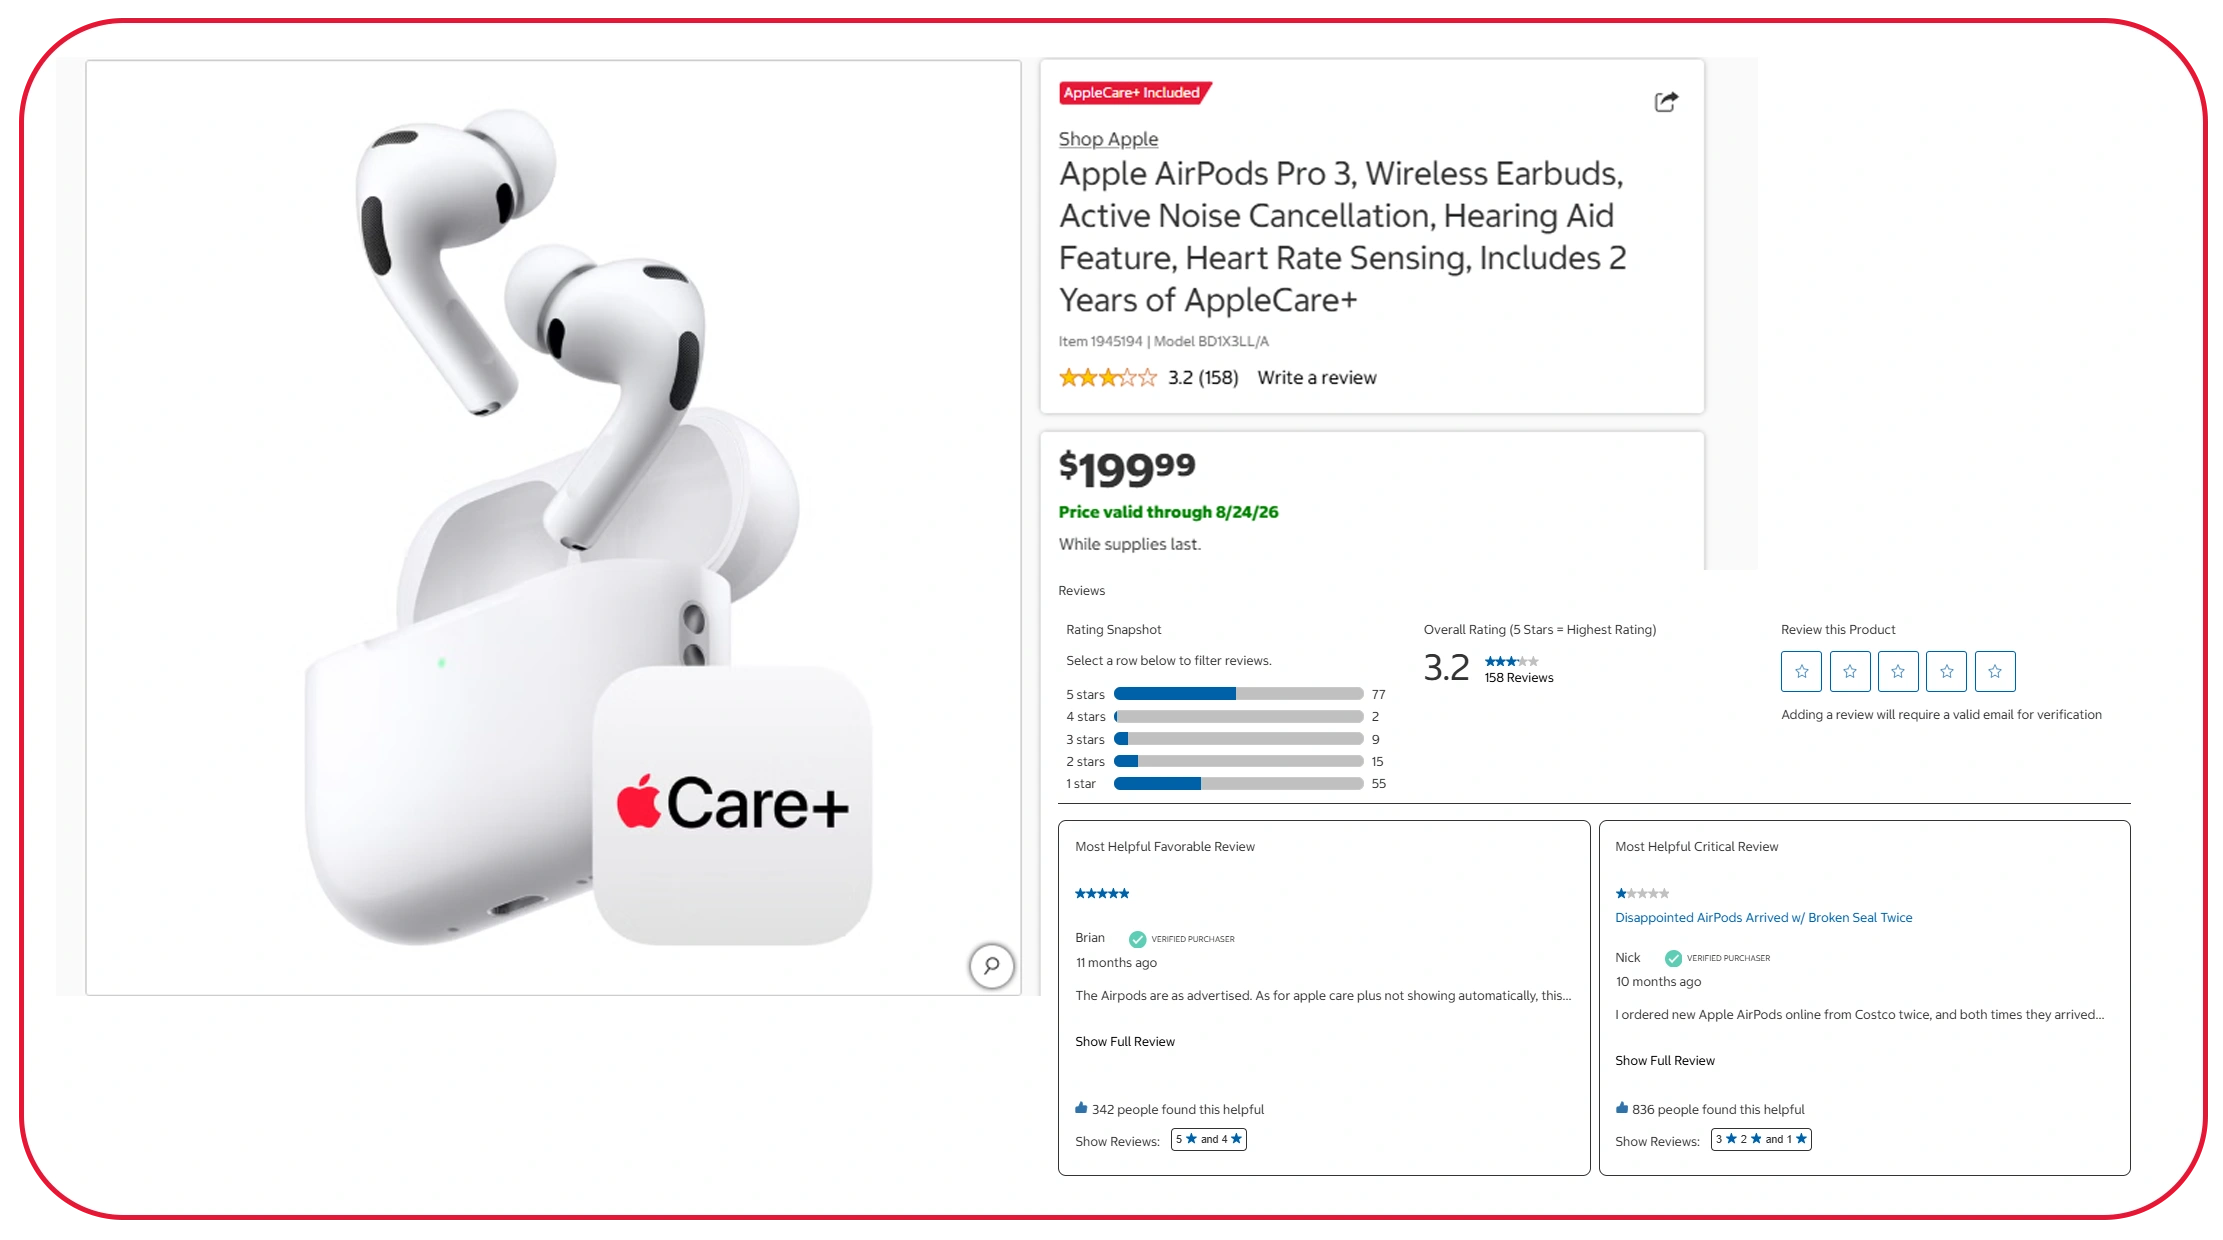
Costco Product and Review Datasets can help businesses understand not only what products are listed but also how customers respond to them. Product data provides the commercial context, while review information can add customer-facing signals such as ratings, review counts, and publicly available review text where collection is permitted.
Combining these fields creates opportunities for product benchmarking, sentiment research, category analysis, and customer preference studies. For example, analysts can compare highly rated products with pricing levels or identify categories where review activity is increasing.
A longitudinal dataset can also show whether products accumulate reviews over time and whether changes in product visibility correspond with changes in customer engagement.
| Year | Costco Net Sales | Potential Product/Review Analysis |
|---|---|---|
| 2020 | $163.22B | Build baseline catalog research |
| 2021 | $192.05B | Study online demand expansion |
| 2022 | $222.73B | Expand review benchmarking |
| 2023 | $237.71B | Compare category performance |
| 2024 | $249.63B | Analyze product-level trends |
| 2025 | $269.91B | Strengthen customer intelligence |
| 2026 | Ongoing | Track current product signals |
Net sales are company-level context and do not represent product-level review volume.
For an e-commerce analyst, the benefit is the ability to connect multiple dimensions. A product can be evaluated by price, availability, category, rating, review volume, and historical changes rather than by price alone.
For brands and retailers, this can support product development, assortment planning, competitive benchmarking, and consumer research.
Data quality is particularly important here. Review counts and ratings should be captured with timestamps because they can change. The same product should also be consistently identified across collection cycles so that historical records can be joined correctly.
How Does Automated Retail Extraction Solve Manual Tracking Problems?
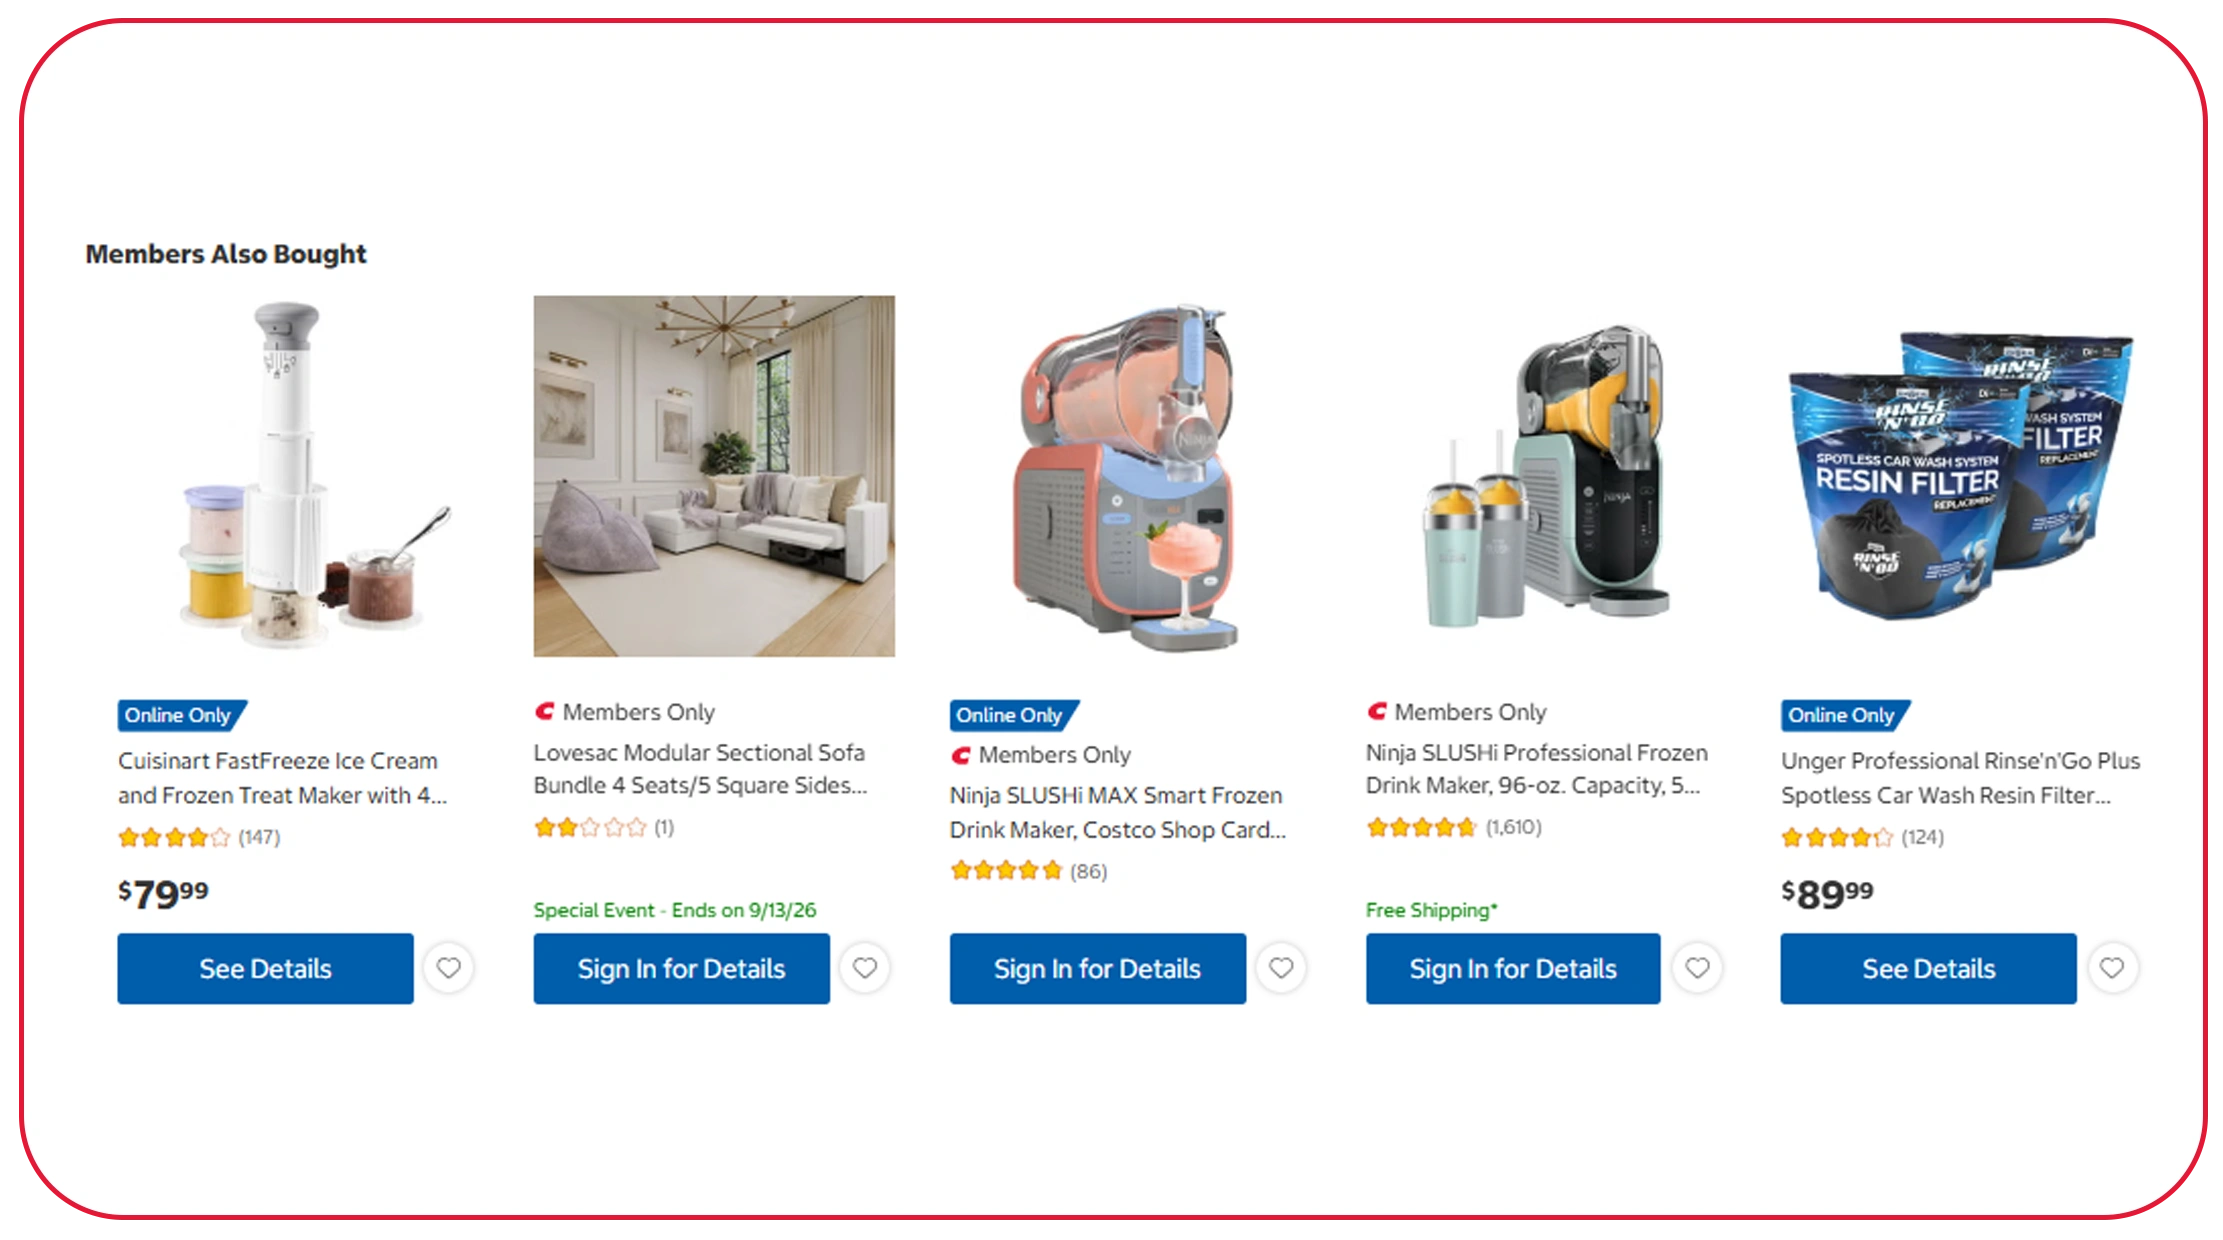
A Costco Scraper, Costco web data scraper for product information workflow can solve the central problem of manual product tracking: scale. A human researcher may be able to review a limited number of products, but maintaining thousands of records across repeated collection cycles requires automation, normalization, validation, and historical storage.
A scalable pipeline can follow a simple sequence:
- Identify target product pages or categories
- Collect permitted publicly available information
- Normalize fields
- Validate records
- Attach timestamps
- Store historical snapshots
- Expose the resulting data for analysis
This architecture becomes increasingly useful as Costco's digital operations expand. Costco operates e-commerce sites across the United States, Canada, the United Kingdom, Mexico, Korea, Taiwan, Japan, Australia, and China, according to its 2026 sales reporting.
| Year | Digital/Retail Indicator | Recommended Data Strategy |
|---|---|---|
| 2020 | E-commerce surged 49.5% | Build structured collection |
| 2021 | E-commerce grew 44.4% | Expand product coverage |
| 2022 | E-commerce grew 10.1% | Maintain historical records |
| 2023 | E-commerce declined 5.7% | Increase change detection |
| 2024 | E-commerce grew 16.1% | Strengthen price monitoring |
| 2025 | E-commerce grew 15.6% | Automate recurring extraction |
| 2026 | Digitally enabled growth 21.1% YTD | Scale current intelligence |
Figures represent Costco's reported comparable-sales metrics and are not direct measures of website traffic or product count.
The most effective solution is therefore not simply a scraper. It is an end-to-end data workflow that treats product information as a continuously changing dataset.
For a pricing intelligence company, retailer, marketplace analyst, or research provider, this approach can reduce repetitive work and make historical comparison much easier.
Why Choose Real Data API?
Real Data API is designed for organizations that need scalable web data extraction rather than one-off manual research. Buying Trends Analysis via Costco Data Scraping can help businesses convert product, pricing, availability, and customer-facing signals into structured datasets for retail intelligence.
The main advantage is the ability to build a repeatable workflow around business requirements. Teams can define the fields they need, establish collection schedules, maintain historical records, and integrate outputs with databases, dashboards, analytical applications, or internal research systems.
Combined with Costco web data scraper for product information, this approach can support several practical use cases: competitor benchmarking, price intelligence, assortment monitoring, product research, review analysis, buying-trend analysis, and market research.
For data-product companies, an API-based architecture also makes it easier to incorporate extracted information into downstream applications. For retailers, it can reduce manual catalog checking. For market researchers, it can provide a structured foundation for recurring analysis.
The emphasis should remain on data quality, lawful collection practices, consistent schemas, timestamping, and validation. These elements determine whether extracted information becomes reliable intelligence or merely a large collection of raw records.
Conclusion
Product tracking becomes difficult when catalog size, price changes, inventory movements, and customer signals exceed the capacity of manual research. Costco web data scraper for product information provides a scalable approach for collecting and organizing these changing signals into structured datasets.
The business value comes from consistency. Regular extraction can create historical product records that allow teams to identify price changes, compare assortments, monitor availability, evaluate customer feedback, and understand broader retail trends.
Costco's reported growth provides a strong reason for businesses to treat its online catalog as an ongoing intelligence source. Fiscal 2025 net sales reached $269.9 billion, while e-commerce comparable sales grew 15.6%. In fiscal 2026, Costco continued reporting strong digitally enabled growth, including 21.1% for the first 39 weeks.
For pricing analysts, retailers, e-commerce businesses, market researchers, and data-product companies, the goal should be more than collecting data. The goal is to create a reliable pipeline that turns changing product information into actionable intelligence.
Connect with Real Data API to build a scalable product, pricing, availability, and review data pipeline for competitive intelligence and retail market analysis!
Latest posts
Truthsocial Data Scraping For Real-Time Social Media Insights
Zara Web Data Scraper For Fashion Trend Analysis - How Retailers Overcome Fast-Changing Fashion Demand & Inventory Challenges
How Real Estate Web Scraping Using Bayut API Solves Rental Pricing and Property Tracking Problems?
How Trendyol Data Collection for Ecommerce Market Research Solves Assortment, Pricing, and Market Intelligence Challenges?






.png)



